

Key Insights
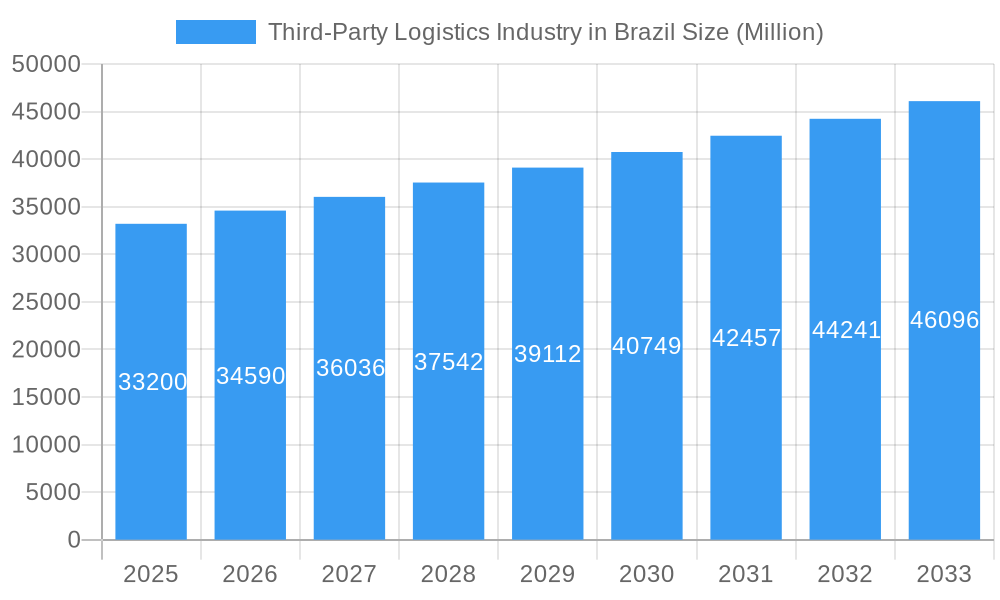
The Brazilian third-party logistics (3PL) market, valued at $33.20 billion in 2025, exhibits robust growth potential, driven by the expansion of e-commerce, increasing demand for efficient supply chain solutions, and the country's burgeoning manufacturing sector. A compound annual growth rate (CAGR) of 4.26% is projected from 2025 to 2033, indicating a steady rise in market size. Key growth drivers include the rising adoption of advanced technologies like warehouse management systems (WMS) and transportation management systems (TMS) to enhance operational efficiency and visibility. Furthermore, the increasing focus on sustainability and supply chain resilience within the logistics sector contributes to market expansion. The segment encompassing domestic transportation management holds the largest market share due to Brazil's vast geographical expanse and internal trade dynamics. Major end-user sectors fueling this growth include automobiles, chemicals, consumer goods and retail, and energy, reflecting the diversified nature of the Brazilian economy. While regulatory hurdles and infrastructural limitations pose challenges, ongoing investments in infrastructure modernization and streamlined regulatory frameworks are mitigating these constraints, supporting the continued expansion of the 3PL market.
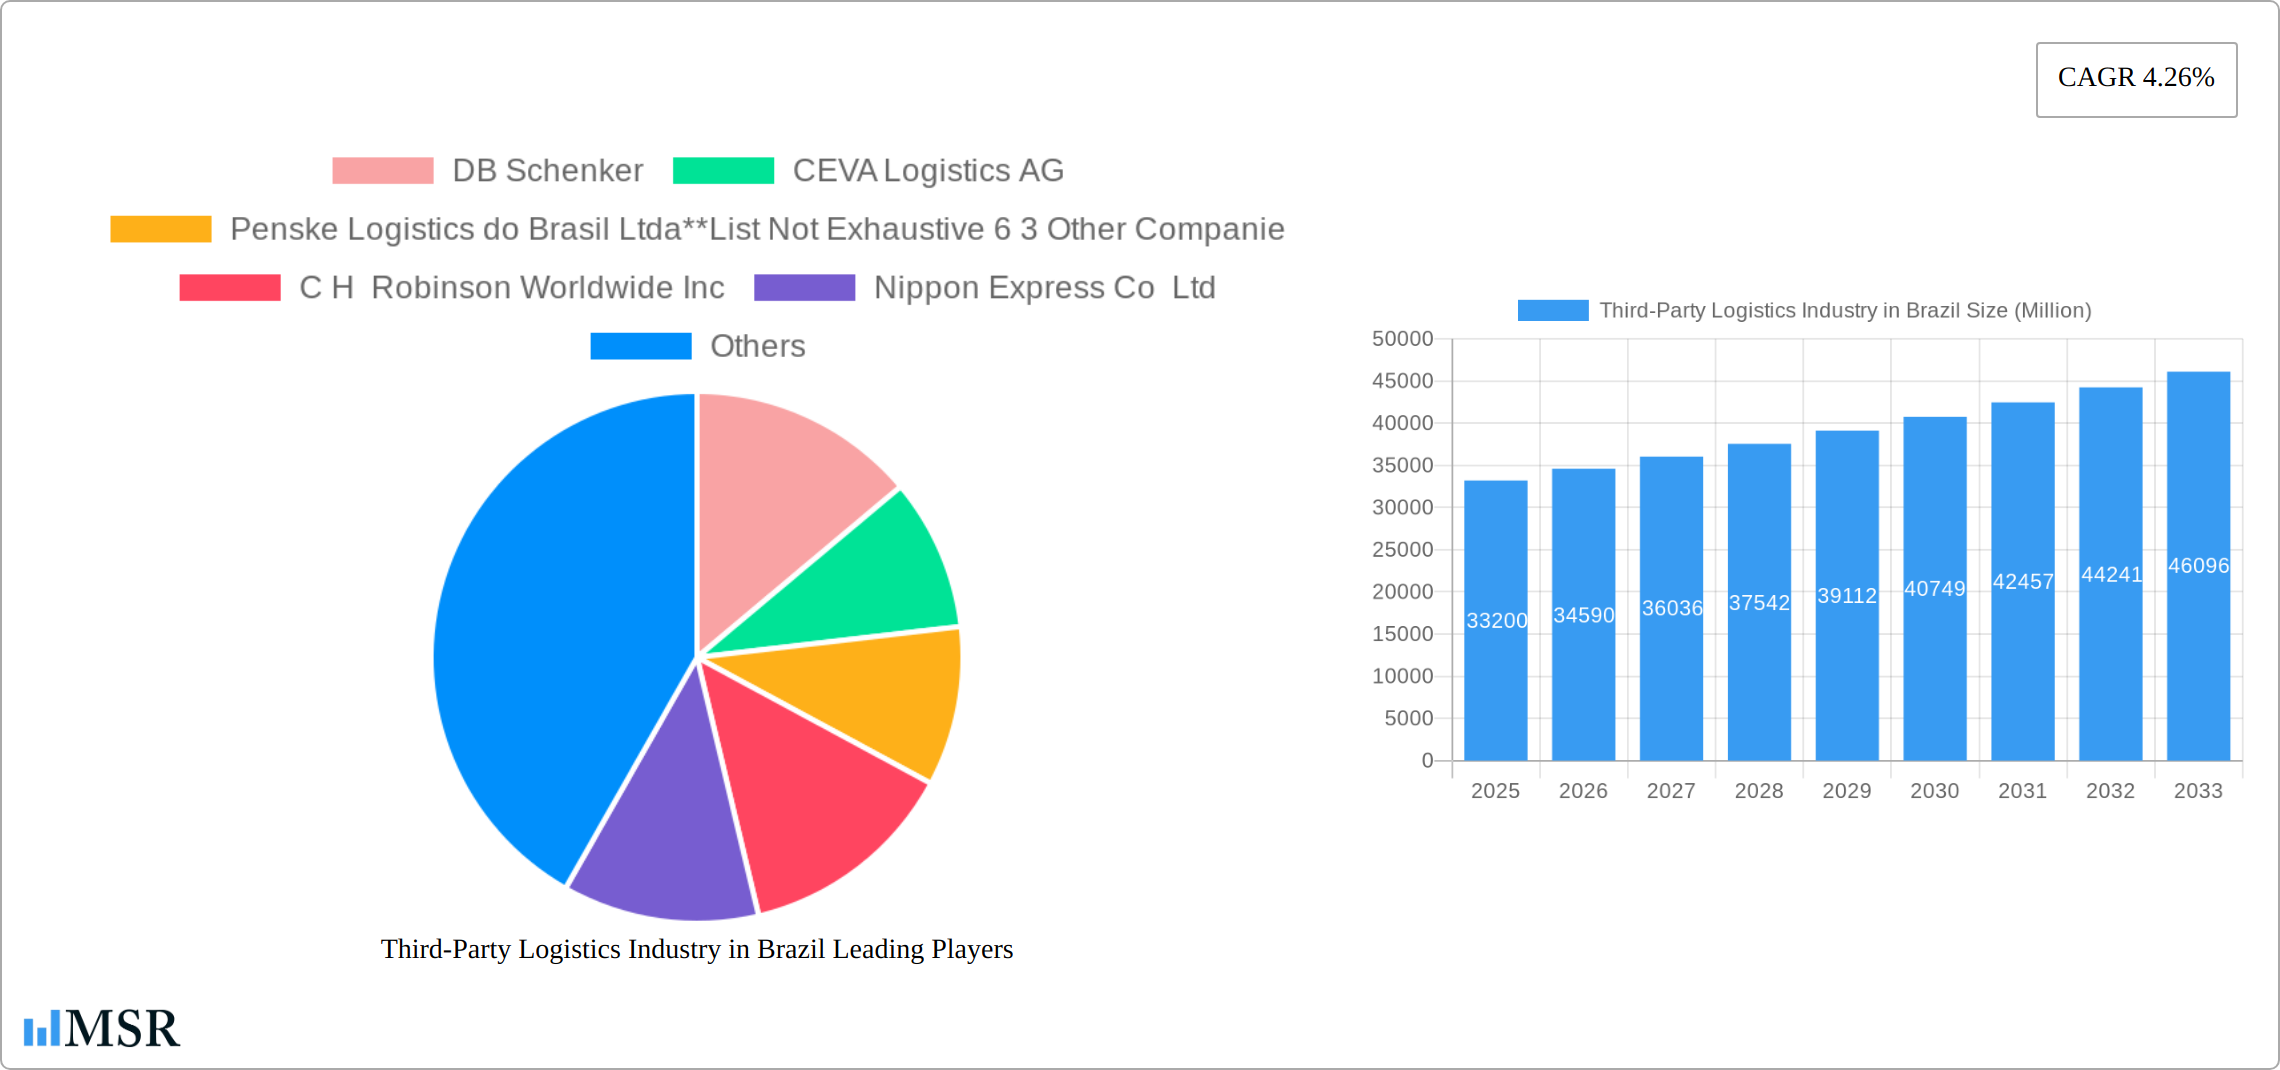
Third-Party Logistics Industry in Brazil Market Size (In Billion)
The competitive landscape features both international giants like DB Schenker, Kuehne + Nagel, and FedEx, and established domestic players like BBM Logística and Gafor SA. The presence of both global and local players fosters competition, driving innovation and service improvements. The market is further segmented by service type (domestic and international transportation management, value-added warehousing and distribution) and end-user industry. Future growth will be influenced by factors such as government initiatives supporting infrastructure development, the adoption of automation technologies, and the evolving needs of businesses seeking efficient and cost-effective logistics solutions amidst a dynamically changing global economy. The continuous expansion of e-commerce will be a particularly strong driver of growth in the value-added warehousing and distribution segment, pushing for greater warehouse capacity and advanced fulfillment solutions.
Third-Party Logistics Industry in Brazil Company Market Share
Brazil's Third-Party Logistics (3PL) Market: A Comprehensive Report (2019-2033)
This in-depth report provides a comprehensive analysis of Brazil's dynamic 3PL industry, offering invaluable insights for stakeholders, investors, and businesses seeking to navigate this rapidly evolving market. Covering the period from 2019 to 2033, with a focus on 2025, this report delivers actionable intelligence on market size, growth drivers, competitive landscape, and future opportunities. The Brazilian 3PL market, valued at XX Million in 2025, is projected to experience a CAGR of XX% from 2025 to 2033, reaching XX Million by 2033.
Third-Party Logistics Industry in Brazil Market Concentration & Dynamics
Brazil's 3PL market is characterized by a moderate level of concentration, where a blend of prominent global logistics providers and robust domestic enterprises actively compete for market dominance. As of 2025, the top five entities, including industry leaders such as DB Schenker, CEVA Logistics AG, and Penske Logistics do Brasil Ltda, alongside other significant players like C.H. Robinson Worldwide Inc, Nippon Express Co Ltd, Kuehne + Nagel International AG, FedEx, BBM Logística SA, and DSV AS, are estimated to collectively command approximately **XX%** of the total market share. Despite this concentration at the top, a substantial network of smaller, regionally focused logistics providers plays a vital role in driving the overall market activity and catering to diverse local demands.
Key Market Dynamics:
- Embracing the Innovation Ecosystem: The Brazilian 3PL landscape is increasingly characterized by the integration of cutting-edge technologies. Advanced solutions such as Artificial Intelligence (AI) for predictive analytics and route optimization, the Internet of Things (IoT) for real-time asset tracking and condition monitoring, and blockchain for enhanced transparency and security in supply chain transactions are becoming standard, leading to significant improvements in supply chain visibility and operational efficiency.
- Navigating the Regulatory Framework: The operational landscape for 3PL providers in Brazil is profoundly shaped by a complex web of government regulations governing transportation, warehousing, and customs procedures. These regulations directly influence operational costs and dictate strategic planning. Consequently, shifts in policy, such as changes in import/export rules, tax structures, or transportation mandates, can introduce both substantial opportunities and considerable challenges for businesses operating within the sector.
- Evolving Substitute Products and Services: The competitive environment is being reshaped by the emergence of innovative alternative logistics and transportation solutions. Services like crowdsourced delivery platforms and on-demand logistics networks are gaining traction, offering flexible and often more agile options that present a growing competitive threat to traditional 3PL models.
- Responding to End-User Trends: The exponential growth of e-commerce in Brazil, coupled with evolving consumer expectations for faster, more reliable, and transparent delivery services, is a primary catalyst for the increasing demand for sophisticated and technologically advanced 3PL solutions. Consumers' desire for real-time tracking and flexible delivery windows is pushing 3PL providers to invest in enhanced capabilities.
- Strategic M&A Activities: The Brazilian 3PL sector has experienced a consistent pattern of mergers and acquisitions (M&A) over the past several years (approximately **XX deals between 2019-2024**). These activities are largely propelled by strategic objectives such as market consolidation, expansion into new geographical regions or service offerings, and the acquisition of specialized technological capabilities by larger players seeking to fortify their competitive positions.
Third-Party Logistics Industry in Brazil Industry Insights & Trends
The growth trajectory of the Brazilian Third-Party Logistics (3PL) market is being propelled by a confluence of powerful economic and social forces. The rapid expansion of e-commerce, a direct consequence of increasing internet penetration and a burgeoning middle class, is significantly amplifying the demand for sophisticated and efficient logistics solutions. This is further amplified by ongoing urbanization trends and a general rise in consumer spending power. The country's robust and expanding manufacturing sector, particularly in critical industries such as automotive, chemicals, and consumer goods, serves as another robust pillar supporting market growth.
Technological advancements are at the forefront of operational improvements. The widespread adoption of advanced Transportation Management Systems (TMS) and Warehouse Management Systems (WMS) is instrumental in streamlining operations, optimizing resource allocation, and enhancing overall supply chain efficiency. Concurrently, substantial and ongoing investments in infrastructure development across Brazil are critically improving connectivity between key economic hubs and gradually reducing overall transportation costs. However, the market is not without its obstacles. Persistent challenges include persistent infrastructure deficits in certain remote or less-developed regions, complex bureaucratic processes that can impede operational fluidity, and the inherent volatility of the Brazilian economic landscape. Despite these hurdles, the market demonstrated resilience, with a market size of **XX Million** in 2024, and its projected growth indicates a highly promising future for the industry.
Key Markets & Segments Leading Third-Party Logistics Industry in Brazil
While the Brazilian 3PL market operates nationally, key regions exhibit higher growth rates due to concentrated economic activity and infrastructural development. The Southeast region, housing major industrial hubs and significant population centers, dominates the market.
Dominant Segments:
- By Services: Value-added warehousing and distribution services are experiencing the highest growth due to e-commerce expansion and the need for specialized handling. International transportation management is also a significant segment, driven by Brazil's growing global trade.
- By End User: The automobile, consumer and retail, and chemicals sectors are the largest contributors to the 3PL market demand. The growth of these sectors directly impacts the demand for logistics services.
Growth Drivers:
- Economic Growth: Consistent GDP growth boosts industrial activity, leading to increased demand for logistics services.
- Infrastructure Development: Investments in roads, railways, and ports enhance connectivity and reduce transportation costs, facilitating market expansion.
- E-commerce Boom: The rapid growth of online retail necessitates efficient and reliable 3PL solutions for order fulfillment and last-mile delivery.
Third-Party Logistics Industry in Brazil Product Developments
The Brazilian 3PL market is witnessing significant product innovations focused on enhancing efficiency, visibility, and sustainability. Advanced technologies like AI-powered route optimization, real-time tracking systems, and automated warehousing solutions are gaining traction. These innovations are enabling 3PL providers to offer customized, value-added services, improving their competitive edge and meeting the evolving demands of their clients. Focus on sustainable practices like eco-friendly transportation and optimized warehouse operations is also emerging.
Challenges in the Third-Party Logistics Industry in Brazil Market
Achieving sustainable and robust long-term growth within Brazil's 3PL market necessitates a concerted effort to address fundamental challenges. This includes strategically tackling infrastructure deficiencies, particularly in underserved regions, and streamlining regulatory frameworks to foster more agile and efficient operations. Embracing and integrating technological innovations is paramount for enhancing overall efficiency, improving service delivery, and maintaining a competitive edge. Crucially, fostering strong public-private partnerships will be instrumental in driving the necessary investments in both critical infrastructure development and advanced technological adoption, thereby paving the way for a more resilient and prosperous future for the industry.
Forces Driving Third-Party Logistics Industry in Brazil Growth
Several factors are fueling the growth of Brazil's 3PL market. Technological advancements in automation and data analytics are increasing efficiency and optimizing supply chain operations. Government initiatives focused on infrastructure development and streamlining regulations are improving the ease of doing business. Furthermore, the continued growth of e-commerce and expanding manufacturing sectors contribute significantly to rising demand for 3PL services.
Challenges in the Third-Party Logistics Industry in Brazil Market
Achieving sustainable and robust long-term growth within Brazil's 3PL market necessitates a concerted effort to address fundamental challenges. This includes strategically tackling infrastructure deficiencies, particularly in underserved regions, and streamlining regulatory frameworks to foster more agile and efficient operations. Embracing and integrating technological innovations is paramount for enhancing overall efficiency, improving service delivery, and maintaining a competitive edge. Crucially, fostering strong public-private partnerships will be instrumental in driving the necessary investments in both critical infrastructure development and advanced technological adoption, thereby paving the way for a more resilient and prosperous future for the industry.
Emerging Opportunities in Third-Party Logistics Industry in Brazil
The Brazilian 3PL market presents significant opportunities for growth in areas such as last-mile delivery optimization for e-commerce, specialized logistics solutions for emerging sectors like renewable energy, and the incorporation of sustainable practices throughout the supply chain. The increasing adoption of technology and the rise of the digital economy will open up new avenues for innovation and market expansion.
Leading Players in the Third-Party Logistics Industry in Brazil Sector
- DB Schenker
- CEVA Logistics AG
- Penske Logistics do Brasil Ltda
- C.H. Robinson Worldwide Inc
- Nippon Express Co Ltd
- Kuehne + Nagel International AG
- FedEx
- BBM Logística SA
- DSV AS
- Deutsche Post AG (DHL Group)
- Gafor SA
Key Milestones in Third-Party Logistics Industry in Brazil Industry
- 2020: Increased adoption of digital technologies in response to the pandemic.
- 2021: Several significant M&A activities among mid-sized 3PL companies.
- 2022: Government initiatives focused on improving infrastructure in key regions.
- 2023: Launch of new specialized logistics solutions for the renewable energy sector.
- 2024: Increased investment in warehouse automation and robotics.
Strategic Outlook for Third-Party Logistics Industry in Brazil Market
The Brazilian 3PL market holds significant long-term growth potential, driven by sustained economic growth, rising e-commerce penetration, and continued infrastructure development. Companies that embrace technological advancements, focus on sustainable practices, and establish strategic partnerships will be best positioned to capitalize on the expanding opportunities within this dynamic market. The focus should be on efficiency improvements, specialized service offerings, and the ability to adapt to evolving consumer and regulatory landscapes.
Third-Party Logistics Industry in Brazil Segmentation
-
1. Services
- 1.1. Domestic Transportation Management
- 1.2. International Transportation Management
- 1.3. Value-added Warehousing and Distribution
-
2. End User
- 2.1. Automobile
- 2.2. Chemicals
- 2.3. Consumer and Retail
- 2.4. Energy
- 2.5. Engineering and Manufacturing
- 2.6. Life Science and Healthcare
- 2.7. Other End User
Third-Party Logistics Industry in Brazil Segmentation By Geography
-
1. North America
- 1.1. United States
- 1.2. Canada
- 1.3. Mexico
-
2. South America
- 2.1. Brazil
- 2.2. Argentina
- 2.3. Rest of South America
-
3. Europe
- 3.1. United Kingdom
- 3.2. Germany
- 3.3. France
- 3.4. Italy
- 3.5. Spain
- 3.6. Russia
- 3.7. Benelux
- 3.8. Nordics
- 3.9. Rest of Europe
-
4. Middle East & Africa
- 4.1. Turkey
- 4.2. Israel
- 4.3. GCC
- 4.4. North Africa
- 4.5. South Africa
- 4.6. Rest of Middle East & Africa
-
5. Asia Pacific
- 5.1. China
- 5.2. India
- 5.3. Japan
- 5.4. South Korea
- 5.5. ASEAN
- 5.6. Oceania
- 5.7. Rest of Asia Pacific
Third-Party Logistics Industry in Brazil Regional Market Share
Geographic Coverage of Third-Party Logistics Industry in Brazil
Third-Party Logistics Industry in Brazil REPORT HIGHLIGHTS
| Aspects | Details |
|---|---|
| Study Period | 2020-2034 |
| Base Year | 2025 |
| Estimated Year | 2026 |
| Forecast Period | 2026-2034 |
| Historical Period | 2020-2025 |
| Growth Rate | CAGR of 4.26% from 2020-2034 |
| Segmentation |
|
Table of Contents
- 1. Introduction
- 1.1. Research Scope
- 1.2. Market Segmentation
- 1.3. Research Objective
- 1.4. Definitions and Assumptions
- 2. Executive Summary
- 2.1. Market Snapshot
- 3. Market Dynamics
- 3.1. Market Drivers
- 3.2. Market Restrains
- 3.3. Market Trends
- 3.4. Market Opportunities
- 4. Market Factor Analysis
- 4.1. Porters Five Forces
- 4.1.1. Bargaining Power of Suppliers
- 4.1.2. Bargaining Power of Buyers
- 4.1.3. Threat of New Entrants
- 4.1.4. Threat of Substitutes
- 4.1.5. Competitive Rivalry
- 4.2. PESTEL analysis
- 4.3. BCG Analysis
- 4.3.1. Stars (High Growth, High Market Share)
- 4.3.2. Cash Cows (Low Growth, High Market Share)
- 4.3.3. Question Mark (High Growth, Low Market Share)
- 4.3.4. Dogs (Low Growth, Low Market Share)
- 4.4. Ansoff Matrix Analysis
- 4.5. Supply Chain Analysis
- 4.6. Regulatory Landscape
- 4.7. Current Market Potential and Opportunity Assessment (TAM–SAM–SOM Framework)
- 4.8. MSR Analyst Note
- 4.1. Porters Five Forces
- 5. Market Analysis, Insights and Forecast 2021-2033
- 5.1. Market Analysis, Insights and Forecast - by Services
- 5.1.1. Domestic Transportation Management
- 5.1.2. International Transportation Management
- 5.1.3. Value-added Warehousing and Distribution
- 5.2. Market Analysis, Insights and Forecast - by End User
- 5.2.1. Automobile
- 5.2.2. Chemicals
- 5.2.3. Consumer and Retail
- 5.2.4. Energy
- 5.2.5. Engineering and Manufacturing
- 5.2.6. Life Science and Healthcare
- 5.2.7. Other End User
- 5.3. Market Analysis, Insights and Forecast - by Region
- 5.3.1. North America
- 5.3.2. South America
- 5.3.3. Europe
- 5.3.4. Middle East & Africa
- 5.3.5. Asia Pacific
- 5.1. Market Analysis, Insights and Forecast - by Services
- 6. Global Third-Party Logistics Industry in Brazil Analysis, Insights and Forecast, 2021-2033
- 6.1. Market Analysis, Insights and Forecast - by Services
- 6.1.1. Domestic Transportation Management
- 6.1.2. International Transportation Management
- 6.1.3. Value-added Warehousing and Distribution
- 6.2. Market Analysis, Insights and Forecast - by End User
- 6.2.1. Automobile
- 6.2.2. Chemicals
- 6.2.3. Consumer and Retail
- 6.2.4. Energy
- 6.2.5. Engineering and Manufacturing
- 6.2.6. Life Science and Healthcare
- 6.2.7. Other End User
- 6.1. Market Analysis, Insights and Forecast - by Services
- 7. North America Third-Party Logistics Industry in Brazil Analysis, Insights and Forecast, 2020-2032
- 7.1. Market Analysis, Insights and Forecast - by Services
- 7.1.1. Domestic Transportation Management
- 7.1.2. International Transportation Management
- 7.1.3. Value-added Warehousing and Distribution
- 7.2. Market Analysis, Insights and Forecast - by End User
- 7.2.1. Automobile
- 7.2.2. Chemicals
- 7.2.3. Consumer and Retail
- 7.2.4. Energy
- 7.2.5. Engineering and Manufacturing
- 7.2.6. Life Science and Healthcare
- 7.2.7. Other End User
- 7.1. Market Analysis, Insights and Forecast - by Services
- 8. South America Third-Party Logistics Industry in Brazil Analysis, Insights and Forecast, 2020-2032
- 8.1. Market Analysis, Insights and Forecast - by Services
- 8.1.1. Domestic Transportation Management
- 8.1.2. International Transportation Management
- 8.1.3. Value-added Warehousing and Distribution
- 8.2. Market Analysis, Insights and Forecast - by End User
- 8.2.1. Automobile
- 8.2.2. Chemicals
- 8.2.3. Consumer and Retail
- 8.2.4. Energy
- 8.2.5. Engineering and Manufacturing
- 8.2.6. Life Science and Healthcare
- 8.2.7. Other End User
- 8.1. Market Analysis, Insights and Forecast - by Services
- 9. Europe Third-Party Logistics Industry in Brazil Analysis, Insights and Forecast, 2020-2032
- 9.1. Market Analysis, Insights and Forecast - by Services
- 9.1.1. Domestic Transportation Management
- 9.1.2. International Transportation Management
- 9.1.3. Value-added Warehousing and Distribution
- 9.2. Market Analysis, Insights and Forecast - by End User
- 9.2.1. Automobile
- 9.2.2. Chemicals
- 9.2.3. Consumer and Retail
- 9.2.4. Energy
- 9.2.5. Engineering and Manufacturing
- 9.2.6. Life Science and Healthcare
- 9.2.7. Other End User
- 9.1. Market Analysis, Insights and Forecast - by Services
- 10. Middle East & Africa Third-Party Logistics Industry in Brazil Analysis, Insights and Forecast, 2020-2032
- 10.1. Market Analysis, Insights and Forecast - by Services
- 10.1.1. Domestic Transportation Management
- 10.1.2. International Transportation Management
- 10.1.3. Value-added Warehousing and Distribution
- 10.2. Market Analysis, Insights and Forecast - by End User
- 10.2.1. Automobile
- 10.2.2. Chemicals
- 10.2.3. Consumer and Retail
- 10.2.4. Energy
- 10.2.5. Engineering and Manufacturing
- 10.2.6. Life Science and Healthcare
- 10.2.7. Other End User
- 10.1. Market Analysis, Insights and Forecast - by Services
- 11. Asia Pacific Third-Party Logistics Industry in Brazil Analysis, Insights and Forecast, 2020-2032
- 11.1. Market Analysis, Insights and Forecast - by Services
- 11.1.1. Domestic Transportation Management
- 11.1.2. International Transportation Management
- 11.1.3. Value-added Warehousing and Distribution
- 11.2. Market Analysis, Insights and Forecast - by End User
- 11.2.1. Automobile
- 11.2.2. Chemicals
- 11.2.3. Consumer and Retail
- 11.2.4. Energy
- 11.2.5. Engineering and Manufacturing
- 11.2.6. Life Science and Healthcare
- 11.2.7. Other End User
- 11.1. Market Analysis, Insights and Forecast - by Services
- 12. Competitive Analysis
- 12.1. Company Profiles
- 12.1.1 DB Schenker
- 12.1.1.1. Company Overview
- 12.1.1.2. Products
- 12.1.1.3. Company Financials
- 12.1.1.4. SWOT Analysis
- 12.1.2 CEVA Logistics AG
- 12.1.2.1. Company Overview
- 12.1.2.2. Products
- 12.1.2.3. Company Financials
- 12.1.2.4. SWOT Analysis
- 12.1.3 Penske Logistics do Brasil Ltda**List Not Exhaustive 6 3 Other Companie
- 12.1.3.1. Company Overview
- 12.1.3.2. Products
- 12.1.3.3. Company Financials
- 12.1.3.4. SWOT Analysis
- 12.1.4 C H Robinson Worldwide Inc
- 12.1.4.1. Company Overview
- 12.1.4.2. Products
- 12.1.4.3. Company Financials
- 12.1.4.4. SWOT Analysis
- 12.1.5 Nippon Express Co Ltd
- 12.1.5.1. Company Overview
- 12.1.5.2. Products
- 12.1.5.3. Company Financials
- 12.1.5.4. SWOT Analysis
- 12.1.6 Kuehne + Nagel International AG
- 12.1.6.1. Company Overview
- 12.1.6.2. Products
- 12.1.6.3. Company Financials
- 12.1.6.4. SWOT Analysis
- 12.1.7 FedEx
- 12.1.7.1. Company Overview
- 12.1.7.2. Products
- 12.1.7.3. Company Financials
- 12.1.7.4. SWOT Analysis
- 12.1.8 BBM Logística SA
- 12.1.8.1. Company Overview
- 12.1.8.2. Products
- 12.1.8.3. Company Financials
- 12.1.8.4. SWOT Analysis
- 12.1.9 DSV AS
- 12.1.9.1. Company Overview
- 12.1.9.2. Products
- 12.1.9.3. Company Financials
- 12.1.9.4. SWOT Analysis
- 12.1.10 Deutsche Post AG
- 12.1.10.1. Company Overview
- 12.1.10.2. Products
- 12.1.10.3. Company Financials
- 12.1.10.4. SWOT Analysis
- 12.1.11 Gafor SA
- 12.1.11.1. Company Overview
- 12.1.11.2. Products
- 12.1.11.3. Company Financials
- 12.1.11.4. SWOT Analysis
- 12.1.1 DB Schenker
- 12.2. Market Entropy
- 12.2.1 Company's Key Areas Served
- 12.2.2 Recent Developments
- 12.3. Company Market Share Analysis 2025
- 12.3.1 Top 5 Companies Market Share Analysis
- 12.3.2 Top 3 Companies Market Share Analysis
- 12.4. List of Potential Customers
- 13. Research Methodology
List of Figures
- Figure 1: Global Third-Party Logistics Industry in Brazil Revenue Breakdown (Million, %) by Region 2025 & 2033
- Figure 2: North America Third-Party Logistics Industry in Brazil Revenue (Million), by Services 2025 & 2033
- Figure 3: North America Third-Party Logistics Industry in Brazil Revenue Share (%), by Services 2025 & 2033
- Figure 4: North America Third-Party Logistics Industry in Brazil Revenue (Million), by End User 2025 & 2033
- Figure 5: North America Third-Party Logistics Industry in Brazil Revenue Share (%), by End User 2025 & 2033
- Figure 6: North America Third-Party Logistics Industry in Brazil Revenue (Million), by Country 2025 & 2033
- Figure 7: North America Third-Party Logistics Industry in Brazil Revenue Share (%), by Country 2025 & 2033
- Figure 8: South America Third-Party Logistics Industry in Brazil Revenue (Million), by Services 2025 & 2033
- Figure 9: South America Third-Party Logistics Industry in Brazil Revenue Share (%), by Services 2025 & 2033
- Figure 10: South America Third-Party Logistics Industry in Brazil Revenue (Million), by End User 2025 & 2033
- Figure 11: South America Third-Party Logistics Industry in Brazil Revenue Share (%), by End User 2025 & 2033
- Figure 12: South America Third-Party Logistics Industry in Brazil Revenue (Million), by Country 2025 & 2033
- Figure 13: South America Third-Party Logistics Industry in Brazil Revenue Share (%), by Country 2025 & 2033
- Figure 14: Europe Third-Party Logistics Industry in Brazil Revenue (Million), by Services 2025 & 2033
- Figure 15: Europe Third-Party Logistics Industry in Brazil Revenue Share (%), by Services 2025 & 2033
- Figure 16: Europe Third-Party Logistics Industry in Brazil Revenue (Million), by End User 2025 & 2033
- Figure 17: Europe Third-Party Logistics Industry in Brazil Revenue Share (%), by End User 2025 & 2033
- Figure 18: Europe Third-Party Logistics Industry in Brazil Revenue (Million), by Country 2025 & 2033
- Figure 19: Europe Third-Party Logistics Industry in Brazil Revenue Share (%), by Country 2025 & 2033
- Figure 20: Middle East & Africa Third-Party Logistics Industry in Brazil Revenue (Million), by Services 2025 & 2033
- Figure 21: Middle East & Africa Third-Party Logistics Industry in Brazil Revenue Share (%), by Services 2025 & 2033
- Figure 22: Middle East & Africa Third-Party Logistics Industry in Brazil Revenue (Million), by End User 2025 & 2033
- Figure 23: Middle East & Africa Third-Party Logistics Industry in Brazil Revenue Share (%), by End User 2025 & 2033
- Figure 24: Middle East & Africa Third-Party Logistics Industry in Brazil Revenue (Million), by Country 2025 & 2033
- Figure 25: Middle East & Africa Third-Party Logistics Industry in Brazil Revenue Share (%), by Country 2025 & 2033
- Figure 26: Asia Pacific Third-Party Logistics Industry in Brazil Revenue (Million), by Services 2025 & 2033
- Figure 27: Asia Pacific Third-Party Logistics Industry in Brazil Revenue Share (%), by Services 2025 & 2033
- Figure 28: Asia Pacific Third-Party Logistics Industry in Brazil Revenue (Million), by End User 2025 & 2033
- Figure 29: Asia Pacific Third-Party Logistics Industry in Brazil Revenue Share (%), by End User 2025 & 2033
- Figure 30: Asia Pacific Third-Party Logistics Industry in Brazil Revenue (Million), by Country 2025 & 2033
- Figure 31: Asia Pacific Third-Party Logistics Industry in Brazil Revenue Share (%), by Country 2025 & 2033
List of Tables
- Table 1: Global Third-Party Logistics Industry in Brazil Revenue Million Forecast, by Services 2020 & 2033
- Table 2: Global Third-Party Logistics Industry in Brazil Revenue Million Forecast, by End User 2020 & 2033
- Table 3: Global Third-Party Logistics Industry in Brazil Revenue Million Forecast, by Region 2020 & 2033
- Table 4: Global Third-Party Logistics Industry in Brazil Revenue Million Forecast, by Services 2020 & 2033
- Table 5: Global Third-Party Logistics Industry in Brazil Revenue Million Forecast, by End User 2020 & 2033
- Table 6: Global Third-Party Logistics Industry in Brazil Revenue Million Forecast, by Country 2020 & 2033
- Table 7: United States Third-Party Logistics Industry in Brazil Revenue (Million) Forecast, by Application 2020 & 2033
- Table 8: Canada Third-Party Logistics Industry in Brazil Revenue (Million) Forecast, by Application 2020 & 2033
- Table 9: Mexico Third-Party Logistics Industry in Brazil Revenue (Million) Forecast, by Application 2020 & 2033
- Table 10: Global Third-Party Logistics Industry in Brazil Revenue Million Forecast, by Services 2020 & 2033
- Table 11: Global Third-Party Logistics Industry in Brazil Revenue Million Forecast, by End User 2020 & 2033
- Table 12: Global Third-Party Logistics Industry in Brazil Revenue Million Forecast, by Country 2020 & 2033
- Table 13: Brazil Third-Party Logistics Industry in Brazil Revenue (Million) Forecast, by Application 2020 & 2033
- Table 14: Argentina Third-Party Logistics Industry in Brazil Revenue (Million) Forecast, by Application 2020 & 2033
- Table 15: Rest of South America Third-Party Logistics Industry in Brazil Revenue (Million) Forecast, by Application 2020 & 2033
- Table 16: Global Third-Party Logistics Industry in Brazil Revenue Million Forecast, by Services 2020 & 2033
- Table 17: Global Third-Party Logistics Industry in Brazil Revenue Million Forecast, by End User 2020 & 2033
- Table 18: Global Third-Party Logistics Industry in Brazil Revenue Million Forecast, by Country 2020 & 2033
- Table 19: United Kingdom Third-Party Logistics Industry in Brazil Revenue (Million) Forecast, by Application 2020 & 2033
- Table 20: Germany Third-Party Logistics Industry in Brazil Revenue (Million) Forecast, by Application 2020 & 2033
- Table 21: France Third-Party Logistics Industry in Brazil Revenue (Million) Forecast, by Application 2020 & 2033
- Table 22: Italy Third-Party Logistics Industry in Brazil Revenue (Million) Forecast, by Application 2020 & 2033
- Table 23: Spain Third-Party Logistics Industry in Brazil Revenue (Million) Forecast, by Application 2020 & 2033
- Table 24: Russia Third-Party Logistics Industry in Brazil Revenue (Million) Forecast, by Application 2020 & 2033
- Table 25: Benelux Third-Party Logistics Industry in Brazil Revenue (Million) Forecast, by Application 2020 & 2033
- Table 26: Nordics Third-Party Logistics Industry in Brazil Revenue (Million) Forecast, by Application 2020 & 2033
- Table 27: Rest of Europe Third-Party Logistics Industry in Brazil Revenue (Million) Forecast, by Application 2020 & 2033
- Table 28: Global Third-Party Logistics Industry in Brazil Revenue Million Forecast, by Services 2020 & 2033
- Table 29: Global Third-Party Logistics Industry in Brazil Revenue Million Forecast, by End User 2020 & 2033
- Table 30: Global Third-Party Logistics Industry in Brazil Revenue Million Forecast, by Country 2020 & 2033
- Table 31: Turkey Third-Party Logistics Industry in Brazil Revenue (Million) Forecast, by Application 2020 & 2033
- Table 32: Israel Third-Party Logistics Industry in Brazil Revenue (Million) Forecast, by Application 2020 & 2033
- Table 33: GCC Third-Party Logistics Industry in Brazil Revenue (Million) Forecast, by Application 2020 & 2033
- Table 34: North Africa Third-Party Logistics Industry in Brazil Revenue (Million) Forecast, by Application 2020 & 2033
- Table 35: South Africa Third-Party Logistics Industry in Brazil Revenue (Million) Forecast, by Application 2020 & 2033
- Table 36: Rest of Middle East & Africa Third-Party Logistics Industry in Brazil Revenue (Million) Forecast, by Application 2020 & 2033
- Table 37: Global Third-Party Logistics Industry in Brazil Revenue Million Forecast, by Services 2020 & 2033
- Table 38: Global Third-Party Logistics Industry in Brazil Revenue Million Forecast, by End User 2020 & 2033
- Table 39: Global Third-Party Logistics Industry in Brazil Revenue Million Forecast, by Country 2020 & 2033
- Table 40: China Third-Party Logistics Industry in Brazil Revenue (Million) Forecast, by Application 2020 & 2033
- Table 41: India Third-Party Logistics Industry in Brazil Revenue (Million) Forecast, by Application 2020 & 2033
- Table 42: Japan Third-Party Logistics Industry in Brazil Revenue (Million) Forecast, by Application 2020 & 2033
- Table 43: South Korea Third-Party Logistics Industry in Brazil Revenue (Million) Forecast, by Application 2020 & 2033
- Table 44: ASEAN Third-Party Logistics Industry in Brazil Revenue (Million) Forecast, by Application 2020 & 2033
- Table 45: Oceania Third-Party Logistics Industry in Brazil Revenue (Million) Forecast, by Application 2020 & 2033
- Table 46: Rest of Asia Pacific Third-Party Logistics Industry in Brazil Revenue (Million) Forecast, by Application 2020 & 2033
Frequently Asked Questions
1. What is the projected Compound Annual Growth Rate (CAGR) of the Third-Party Logistics Industry in Brazil?
The projected CAGR is approximately 4.26%.
2. Which companies are prominent players in the Third-Party Logistics Industry in Brazil?
Key companies in the market include DB Schenker, CEVA Logistics AG, Penske Logistics do Brasil Ltda**List Not Exhaustive 6 3 Other Companie, C H Robinson Worldwide Inc, Nippon Express Co Ltd, Kuehne + Nagel International AG, FedEx, BBM Logística SA, DSV AS, Deutsche Post AG, Gafor SA.
3. What are the main segments of the Third-Party Logistics Industry in Brazil?
The market segments include Services, End User.
4. Can you provide details about the market size?
The market size is estimated to be USD 33.20 Million as of 2022.
5. What are some drivers contributing to market growth?
E-commerce Fueling the Growth of 3PL Market.
6. What are the notable trends driving market growth?
Increasing Freight Trucking is Driving Market Growth.
7. Are there any restraints impacting market growth?
Slow Infrastructure Development.
8. Can you provide examples of recent developments in the market?
N/A
9. What pricing options are available for accessing the report?
Pricing options include single-user, multi-user, and enterprise licenses priced at USD 3800, USD 4500, and USD 5800 respectively.
10. Is the market size provided in terms of value or volume?
The market size is provided in terms of value, measured in Million.
11. Are there any specific market keywords associated with the report?
Yes, the market keyword associated with the report is "Third-Party Logistics Industry in Brazil," which aids in identifying and referencing the specific market segment covered.
12. How do I determine which pricing option suits my needs best?
The pricing options vary based on user requirements and access needs. Individual users may opt for single-user licenses, while businesses requiring broader access may choose multi-user or enterprise licenses for cost-effective access to the report.
13. Are there any additional resources or data provided in the Third-Party Logistics Industry in Brazil report?
While the report offers comprehensive insights, it's advisable to review the specific contents or supplementary materials provided to ascertain if additional resources or data are available.
14. How can I stay updated on further developments or reports in the Third-Party Logistics Industry in Brazil?
To stay informed about further developments, trends, and reports in the Third-Party Logistics Industry in Brazil, consider subscribing to industry newsletters, following relevant companies and organizations, or regularly checking reputable industry news sources and publications.
Methodology
Step 1 - Identification of Relevant Samples Size from Population Database


Step 2 - Approaches for Defining Global Market Size (Value, Volume* & Price*)

Note*: In applicable scenarios
Step 3 - Data Sources
Primary Research
- Web Analytics
- Survey Reports
- Research Institute
- Latest Research Reports
- Opinion Leaders
Secondary Research
- Annual Reports
- White Paper
- Latest Press Release
- Industry Association
- Paid Database
- Investor Presentations

Step 4 - Data Triangulation
Involves using different sources of information in order to increase the validity of a study
These sources are likely to be stakeholders in a program - participants, other researchers, program staff, other community members, and so on.
Then we put all data in single framework & apply various statistical tools to find out the dynamic on the market.
During the analysis stage, feedback from the stakeholder groups would be compared to determine areas of agreement as well as areas of divergence