

Key Insights
The global urea market, projected for robust growth, is driven by escalating food demand and intensified agricultural practices worldwide. Key expansion areas include specialty urea products such as Controlled Release Fertilizers (CRF) and water-soluble formulations, supporting efficient nutrient delivery and precision farming. The horticultural and turf & ornamental sectors are also experiencing significant upticks, fueled by rising disposable incomes and urbanization. While raw material price volatility and environmental concerns pose challenges, technological advancements in production and application methods are actively addressing these issues. Leading companies are innovating to develop more efficient and sustainable urea solutions. Market expansion will be shaped by regional agricultural trends, governmental policies, and economic growth, with agricultural hubs anticipated to lead the growth trajectory. The market size was 178.8 million in the base year 2025, with a projected CAGR of 0.9.
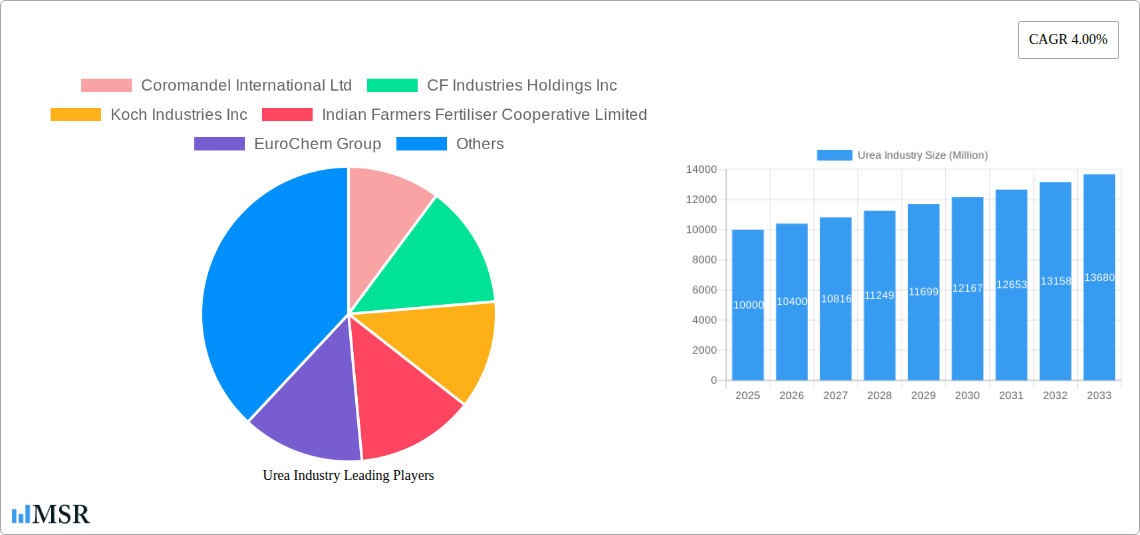
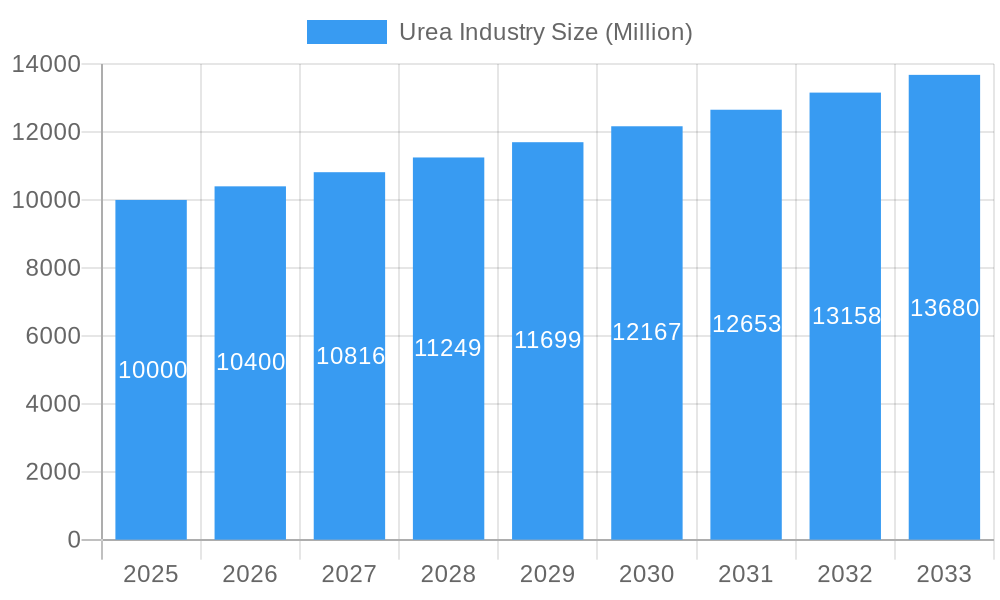
Urea Industry Market Size (In Million)
The competitive environment features a blend of global and regional participants. Major corporations leverage economies of scale and broad distribution, while regional entities focus on niche markets or local connections. Strategic alliances and M&A activities are expected to redefine market shares. Future expansion depends on agricultural support, R&D in sustainable production, and precision agriculture adoption. Adherence to environmental regulations and the development of eco-friendly alternatives will be critical. The overarching shift towards sustainable agriculture underscores the demand for effective and environmentally conscious urea fertilizers.
Urea Industry Company Market Share
Unlock Growth Opportunities in the Thriving Urea Industry: A Comprehensive Market Report (2019-2033)
This comprehensive report provides an in-depth analysis of the global urea industry, offering invaluable insights for stakeholders seeking to navigate this dynamic market. Covering the period from 2019 to 2033, with a focus on 2025, this report delivers actionable intelligence on market size, segmentation, key players, and future trends. The study period is 2019–2033, with 2025 as the base and estimated year. The forecast period spans 2025–2033, and the historical period covers 2019–2024.
Urea Industry Market Concentration & Dynamics
This section assesses the competitive landscape, innovation, regulations, and market forces shaping the urea industry. The global urea market is characterized by a moderately concentrated structure, with key players like Coromandel International Ltd, CF Industries Holdings Inc, Koch Industries Inc, Indian Farmers Fertiliser Cooperative Limited, EuroChem Group, SABIC Agri-Nutrients Co, Yara International AS, OCI NV, and Nutrien Ltd holding significant market share. The combined market share of the top five players is estimated at xx%.
- Market Concentration: The industry exhibits a moderately concentrated structure, with the top 5 players commanding approximately xx% of the global market share in 2024.
- Innovation Ecosystem: Significant investments are being made in developing sustainable and efficient urea production technologies, including the use of renewable energy and precision farming techniques.
- Regulatory Frameworks: Government regulations related to environmental protection and fertilizer usage significantly influence market dynamics. Stringent emission standards drive the adoption of cleaner production methods.
- Substitute Products: The emergence of bio-fertilizers and other sustainable alternatives poses a potential challenge to urea’s market dominance. However, urea’s cost-effectiveness and widespread acceptance continues to maintain its market share.
- End-User Trends: Growing demand from the agricultural sector, particularly in developing economies, continues to be the primary driver of market growth. The shift towards high-yield farming practices also contributes to increased urea consumption.
- M&A Activities: The urea industry has witnessed a rise in mergers and acquisitions (M&A) activities in recent years. The number of deals increased to xx in 2024 from xx in 2019. These deals are driven by the need to expand market reach, enhance production capabilities, and secure access to raw materials. Examples include SABIC Agri-Nutrients Co's acquisition of a 49% stake in ETG Inputs Holdco Limited in April 2023.
Urea Industry Insights & Trends
The global urea market is experiencing robust growth, driven by factors such as rising food demand, increasing agricultural activities, and government initiatives to enhance crop yields. The market size reached approximately USD xx Million in 2024, and is projected to reach USD xx Million by 2033, exhibiting a CAGR of xx% during the forecast period. This growth is fueled by several key factors:
- Rising Global Food Demand: The global population increase necessitates higher food production, significantly boosting the demand for fertilizers like urea.
- Intensification of Agricultural Practices: The shift towards high-yield and precision farming methods increases the demand for efficient fertilizers such as urea.
- Government Support and Subsidies: Government policies and subsidies aimed at enhancing agricultural productivity stimulate the consumption of urea.
- Technological Advancements: Continuous improvements in urea production and application technologies drive efficiency gains and market expansion. The shift towards precision application minimizes waste and maximizes the yield of this key nutrient.
- Evolving Consumer Behavior: Growing awareness regarding sustainable agriculture is driving the need for efficient and environmentally-conscious fertilizer practices, which could impact the future adoption rates of Urea.
Key Markets & Segments Leading Urea Industry
The urea market is segmented by specialty type (CRF, liquid fertilizer, SRF, water-soluble), crop type (field crops, horticultural crops, turf & ornamental), and form (conventional, specialty). The field crops segment dominates the market, driven by its extensive acreage and high urea consumption. Geographically, Asia-Pacific holds a substantial market share, fueled by intense agricultural activities and a growing population.
- Dominant Region/Country: Asia-Pacific region is the dominant market due to significant agricultural production and substantial population growth. India and China are key contributors within this region.
- Dominant Segment:
- Specialty Type: Conventional urea holds the largest market share due to its cost-effectiveness and widespread availability, followed by CRF (Controlled Release Fertilizer).
- Crop Type: Field crops represent the largest consumer segment due to their extensive cultivation and reliance on urea for optimal yield.
- Form: Conventional urea accounts for the largest market share due to its established market presence and cost competitiveness.
- Drivers:
- Economic Growth: Expanding economies, particularly in developing nations, contribute to higher agricultural investment and urea consumption.
- Infrastructure Development: Improved irrigation systems and better transportation networks support enhanced fertilizer distribution and utilization.
- Government Policies: Supportive government policies and subsidies boost urea consumption by making it more accessible to farmers.
Urea Industry Product Developments
Recent innovations focus on enhancing urea efficiency and sustainability. Controlled-release formulations, water-soluble urea, and bio-enhanced urea are gaining traction. These advancements improve nutrient use efficiency, reduce environmental impact, and provide farmers with greater control over nutrient application. Competitiveness is driven by superior quality, cost-effectiveness, and tailored products to specific crop needs.
Challenges in the Urea Industry Market
The urea industry faces challenges such as fluctuating raw material prices, stringent environmental regulations, and intense competition. Supply chain disruptions due to geopolitical uncertainties also pose risks. These factors can lead to price volatility and reduced profitability. The estimated impact of these challenges on global urea production in 2024 is a reduction of approximately xx Million tons.
Forces Driving Urea Industry Growth
Several factors drive urea industry growth, including rising global food demand, increasing agricultural intensity, government support for agriculture, and technological advancements in urea production and application. Furthermore, increasing demand from emerging economies fuels the market's expansion.
Challenges in the Urea Industry Market
Long-term growth hinges on addressing sustainability concerns, including reducing greenhouse gas emissions from production and optimizing nitrogen use efficiency. Strategic partnerships to enhance research and development, along with expansion into new markets and product diversification, will support sustained growth.
Emerging Opportunities in Urea Industry
Emerging opportunities include developing sustainable urea production methods (e.g., using renewable energy), creating value-added products (e.g., coated urea), and expanding into niche markets (e.g., specialty crops). Precision agriculture technologies also present opportunities to optimize fertilizer application and reduce environmental impact.
Leading Players in the Urea Industry Sector
- Coromandel International Ltd
- CF Industries Holdings Inc
- Koch Industries Inc
- Indian Farmers Fertiliser Cooperative Limited
- EuroChem Group
- SABIC Agri-Nutrients Co
- Yara International AS
- OCI NV
- Nutrien Ltd
Key Milestones in Urea Industry Industry
- April 2023: SABIC Agri-Nutrients Company acquired a 49% stake in ETG Inputs Holdco Limited for USD 320 Million, signifying a move towards value chain integration in the agri-nutrients market.
- March 2022: EuroChem Group's acquisition of 51.48% of Fertilizantes Heringer SA strengthened its Brazilian distribution network.
- January 2022: Yara and Lantmännen's partnership focused on bringing "green" fertilizers to market, highlighting the shift towards sustainable agricultural practices.
Strategic Outlook for Urea Industry Market
The urea industry is poised for continued growth, driven by factors such as rising global food demand and advancements in sustainable agricultural practices. Strategic investments in research and development, coupled with expansion into new markets and the adoption of innovative technologies, will be crucial for sustained success in this dynamic market. The future holds significant potential for players who effectively address environmental concerns and meet the evolving needs of a growing global population.
Urea Industry Segmentation
- 1. Production Analysis
- 2. Consumption Analysis
- 3. Import Market Analysis (Value & Volume)
- 4. Export Market Analysis (Value & Volume)
- 5. Price Trend Analysis
Urea Industry Segmentation By Geography
-
1. North America
- 1.1. United States
- 1.2. Canada
- 1.3. Mexico
-
2. South America
- 2.1. Brazil
- 2.2. Argentina
- 2.3. Rest of South America
-
3. Europe
- 3.1. United Kingdom
- 3.2. Germany
- 3.3. France
- 3.4. Italy
- 3.5. Spain
- 3.6. Russia
- 3.7. Benelux
- 3.8. Nordics
- 3.9. Rest of Europe
-
4. Middle East & Africa
- 4.1. Turkey
- 4.2. Israel
- 4.3. GCC
- 4.4. North Africa
- 4.5. South Africa
- 4.6. Rest of Middle East & Africa
-
5. Asia Pacific
- 5.1. China
- 5.2. India
- 5.3. Japan
- 5.4. South Korea
- 5.5. ASEAN
- 5.6. Oceania
- 5.7. Rest of Asia Pacific
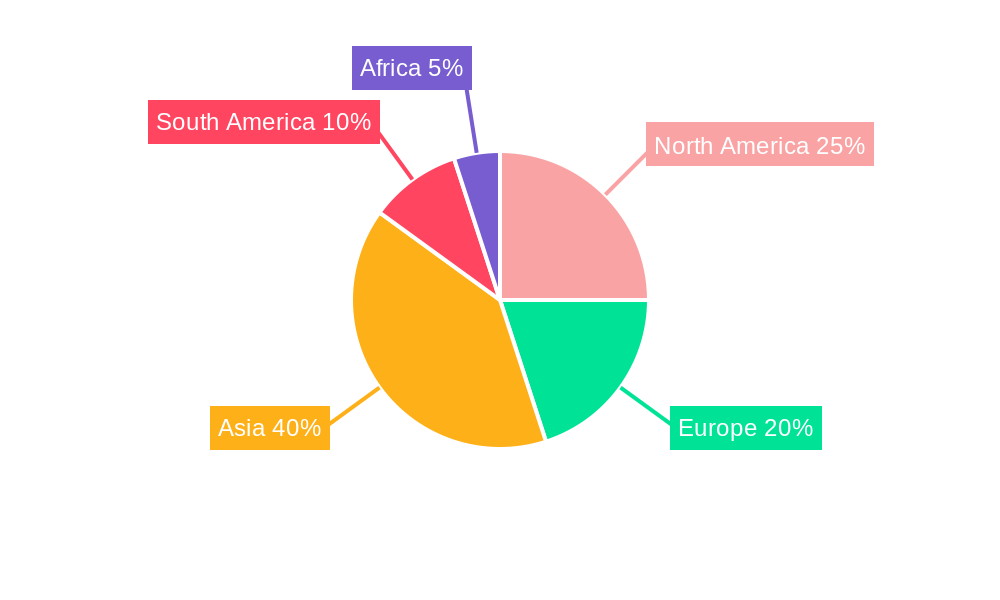
Urea Industry Regional Market Share
Geographic Coverage of Urea Industry
Urea Industry REPORT HIGHLIGHTS
| Aspects | Details |
|---|---|
| Study Period | 2020-2034 |
| Base Year | 2025 |
| Estimated Year | 2026 |
| Forecast Period | 2026-2034 |
| Historical Period | 2020-2025 |
| Growth Rate | CAGR of 0.9% from 2020-2034 |
| Segmentation |
|
Table of Contents
- 1. Introduction
- 1.1. Research Scope
- 1.2. Market Segmentation
- 1.3. Research Objective
- 1.4. Definitions and Assumptions
- 2. Executive Summary
- 2.1. Market Snapshot
- 3. Market Dynamics
- 3.1. Market Drivers
- 3.2. Market Restrains
- 3.3. Market Trends
- 3.4. Market Opportunities
- 4. Market Factor Analysis
- 4.1. Porters Five Forces
- 4.1.1. Bargaining Power of Suppliers
- 4.1.2. Bargaining Power of Buyers
- 4.1.3. Threat of New Entrants
- 4.1.4. Threat of Substitutes
- 4.1.5. Competitive Rivalry
- 4.2. PESTEL analysis
- 4.3. BCG Analysis
- 4.3.1. Stars (High Growth, High Market Share)
- 4.3.2. Cash Cows (Low Growth, High Market Share)
- 4.3.3. Question Mark (High Growth, Low Market Share)
- 4.3.4. Dogs (Low Growth, Low Market Share)
- 4.4. Ansoff Matrix Analysis
- 4.5. Supply Chain Analysis
- 4.6. Regulatory Landscape
- 4.7. Current Market Potential and Opportunity Assessment (TAM–SAM–SOM Framework)
- 4.8. MSR Analyst Note
- 4.1. Porters Five Forces
- 5. Market Analysis, Insights and Forecast 2021-2033
- 5.1. Market Analysis, Insights and Forecast - by Production Analysis
- 5.2. Market Analysis, Insights and Forecast - by Consumption Analysis
- 5.3. Market Analysis, Insights and Forecast - by Import Market Analysis (Value & Volume)
- 5.4. Market Analysis, Insights and Forecast - by Export Market Analysis (Value & Volume)
- 5.5. Market Analysis, Insights and Forecast - by Price Trend Analysis
- 5.6. Market Analysis, Insights and Forecast - by Region
- 5.6.1. North America
- 5.6.2. South America
- 5.6.3. Europe
- 5.6.4. Middle East & Africa
- 5.6.5. Asia Pacific
- 6. Global Urea Industry Analysis, Insights and Forecast, 2021-2033
- 6.1. Market Analysis, Insights and Forecast - by Production Analysis
- 6.2. Market Analysis, Insights and Forecast - by Consumption Analysis
- 6.3. Market Analysis, Insights and Forecast - by Import Market Analysis (Value & Volume)
- 6.4. Market Analysis, Insights and Forecast - by Export Market Analysis (Value & Volume)
- 6.5. Market Analysis, Insights and Forecast - by Price Trend Analysis
- 7. North America Urea Industry Analysis, Insights and Forecast, 2020-2032
- 7.1. Market Analysis, Insights and Forecast - by Production Analysis
- 7.2. Market Analysis, Insights and Forecast - by Consumption Analysis
- 7.3. Market Analysis, Insights and Forecast - by Import Market Analysis (Value & Volume)
- 7.4. Market Analysis, Insights and Forecast - by Export Market Analysis (Value & Volume)
- 7.5. Market Analysis, Insights and Forecast - by Price Trend Analysis
- 8. South America Urea Industry Analysis, Insights and Forecast, 2020-2032
- 8.1. Market Analysis, Insights and Forecast - by Production Analysis
- 8.2. Market Analysis, Insights and Forecast - by Consumption Analysis
- 8.3. Market Analysis, Insights and Forecast - by Import Market Analysis (Value & Volume)
- 8.4. Market Analysis, Insights and Forecast - by Export Market Analysis (Value & Volume)
- 8.5. Market Analysis, Insights and Forecast - by Price Trend Analysis
- 9. Europe Urea Industry Analysis, Insights and Forecast, 2020-2032
- 9.1. Market Analysis, Insights and Forecast - by Production Analysis
- 9.2. Market Analysis, Insights and Forecast - by Consumption Analysis
- 9.3. Market Analysis, Insights and Forecast - by Import Market Analysis (Value & Volume)
- 9.4. Market Analysis, Insights and Forecast - by Export Market Analysis (Value & Volume)
- 9.5. Market Analysis, Insights and Forecast - by Price Trend Analysis
- 10. Middle East & Africa Urea Industry Analysis, Insights and Forecast, 2020-2032
- 10.1. Market Analysis, Insights and Forecast - by Production Analysis
- 10.2. Market Analysis, Insights and Forecast - by Consumption Analysis
- 10.3. Market Analysis, Insights and Forecast - by Import Market Analysis (Value & Volume)
- 10.4. Market Analysis, Insights and Forecast - by Export Market Analysis (Value & Volume)
- 10.5. Market Analysis, Insights and Forecast - by Price Trend Analysis
- 11. Asia Pacific Urea Industry Analysis, Insights and Forecast, 2020-2032
- 11.1. Market Analysis, Insights and Forecast - by Production Analysis
- 11.2. Market Analysis, Insights and Forecast - by Consumption Analysis
- 11.3. Market Analysis, Insights and Forecast - by Import Market Analysis (Value & Volume)
- 11.4. Market Analysis, Insights and Forecast - by Export Market Analysis (Value & Volume)
- 11.5. Market Analysis, Insights and Forecast - by Price Trend Analysis
- 12. Competitive Analysis
- 12.1. Company Profiles
- 12.1.1 Coromandel International Ltd
- 12.1.1.1. Company Overview
- 12.1.1.2. Products
- 12.1.1.3. Company Financials
- 12.1.1.4. SWOT Analysis
- 12.1.2 CF Industries Holdings Inc
- 12.1.2.1. Company Overview
- 12.1.2.2. Products
- 12.1.2.3. Company Financials
- 12.1.2.4. SWOT Analysis
- 12.1.3 Koch Industries Inc
- 12.1.3.1. Company Overview
- 12.1.3.2. Products
- 12.1.3.3. Company Financials
- 12.1.3.4. SWOT Analysis
- 12.1.4 Indian Farmers Fertiliser Cooperative Limited
- 12.1.4.1. Company Overview
- 12.1.4.2. Products
- 12.1.4.3. Company Financials
- 12.1.4.4. SWOT Analysis
- 12.1.5 EuroChem Group
- 12.1.5.1. Company Overview
- 12.1.5.2. Products
- 12.1.5.3. Company Financials
- 12.1.5.4. SWOT Analysis
- 12.1.6 SABIC Agri-Nutrients Co
- 12.1.6.1. Company Overview
- 12.1.6.2. Products
- 12.1.6.3. Company Financials
- 12.1.6.4. SWOT Analysis
- 12.1.7 Yara International AS
- 12.1.7.1. Company Overview
- 12.1.7.2. Products
- 12.1.7.3. Company Financials
- 12.1.7.4. SWOT Analysis
- 12.1.8 OCI NV
- 12.1.8.1. Company Overview
- 12.1.8.2. Products
- 12.1.8.3. Company Financials
- 12.1.8.4. SWOT Analysis
- 12.1.9 Nutrien Ltd
- 12.1.9.1. Company Overview
- 12.1.9.2. Products
- 12.1.9.3. Company Financials
- 12.1.9.4. SWOT Analysis
- 12.1.1 Coromandel International Ltd
- 12.2. Market Entropy
- 12.2.1 Company's Key Areas Served
- 12.2.2 Recent Developments
- 12.3. Company Market Share Analysis 2025
- 12.3.1 Top 5 Companies Market Share Analysis
- 12.3.2 Top 3 Companies Market Share Analysis
- 12.4. List of Potential Customers
- 13. Research Methodology
List of Figures
- Figure 1: Global Urea Industry Revenue Breakdown (million, %) by Region 2025 & 2033
- Figure 2: North America Urea Industry Revenue (million), by Production Analysis 2025 & 2033
- Figure 3: North America Urea Industry Revenue Share (%), by Production Analysis 2025 & 2033
- Figure 4: North America Urea Industry Revenue (million), by Consumption Analysis 2025 & 2033
- Figure 5: North America Urea Industry Revenue Share (%), by Consumption Analysis 2025 & 2033
- Figure 6: North America Urea Industry Revenue (million), by Import Market Analysis (Value & Volume) 2025 & 2033
- Figure 7: North America Urea Industry Revenue Share (%), by Import Market Analysis (Value & Volume) 2025 & 2033
- Figure 8: North America Urea Industry Revenue (million), by Export Market Analysis (Value & Volume) 2025 & 2033
- Figure 9: North America Urea Industry Revenue Share (%), by Export Market Analysis (Value & Volume) 2025 & 2033
- Figure 10: North America Urea Industry Revenue (million), by Price Trend Analysis 2025 & 2033
- Figure 11: North America Urea Industry Revenue Share (%), by Price Trend Analysis 2025 & 2033
- Figure 12: North America Urea Industry Revenue (million), by Country 2025 & 2033
- Figure 13: North America Urea Industry Revenue Share (%), by Country 2025 & 2033
- Figure 14: South America Urea Industry Revenue (million), by Production Analysis 2025 & 2033
- Figure 15: South America Urea Industry Revenue Share (%), by Production Analysis 2025 & 2033
- Figure 16: South America Urea Industry Revenue (million), by Consumption Analysis 2025 & 2033
- Figure 17: South America Urea Industry Revenue Share (%), by Consumption Analysis 2025 & 2033
- Figure 18: South America Urea Industry Revenue (million), by Import Market Analysis (Value & Volume) 2025 & 2033
- Figure 19: South America Urea Industry Revenue Share (%), by Import Market Analysis (Value & Volume) 2025 & 2033
- Figure 20: South America Urea Industry Revenue (million), by Export Market Analysis (Value & Volume) 2025 & 2033
- Figure 21: South America Urea Industry Revenue Share (%), by Export Market Analysis (Value & Volume) 2025 & 2033
- Figure 22: South America Urea Industry Revenue (million), by Price Trend Analysis 2025 & 2033
- Figure 23: South America Urea Industry Revenue Share (%), by Price Trend Analysis 2025 & 2033
- Figure 24: South America Urea Industry Revenue (million), by Country 2025 & 2033
- Figure 25: South America Urea Industry Revenue Share (%), by Country 2025 & 2033
- Figure 26: Europe Urea Industry Revenue (million), by Production Analysis 2025 & 2033
- Figure 27: Europe Urea Industry Revenue Share (%), by Production Analysis 2025 & 2033
- Figure 28: Europe Urea Industry Revenue (million), by Consumption Analysis 2025 & 2033
- Figure 29: Europe Urea Industry Revenue Share (%), by Consumption Analysis 2025 & 2033
- Figure 30: Europe Urea Industry Revenue (million), by Import Market Analysis (Value & Volume) 2025 & 2033
- Figure 31: Europe Urea Industry Revenue Share (%), by Import Market Analysis (Value & Volume) 2025 & 2033
- Figure 32: Europe Urea Industry Revenue (million), by Export Market Analysis (Value & Volume) 2025 & 2033
- Figure 33: Europe Urea Industry Revenue Share (%), by Export Market Analysis (Value & Volume) 2025 & 2033
- Figure 34: Europe Urea Industry Revenue (million), by Price Trend Analysis 2025 & 2033
- Figure 35: Europe Urea Industry Revenue Share (%), by Price Trend Analysis 2025 & 2033
- Figure 36: Europe Urea Industry Revenue (million), by Country 2025 & 2033
- Figure 37: Europe Urea Industry Revenue Share (%), by Country 2025 & 2033
- Figure 38: Middle East & Africa Urea Industry Revenue (million), by Production Analysis 2025 & 2033
- Figure 39: Middle East & Africa Urea Industry Revenue Share (%), by Production Analysis 2025 & 2033
- Figure 40: Middle East & Africa Urea Industry Revenue (million), by Consumption Analysis 2025 & 2033
- Figure 41: Middle East & Africa Urea Industry Revenue Share (%), by Consumption Analysis 2025 & 2033
- Figure 42: Middle East & Africa Urea Industry Revenue (million), by Import Market Analysis (Value & Volume) 2025 & 2033
- Figure 43: Middle East & Africa Urea Industry Revenue Share (%), by Import Market Analysis (Value & Volume) 2025 & 2033
- Figure 44: Middle East & Africa Urea Industry Revenue (million), by Export Market Analysis (Value & Volume) 2025 & 2033
- Figure 45: Middle East & Africa Urea Industry Revenue Share (%), by Export Market Analysis (Value & Volume) 2025 & 2033
- Figure 46: Middle East & Africa Urea Industry Revenue (million), by Price Trend Analysis 2025 & 2033
- Figure 47: Middle East & Africa Urea Industry Revenue Share (%), by Price Trend Analysis 2025 & 2033
- Figure 48: Middle East & Africa Urea Industry Revenue (million), by Country 2025 & 2033
- Figure 49: Middle East & Africa Urea Industry Revenue Share (%), by Country 2025 & 2033
- Figure 50: Asia Pacific Urea Industry Revenue (million), by Production Analysis 2025 & 2033
- Figure 51: Asia Pacific Urea Industry Revenue Share (%), by Production Analysis 2025 & 2033
- Figure 52: Asia Pacific Urea Industry Revenue (million), by Consumption Analysis 2025 & 2033
- Figure 53: Asia Pacific Urea Industry Revenue Share (%), by Consumption Analysis 2025 & 2033
- Figure 54: Asia Pacific Urea Industry Revenue (million), by Import Market Analysis (Value & Volume) 2025 & 2033
- Figure 55: Asia Pacific Urea Industry Revenue Share (%), by Import Market Analysis (Value & Volume) 2025 & 2033
- Figure 56: Asia Pacific Urea Industry Revenue (million), by Export Market Analysis (Value & Volume) 2025 & 2033
- Figure 57: Asia Pacific Urea Industry Revenue Share (%), by Export Market Analysis (Value & Volume) 2025 & 2033
- Figure 58: Asia Pacific Urea Industry Revenue (million), by Price Trend Analysis 2025 & 2033
- Figure 59: Asia Pacific Urea Industry Revenue Share (%), by Price Trend Analysis 2025 & 2033
- Figure 60: Asia Pacific Urea Industry Revenue (million), by Country 2025 & 2033
- Figure 61: Asia Pacific Urea Industry Revenue Share (%), by Country 2025 & 2033
List of Tables
- Table 1: Global Urea Industry Revenue million Forecast, by Production Analysis 2020 & 2033
- Table 2: Global Urea Industry Revenue million Forecast, by Consumption Analysis 2020 & 2033
- Table 3: Global Urea Industry Revenue million Forecast, by Import Market Analysis (Value & Volume) 2020 & 2033
- Table 4: Global Urea Industry Revenue million Forecast, by Export Market Analysis (Value & Volume) 2020 & 2033
- Table 5: Global Urea Industry Revenue million Forecast, by Price Trend Analysis 2020 & 2033
- Table 6: Global Urea Industry Revenue million Forecast, by Region 2020 & 2033
- Table 7: Global Urea Industry Revenue million Forecast, by Production Analysis 2020 & 2033
- Table 8: Global Urea Industry Revenue million Forecast, by Consumption Analysis 2020 & 2033
- Table 9: Global Urea Industry Revenue million Forecast, by Import Market Analysis (Value & Volume) 2020 & 2033
- Table 10: Global Urea Industry Revenue million Forecast, by Export Market Analysis (Value & Volume) 2020 & 2033
- Table 11: Global Urea Industry Revenue million Forecast, by Price Trend Analysis 2020 & 2033
- Table 12: Global Urea Industry Revenue million Forecast, by Country 2020 & 2033
- Table 13: United States Urea Industry Revenue (million) Forecast, by Application 2020 & 2033
- Table 14: Canada Urea Industry Revenue (million) Forecast, by Application 2020 & 2033
- Table 15: Mexico Urea Industry Revenue (million) Forecast, by Application 2020 & 2033
- Table 16: Global Urea Industry Revenue million Forecast, by Production Analysis 2020 & 2033
- Table 17: Global Urea Industry Revenue million Forecast, by Consumption Analysis 2020 & 2033
- Table 18: Global Urea Industry Revenue million Forecast, by Import Market Analysis (Value & Volume) 2020 & 2033
- Table 19: Global Urea Industry Revenue million Forecast, by Export Market Analysis (Value & Volume) 2020 & 2033
- Table 20: Global Urea Industry Revenue million Forecast, by Price Trend Analysis 2020 & 2033
- Table 21: Global Urea Industry Revenue million Forecast, by Country 2020 & 2033
- Table 22: Brazil Urea Industry Revenue (million) Forecast, by Application 2020 & 2033
- Table 23: Argentina Urea Industry Revenue (million) Forecast, by Application 2020 & 2033
- Table 24: Rest of South America Urea Industry Revenue (million) Forecast, by Application 2020 & 2033
- Table 25: Global Urea Industry Revenue million Forecast, by Production Analysis 2020 & 2033
- Table 26: Global Urea Industry Revenue million Forecast, by Consumption Analysis 2020 & 2033
- Table 27: Global Urea Industry Revenue million Forecast, by Import Market Analysis (Value & Volume) 2020 & 2033
- Table 28: Global Urea Industry Revenue million Forecast, by Export Market Analysis (Value & Volume) 2020 & 2033
- Table 29: Global Urea Industry Revenue million Forecast, by Price Trend Analysis 2020 & 2033
- Table 30: Global Urea Industry Revenue million Forecast, by Country 2020 & 2033
- Table 31: United Kingdom Urea Industry Revenue (million) Forecast, by Application 2020 & 2033
- Table 32: Germany Urea Industry Revenue (million) Forecast, by Application 2020 & 2033
- Table 33: France Urea Industry Revenue (million) Forecast, by Application 2020 & 2033
- Table 34: Italy Urea Industry Revenue (million) Forecast, by Application 2020 & 2033
- Table 35: Spain Urea Industry Revenue (million) Forecast, by Application 2020 & 2033
- Table 36: Russia Urea Industry Revenue (million) Forecast, by Application 2020 & 2033
- Table 37: Benelux Urea Industry Revenue (million) Forecast, by Application 2020 & 2033
- Table 38: Nordics Urea Industry Revenue (million) Forecast, by Application 2020 & 2033
- Table 39: Rest of Europe Urea Industry Revenue (million) Forecast, by Application 2020 & 2033
- Table 40: Global Urea Industry Revenue million Forecast, by Production Analysis 2020 & 2033
- Table 41: Global Urea Industry Revenue million Forecast, by Consumption Analysis 2020 & 2033
- Table 42: Global Urea Industry Revenue million Forecast, by Import Market Analysis (Value & Volume) 2020 & 2033
- Table 43: Global Urea Industry Revenue million Forecast, by Export Market Analysis (Value & Volume) 2020 & 2033
- Table 44: Global Urea Industry Revenue million Forecast, by Price Trend Analysis 2020 & 2033
- Table 45: Global Urea Industry Revenue million Forecast, by Country 2020 & 2033
- Table 46: Turkey Urea Industry Revenue (million) Forecast, by Application 2020 & 2033
- Table 47: Israel Urea Industry Revenue (million) Forecast, by Application 2020 & 2033
- Table 48: GCC Urea Industry Revenue (million) Forecast, by Application 2020 & 2033
- Table 49: North Africa Urea Industry Revenue (million) Forecast, by Application 2020 & 2033
- Table 50: South Africa Urea Industry Revenue (million) Forecast, by Application 2020 & 2033
- Table 51: Rest of Middle East & Africa Urea Industry Revenue (million) Forecast, by Application 2020 & 2033
- Table 52: Global Urea Industry Revenue million Forecast, by Production Analysis 2020 & 2033
- Table 53: Global Urea Industry Revenue million Forecast, by Consumption Analysis 2020 & 2033
- Table 54: Global Urea Industry Revenue million Forecast, by Import Market Analysis (Value & Volume) 2020 & 2033
- Table 55: Global Urea Industry Revenue million Forecast, by Export Market Analysis (Value & Volume) 2020 & 2033
- Table 56: Global Urea Industry Revenue million Forecast, by Price Trend Analysis 2020 & 2033
- Table 57: Global Urea Industry Revenue million Forecast, by Country 2020 & 2033
- Table 58: China Urea Industry Revenue (million) Forecast, by Application 2020 & 2033
- Table 59: India Urea Industry Revenue (million) Forecast, by Application 2020 & 2033
- Table 60: Japan Urea Industry Revenue (million) Forecast, by Application 2020 & 2033
- Table 61: South Korea Urea Industry Revenue (million) Forecast, by Application 2020 & 2033
- Table 62: ASEAN Urea Industry Revenue (million) Forecast, by Application 2020 & 2033
- Table 63: Oceania Urea Industry Revenue (million) Forecast, by Application 2020 & 2033
- Table 64: Rest of Asia Pacific Urea Industry Revenue (million) Forecast, by Application 2020 & 2033
Frequently Asked Questions
1. What is the projected Compound Annual Growth Rate (CAGR) of the Urea Industry?
The projected CAGR is approximately 0.9%.
2. Which companies are prominent players in the Urea Industry?
Key companies in the market include Coromandel International Ltd, CF Industries Holdings Inc, Koch Industries Inc, Indian Farmers Fertiliser Cooperative Limited, EuroChem Group, SABIC Agri-Nutrients Co, Yara International AS, OCI NV, Nutrien Ltd.
3. What are the main segments of the Urea Industry?
The market segments include Production Analysis, Consumption Analysis, Import Market Analysis (Value & Volume), Export Market Analysis (Value & Volume), Price Trend Analysis.
4. Can you provide details about the market size?
The market size is estimated to be USD 178.8 million as of 2022.
5. What are some drivers contributing to market growth?
Awareness of Landscaping Maintenance; Technological Advancements.
6. What are the notable trends driving market growth?
OTHER KEY INDUSTRY TRENDS COVERED IN THE REPORT.
7. Are there any restraints impacting market growth?
Shortage of Skilled Labor; Wastage of High Amount of Water For Irrigating Lawns.
8. Can you provide examples of recent developments in the market?
April 2023: SABIC Agri-Nutrients Company acquired the ETC Group (ETG) with a 49% stake in the ETG Inputs Holdco Limited for a transaction value of USD 320 million. The agreement is part of SABIC Agri-Nutrients Company's strategy to integrate the value chain and distribution of agri-nutrients markets.March 2022: EuroChem Group has purchased 51.48% of the shares of the Brazilian distributor Fertilizantes Heringer SA, this purchase will further strengthen its production and distribution capacity in Brazil.January 2022: Yara and Lantmännen signed a commercial agreement to bring “green” fertilizers to the market. Produced with renewable energy, these green nitrogen fertilizers are vital to decarbonizing the food chain and offering consumers more sustainable food choices.
9. What pricing options are available for accessing the report?
Pricing options include single-user, multi-user, and enterprise licenses priced at USD 3800, USD 4500, and USD 5800 respectively.
10. Is the market size provided in terms of value or volume?
The market size is provided in terms of value, measured in million.
11. Are there any specific market keywords associated with the report?
Yes, the market keyword associated with the report is "Urea Industry," which aids in identifying and referencing the specific market segment covered.
12. How do I determine which pricing option suits my needs best?
The pricing options vary based on user requirements and access needs. Individual users may opt for single-user licenses, while businesses requiring broader access may choose multi-user or enterprise licenses for cost-effective access to the report.
13. Are there any additional resources or data provided in the Urea Industry report?
While the report offers comprehensive insights, it's advisable to review the specific contents or supplementary materials provided to ascertain if additional resources or data are available.
14. How can I stay updated on further developments or reports in the Urea Industry?
To stay informed about further developments, trends, and reports in the Urea Industry, consider subscribing to industry newsletters, following relevant companies and organizations, or regularly checking reputable industry news sources and publications.
Methodology
Step 1 - Identification of Relevant Samples Size from Population Database


Step 2 - Approaches for Defining Global Market Size (Value, Volume* & Price*)

Note*: In applicable scenarios
Step 3 - Data Sources
Primary Research
- Web Analytics
- Survey Reports
- Research Institute
- Latest Research Reports
- Opinion Leaders
Secondary Research
- Annual Reports
- White Paper
- Latest Press Release
- Industry Association
- Paid Database
- Investor Presentations

Step 4 - Data Triangulation
Involves using different sources of information in order to increase the validity of a study
These sources are likely to be stakeholders in a program - participants, other researchers, program staff, other community members, and so on.
Then we put all data in single framework & apply various statistical tools to find out the dynamic on the market.
During the analysis stage, feedback from the stakeholder groups would be compared to determine areas of agreement as well as areas of divergence