

Key Insights
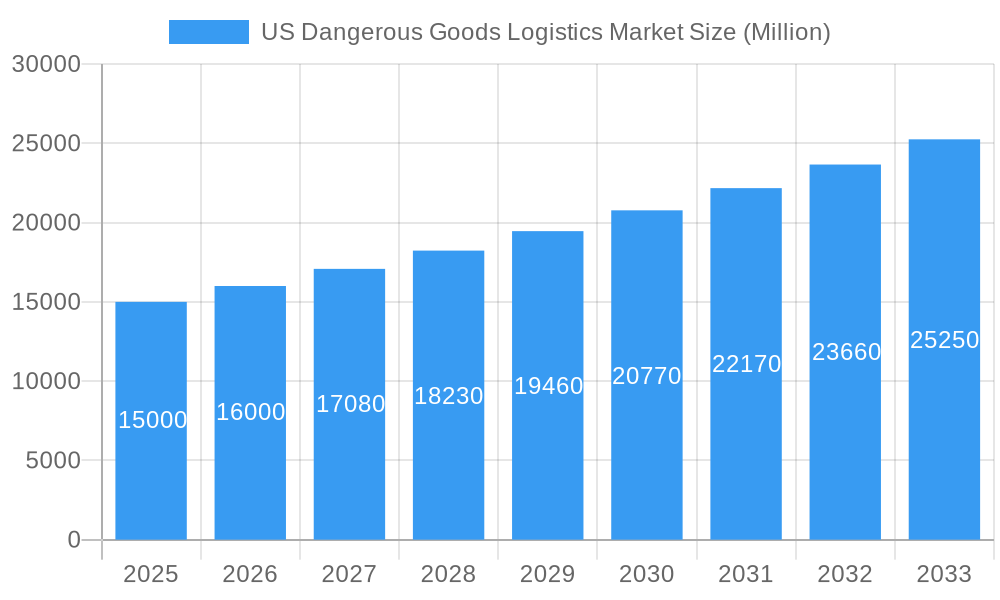
The United States dangerous goods logistics market is poised for significant expansion, projected to reach $251.13 billion by 2033, with a Compound Annual Growth Rate (CAGR) of 7.6% from 2025. This robust growth is underpinned by several key market drivers. The accelerating e-commerce landscape is a primary catalyst, demanding sophisticated and compliant handling of hazardous materials. Furthermore, stringent government regulations governing the transportation and storage of dangerous goods, while presenting operational complexities, are simultaneously fostering opportunities for specialized logistics providers equipped with the necessary expertise and infrastructure. Growth within critical sectors such as pharmaceuticals, chemicals, and energy, all substantial consumers of dangerous goods logistics, further contributes to market expansion. The market is segmented by function, including transportation, warehousing, distribution, and value-added services like packaging and customs clearance, and by destination, encompassing domestic and international movements. The international segment is anticipated to exhibit accelerated growth, driven by increasing global trade volumes. Competitive dynamics are intense, featuring established players such as UPS, FedEx, and DHL, who are actively pursuing market share through technological innovations, including advanced tracking and monitoring systems for hazardous materials, and strategic alliances aimed at network expansion. Regional market performance varies, with distinct growth patterns observed across the Northeast, Southeast, Midwest, Southwest, and West regions, influenced by industry concentration and infrastructural capabilities.
US Dangerous Goods Logistics Market Market Size (In Billion)
Despite the promising growth trajectory, the market faces certain challenges. Volatile fuel prices and economic downturns can influence transportation costs and overall demand. Adhering to evolving regulatory frameworks across diverse jurisdictions presents a considerable operational obstacle for logistics providers. Moreover, the inherent risks associated with handling dangerous goods necessitate comprehensive safety protocols and robust insurance coverage, consequently increasing operational expenditures. Nevertheless, the long-term outlook for the US dangerous goods logistics market remains overwhelmingly positive, propelled by the sustained growth of industries dependent on the secure and efficient movement of hazardous materials. The sector's capacity for adaptation to regulatory changes and technological advancements will be instrumental in shaping its future success.
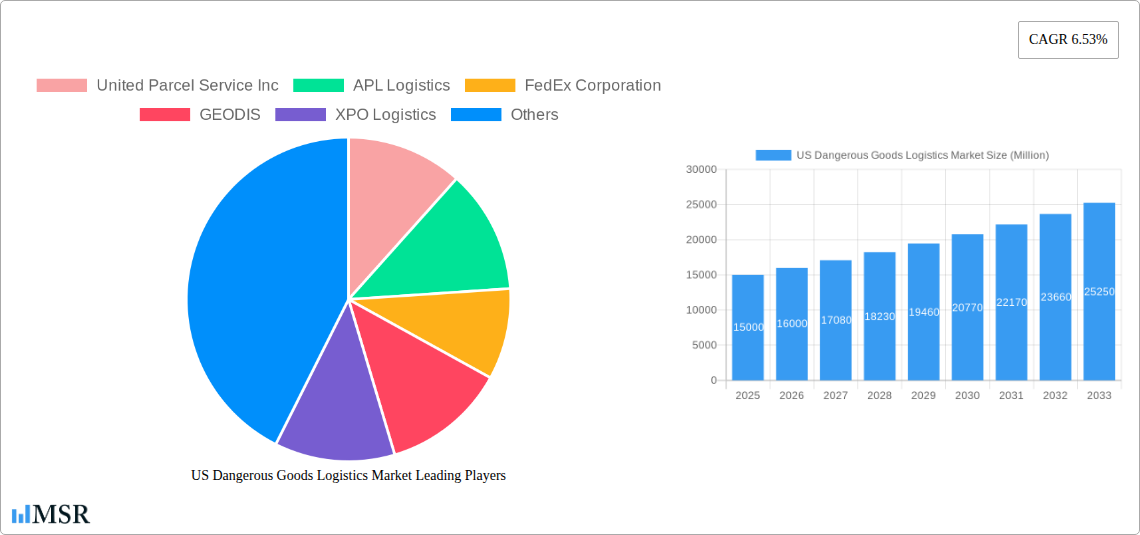
US Dangerous Goods Logistics Market Company Market Share
US Dangerous Goods Logistics Market: A Comprehensive Report (2019-2033)
This comprehensive report provides an in-depth analysis of the US Dangerous Goods Logistics market, offering crucial insights for stakeholders across the industry. Covering the period from 2019 to 2033, with a base year of 2025 and a forecast period of 2025-2033, this study meticulously examines market dynamics, key players, and future growth potential. The market is segmented by function (Transportation, Air, Warehousing & Distribution, Value-added Services) and destination (Domestic, International), providing a granular view of market trends. Key players like United Parcel Service Inc, FedEx Corporation, DHL, and others are analyzed to understand their market share and strategic moves. This report is essential for businesses seeking to navigate the complexities of this specialized sector and capitalize on emerging opportunities. The market is valued at $XX Million in 2025 and is projected to reach $XX Million by 2033, exhibiting a CAGR of XX%.
US Dangerous Goods Logistics Market Market Concentration & Dynamics
The US Dangerous Goods Logistics market exhibits a moderately concentrated structure, with a few large players holding significant market share. The top five companies—United Parcel Service Inc, FedEx Corporation, DHL, XPO Logistics, and GEODIS—control approximately XX% of the market in 2025. However, several mid-sized and smaller companies also contribute significantly, creating a competitive landscape.
Market Share: UPS and FedEx hold the largest market share, with UPS holding approximately XX% and FedEx holding approximately XX% in 2025. DHL and XPO Logistics follow, holding approximately XX% and XX%, respectively.
Innovation Ecosystems: The market is characterized by continuous innovation in areas like tracking technology, specialized packaging solutions, and risk management software. This innovation is driven by both established players and emerging technology companies.
Regulatory Frameworks: Stringent regulations imposed by the Department of Transportation (DOT) and other agencies significantly influence market operations. Compliance costs and the need for specialized training contribute to overall operational costs.
Substitute Products: Limited substitute products exist due to the specialized nature of dangerous goods handling. However, advancements in alternative transportation modes and packaging technologies could potentially impact market dynamics.
End-User Trends: The increasing demand for faster delivery times and enhanced visibility across the supply chain is driving market growth. E-commerce expansion is further contributing to this demand.
M&A Activities: The number of mergers and acquisitions in this sector has been relatively low in recent years (approximately XX deals in the past five years). However, consolidation is anticipated as larger companies seek to expand their market reach and service offerings.
US Dangerous Goods Logistics Market Industry Insights & Trends
The US Dangerous Goods Logistics market experienced significant growth during the historical period (2019-2024) due to increased global trade, stringent regulations, and growing e-commerce activity. The market size grew from $XX Million in 2019 to $XX Million in 2024, showcasing a CAGR of XX%. The forecast period (2025-2033) is expected to witness continued growth driven by several factors. The increasing transportation of hazardous materials, expanding manufacturing sectors particularly in chemicals and pharmaceuticals, and a heightened focus on supply chain security are crucial drivers. Technological advancements in tracking, monitoring, and risk management tools are further shaping market trends, leading to increased efficiency and safety. The rise of big data analytics and AI-powered solutions is helping companies optimize logistics and mitigate risks associated with handling hazardous materials. Consumer behavior is also evolving, with increased awareness of environmental sustainability driving the demand for eco-friendly packaging and transportation solutions. This shift is creating new opportunities for businesses adopting sustainable practices.
Key Markets & Segments Leading US Dangerous Goods Logistics Market
The domestic segment holds a larger share in the US Dangerous Goods Logistics market compared to the international segment. This is attributed to the significant domestic manufacturing and distribution activities within the US. However, the international segment is projected to witness faster growth due to increasing global trade and cross-border movement of dangerous goods.
By Function:
Transportation: Road transportation accounts for the largest share within the transportation segment due to its extensive network and flexibility. Air transportation is crucial for time-sensitive shipments. Rail transportation is gaining traction for bulk shipments over long distances.
Warehousing & Distribution: Specialized warehousing facilities equipped to handle hazardous materials are in high demand, creating significant market opportunities.
Value-added Services: Value-added services like packaging, customs clearance, and freight brokerage are increasingly crucial, driving market expansion. Specialized packaging ensures safe and compliant transportation of hazardous goods, while customs clearance expertise is crucial for international shipments.
By Destination:
- Domestic: Drivers include robust domestic manufacturing, distribution networks, and growth in e-commerce involving hazardous goods.
- International: Drivers include rising global trade, increased demand for international shipping, and the need for compliant international logistics.
Drivers:
- Economic Growth: Robust economic growth in key sectors boosts demand for dangerous goods transportation.
- Infrastructure Development: Investments in infrastructure enhance transportation efficiency and safety.
- Government Regulations: Stringent regulations ensure safe handling and transportation, driving demand for specialized services.
US Dangerous Goods Logistics Market Product Developments
Recent product innovations center around real-time tracking and monitoring systems, advanced packaging solutions for enhanced safety and compliance, and sophisticated software for risk assessment and route optimization. These advancements improve efficiency and reduce the likelihood of accidents and delays, providing a competitive edge. The adoption of blockchain technology is also gaining traction for enhancing supply chain transparency and security in handling dangerous goods.
Challenges in the US Dangerous Goods Logistics Market Market
The US Dangerous Goods Logistics market faces various challenges. Stringent regulations and compliance requirements increase operational costs and necessitate specialized expertise. Supply chain disruptions, fluctuating fuel prices, and driver shortages create operational inefficiencies and impact delivery times. Intense competition among established players and new entrants further creates pricing pressures. The overall impact of these factors is estimated to reduce the market's growth rate by approximately XX% annually.
Forces Driving US Dangerous Goods Logistics Market Growth
The market is driven by several factors: growing e-commerce and increased demand for faster delivery of hazardous materials are key drivers. Technological advancements in tracking and monitoring systems improve efficiency and safety, while stricter regulations and safety standards enhance market demand for compliant logistics solutions. Expansion into new sectors like renewable energy and advanced technologies is also contributing to the market's growth.
Challenges in the US Dangerous Goods Logistics Market Market
Long-term growth hinges on adapting to evolving regulations, embracing new technologies, and fostering strategic partnerships. Investments in innovation, particularly in sustainable logistics solutions and automation, are crucial. Expanding service offerings to cater to niche sectors will open up additional growth opportunities.
Emerging Opportunities in US Dangerous Goods Logistics Market
Emerging opportunities include the adoption of advanced technologies like AI and machine learning for route optimization and predictive maintenance. Focus on sustainable practices and eco-friendly logistics solutions are also gaining traction. Expanding into new and growing sectors, particularly those that generate a high volume of dangerous goods, presents further opportunities.
Leading Players in the US Dangerous Goods Logistics Market Sector
- United Parcel Service Inc
- APL Logistics
- FedEx Corporation
- GEODIS
- XPO Logistics
- Landstar System Inc
- DB Schenker (The Americas)
- Kuehne + Nagel
- Schneider Logistics
- Deutsche Post DHL Group
- DSV
Key Milestones in US Dangerous Goods Logistics Market Industry
- 2020: Increased focus on supply chain resilience in response to the pandemic.
- 2021: Significant investments in technology for improved tracking and monitoring capabilities.
- 2022: Strengthening of regulations concerning dangerous goods transportation.
- 2023: Growing adoption of sustainable practices within the industry.
- 2024: Several mergers and acquisitions among key players.
Strategic Outlook for US Dangerous Goods Logistics Market Market
The future of the US Dangerous Goods Logistics market is bright, driven by increasing demand, technological innovations, and a commitment to safer and more efficient transportation. Companies that can successfully navigate regulatory complexities, leverage technological advancements, and build strong customer relationships are poised for significant growth. The market is expected to witness substantial growth during the forecast period, with increasing investments in infrastructure and technological advancements further fueling expansion.
US Dangerous Goods Logistics Market Segmentation
-
1. BY FUNCTION
-
1.1. Transportation
- 1.1.1. Road
- 1.1.2. Rail
- 1.1.3. Water
- 1.1.4. Pipeline
- 1.1.5. Air
- 1.2. Warehousing and Distribution
- 1.3. Value-ad
-
1.1. Transportation
-
2. BY DESTINATION
- 2.1. Domestic
- 2.2. International
US Dangerous Goods Logistics Market Segmentation By Geography
-
1. North America
- 1.1. United States
- 1.2. Canada
- 1.3. Mexico
-
2. South America
- 2.1. Brazil
- 2.2. Argentina
- 2.3. Rest of South America
-
3. Europe
- 3.1. United Kingdom
- 3.2. Germany
- 3.3. France
- 3.4. Italy
- 3.5. Spain
- 3.6. Russia
- 3.7. Benelux
- 3.8. Nordics
- 3.9. Rest of Europe
-
4. Middle East & Africa
- 4.1. Turkey
- 4.2. Israel
- 4.3. GCC
- 4.4. North Africa
- 4.5. South Africa
- 4.6. Rest of Middle East & Africa
-
5. Asia Pacific
- 5.1. China
- 5.2. India
- 5.3. Japan
- 5.4. South Korea
- 5.5. ASEAN
- 5.6. Oceania
- 5.7. Rest of Asia Pacific
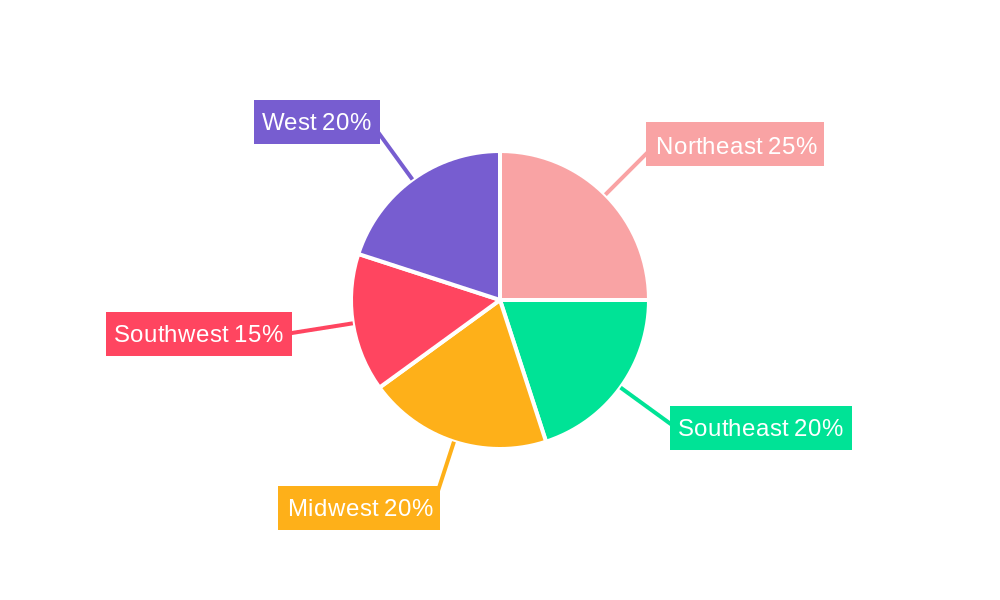
US Dangerous Goods Logistics Market Regional Market Share
Geographic Coverage of US Dangerous Goods Logistics Market
US Dangerous Goods Logistics Market REPORT HIGHLIGHTS
| Aspects | Details |
|---|---|
| Study Period | 2020-2034 |
| Base Year | 2025 |
| Estimated Year | 2026 |
| Forecast Period | 2026-2034 |
| Historical Period | 2020-2025 |
| Growth Rate | CAGR of 7.6% from 2020-2034 |
| Segmentation |
|
Table of Contents
- 1. Introduction
- 1.1. Research Scope
- 1.2. Market Segmentation
- 1.3. Research Objective
- 1.4. Definitions and Assumptions
- 2. Executive Summary
- 2.1. Market Snapshot
- 3. Market Dynamics
- 3.1. Market Drivers
- 3.2. Market Restrains
- 3.3. Market Trends
- 3.4. Market Opportunities
- 4. Market Factor Analysis
- 4.1. Porters Five Forces
- 4.1.1. Bargaining Power of Suppliers
- 4.1.2. Bargaining Power of Buyers
- 4.1.3. Threat of New Entrants
- 4.1.4. Threat of Substitutes
- 4.1.5. Competitive Rivalry
- 4.2. PESTEL analysis
- 4.3. BCG Analysis
- 4.3.1. Stars (High Growth, High Market Share)
- 4.3.2. Cash Cows (Low Growth, High Market Share)
- 4.3.3. Question Mark (High Growth, Low Market Share)
- 4.3.4. Dogs (Low Growth, Low Market Share)
- 4.4. Ansoff Matrix Analysis
- 4.5. Supply Chain Analysis
- 4.6. Regulatory Landscape
- 4.7. Current Market Potential and Opportunity Assessment (TAM–SAM–SOM Framework)
- 4.8. MSR Analyst Note
- 4.1. Porters Five Forces
- 5. Market Analysis, Insights and Forecast 2021-2033
- 5.1. Market Analysis, Insights and Forecast - by BY FUNCTION
- 5.1.1. Transportation
- 5.1.1.1. Road
- 5.1.1.2. Rail
- 5.1.1.3. Water
- 5.1.1.4. Pipeline
- 5.1.1.5. Air
- 5.1.2. Warehousing and Distribution
- 5.1.3. Value-ad
- 5.1.1. Transportation
- 5.2. Market Analysis, Insights and Forecast - by BY DESTINATION
- 5.2.1. Domestic
- 5.2.2. International
- 5.3. Market Analysis, Insights and Forecast - by Region
- 5.3.1. North America
- 5.3.2. South America
- 5.3.3. Europe
- 5.3.4. Middle East & Africa
- 5.3.5. Asia Pacific
- 5.1. Market Analysis, Insights and Forecast - by BY FUNCTION
- 6. Global US Dangerous Goods Logistics Market Analysis, Insights and Forecast, 2021-2033
- 6.1. Market Analysis, Insights and Forecast - by BY FUNCTION
- 6.1.1. Transportation
- 6.1.1.1. Road
- 6.1.1.2. Rail
- 6.1.1.3. Water
- 6.1.1.4. Pipeline
- 6.1.1.5. Air
- 6.1.2. Warehousing and Distribution
- 6.1.3. Value-ad
- 6.1.1. Transportation
- 6.2. Market Analysis, Insights and Forecast - by BY DESTINATION
- 6.2.1. Domestic
- 6.2.2. International
- 6.1. Market Analysis, Insights and Forecast - by BY FUNCTION
- 7. North America US Dangerous Goods Logistics Market Analysis, Insights and Forecast, 2020-2032
- 7.1. Market Analysis, Insights and Forecast - by BY FUNCTION
- 7.1.1. Transportation
- 7.1.1.1. Road
- 7.1.1.2. Rail
- 7.1.1.3. Water
- 7.1.1.4. Pipeline
- 7.1.1.5. Air
- 7.1.2. Warehousing and Distribution
- 7.1.3. Value-ad
- 7.1.1. Transportation
- 7.2. Market Analysis, Insights and Forecast - by BY DESTINATION
- 7.2.1. Domestic
- 7.2.2. International
- 7.1. Market Analysis, Insights and Forecast - by BY FUNCTION
- 8. South America US Dangerous Goods Logistics Market Analysis, Insights and Forecast, 2020-2032
- 8.1. Market Analysis, Insights and Forecast - by BY FUNCTION
- 8.1.1. Transportation
- 8.1.1.1. Road
- 8.1.1.2. Rail
- 8.1.1.3. Water
- 8.1.1.4. Pipeline
- 8.1.1.5. Air
- 8.1.2. Warehousing and Distribution
- 8.1.3. Value-ad
- 8.1.1. Transportation
- 8.2. Market Analysis, Insights and Forecast - by BY DESTINATION
- 8.2.1. Domestic
- 8.2.2. International
- 8.1. Market Analysis, Insights and Forecast - by BY FUNCTION
- 9. Europe US Dangerous Goods Logistics Market Analysis, Insights and Forecast, 2020-2032
- 9.1. Market Analysis, Insights and Forecast - by BY FUNCTION
- 9.1.1. Transportation
- 9.1.1.1. Road
- 9.1.1.2. Rail
- 9.1.1.3. Water
- 9.1.1.4. Pipeline
- 9.1.1.5. Air
- 9.1.2. Warehousing and Distribution
- 9.1.3. Value-ad
- 9.1.1. Transportation
- 9.2. Market Analysis, Insights and Forecast - by BY DESTINATION
- 9.2.1. Domestic
- 9.2.2. International
- 9.1. Market Analysis, Insights and Forecast - by BY FUNCTION
- 10. Middle East & Africa US Dangerous Goods Logistics Market Analysis, Insights and Forecast, 2020-2032
- 10.1. Market Analysis, Insights and Forecast - by BY FUNCTION
- 10.1.1. Transportation
- 10.1.1.1. Road
- 10.1.1.2. Rail
- 10.1.1.3. Water
- 10.1.1.4. Pipeline
- 10.1.1.5. Air
- 10.1.2. Warehousing and Distribution
- 10.1.3. Value-ad
- 10.1.1. Transportation
- 10.2. Market Analysis, Insights and Forecast - by BY DESTINATION
- 10.2.1. Domestic
- 10.2.2. International
- 10.1. Market Analysis, Insights and Forecast - by BY FUNCTION
- 11. Asia Pacific US Dangerous Goods Logistics Market Analysis, Insights and Forecast, 2020-2032
- 11.1. Market Analysis, Insights and Forecast - by BY FUNCTION
- 11.1.1. Transportation
- 11.1.1.1. Road
- 11.1.1.2. Rail
- 11.1.1.3. Water
- 11.1.1.4. Pipeline
- 11.1.1.5. Air
- 11.1.2. Warehousing and Distribution
- 11.1.3. Value-ad
- 11.1.1. Transportation
- 11.2. Market Analysis, Insights and Forecast - by BY DESTINATION
- 11.2.1. Domestic
- 11.2.2. International
- 11.1. Market Analysis, Insights and Forecast - by BY FUNCTION
- 12. Competitive Analysis
- 12.1. Company Profiles
- 12.1.1 United Parcel Service Inc
- 12.1.1.1. Company Overview
- 12.1.1.2. Products
- 12.1.1.3. Company Financials
- 12.1.1.4. SWOT Analysis
- 12.1.2 APL Logistics
- 12.1.2.1. Company Overview
- 12.1.2.2. Products
- 12.1.2.3. Company Financials
- 12.1.2.4. SWOT Analysis
- 12.1.3 FedEx Corporation
- 12.1.3.1. Company Overview
- 12.1.3.2. Products
- 12.1.3.3. Company Financials
- 12.1.3.4. SWOT Analysis
- 12.1.4 GEODIS
- 12.1.4.1. Company Overview
- 12.1.4.2. Products
- 12.1.4.3. Company Financials
- 12.1.4.4. SWOT Analysis
- 12.1.5 XPO Logistics
- 12.1.5.1. Company Overview
- 12.1.5.2. Products
- 12.1.5.3. Company Financials
- 12.1.5.4. SWOT Analysis
- 12.1.6 Landstar System Inc **List Not Exhaustive
- 12.1.6.1. Company Overview
- 12.1.6.2. Products
- 12.1.6.3. Company Financials
- 12.1.6.4. SWOT Analysis
- 12.1.7 DB Schenker (The Americas)
- 12.1.7.1. Company Overview
- 12.1.7.2. Products
- 12.1.7.3. Company Financials
- 12.1.7.4. SWOT Analysis
- 12.1.8 Kuehne + Nagel
- 12.1.8.1. Company Overview
- 12.1.8.2. Products
- 12.1.8.3. Company Financials
- 12.1.8.4. SWOT Analysis
- 12.1.9 Schneider Logistics
- 12.1.9.1. Company Overview
- 12.1.9.2. Products
- 12.1.9.3. Company Financials
- 12.1.9.4. SWOT Analysis
- 12.1.10 Deutsche Post DHL Group
- 12.1.10.1. Company Overview
- 12.1.10.2. Products
- 12.1.10.3. Company Financials
- 12.1.10.4. SWOT Analysis
- 12.1.11 DSV
- 12.1.11.1. Company Overview
- 12.1.11.2. Products
- 12.1.11.3. Company Financials
- 12.1.11.4. SWOT Analysis
- 12.1.1 United Parcel Service Inc
- 12.2. Market Entropy
- 12.2.1 Company's Key Areas Served
- 12.2.2 Recent Developments
- 12.3. Company Market Share Analysis 2025
- 12.3.1 Top 5 Companies Market Share Analysis
- 12.3.2 Top 3 Companies Market Share Analysis
- 12.4. List of Potential Customers
- 13. Research Methodology
List of Figures
- Figure 1: Global US Dangerous Goods Logistics Market Revenue Breakdown (billion, %) by Region 2025 & 2033
- Figure 2: North America US Dangerous Goods Logistics Market Revenue (billion), by BY FUNCTION 2025 & 2033
- Figure 3: North America US Dangerous Goods Logistics Market Revenue Share (%), by BY FUNCTION 2025 & 2033
- Figure 4: North America US Dangerous Goods Logistics Market Revenue (billion), by BY DESTINATION 2025 & 2033
- Figure 5: North America US Dangerous Goods Logistics Market Revenue Share (%), by BY DESTINATION 2025 & 2033
- Figure 6: North America US Dangerous Goods Logistics Market Revenue (billion), by Country 2025 & 2033
- Figure 7: North America US Dangerous Goods Logistics Market Revenue Share (%), by Country 2025 & 2033
- Figure 8: South America US Dangerous Goods Logistics Market Revenue (billion), by BY FUNCTION 2025 & 2033
- Figure 9: South America US Dangerous Goods Logistics Market Revenue Share (%), by BY FUNCTION 2025 & 2033
- Figure 10: South America US Dangerous Goods Logistics Market Revenue (billion), by BY DESTINATION 2025 & 2033
- Figure 11: South America US Dangerous Goods Logistics Market Revenue Share (%), by BY DESTINATION 2025 & 2033
- Figure 12: South America US Dangerous Goods Logistics Market Revenue (billion), by Country 2025 & 2033
- Figure 13: South America US Dangerous Goods Logistics Market Revenue Share (%), by Country 2025 & 2033
- Figure 14: Europe US Dangerous Goods Logistics Market Revenue (billion), by BY FUNCTION 2025 & 2033
- Figure 15: Europe US Dangerous Goods Logistics Market Revenue Share (%), by BY FUNCTION 2025 & 2033
- Figure 16: Europe US Dangerous Goods Logistics Market Revenue (billion), by BY DESTINATION 2025 & 2033
- Figure 17: Europe US Dangerous Goods Logistics Market Revenue Share (%), by BY DESTINATION 2025 & 2033
- Figure 18: Europe US Dangerous Goods Logistics Market Revenue (billion), by Country 2025 & 2033
- Figure 19: Europe US Dangerous Goods Logistics Market Revenue Share (%), by Country 2025 & 2033
- Figure 20: Middle East & Africa US Dangerous Goods Logistics Market Revenue (billion), by BY FUNCTION 2025 & 2033
- Figure 21: Middle East & Africa US Dangerous Goods Logistics Market Revenue Share (%), by BY FUNCTION 2025 & 2033
- Figure 22: Middle East & Africa US Dangerous Goods Logistics Market Revenue (billion), by BY DESTINATION 2025 & 2033
- Figure 23: Middle East & Africa US Dangerous Goods Logistics Market Revenue Share (%), by BY DESTINATION 2025 & 2033
- Figure 24: Middle East & Africa US Dangerous Goods Logistics Market Revenue (billion), by Country 2025 & 2033
- Figure 25: Middle East & Africa US Dangerous Goods Logistics Market Revenue Share (%), by Country 2025 & 2033
- Figure 26: Asia Pacific US Dangerous Goods Logistics Market Revenue (billion), by BY FUNCTION 2025 & 2033
- Figure 27: Asia Pacific US Dangerous Goods Logistics Market Revenue Share (%), by BY FUNCTION 2025 & 2033
- Figure 28: Asia Pacific US Dangerous Goods Logistics Market Revenue (billion), by BY DESTINATION 2025 & 2033
- Figure 29: Asia Pacific US Dangerous Goods Logistics Market Revenue Share (%), by BY DESTINATION 2025 & 2033
- Figure 30: Asia Pacific US Dangerous Goods Logistics Market Revenue (billion), by Country 2025 & 2033
- Figure 31: Asia Pacific US Dangerous Goods Logistics Market Revenue Share (%), by Country 2025 & 2033
List of Tables
- Table 1: Global US Dangerous Goods Logistics Market Revenue billion Forecast, by BY FUNCTION 2020 & 2033
- Table 2: Global US Dangerous Goods Logistics Market Revenue billion Forecast, by BY DESTINATION 2020 & 2033
- Table 3: Global US Dangerous Goods Logistics Market Revenue billion Forecast, by Region 2020 & 2033
- Table 4: Global US Dangerous Goods Logistics Market Revenue billion Forecast, by BY FUNCTION 2020 & 2033
- Table 5: Global US Dangerous Goods Logistics Market Revenue billion Forecast, by BY DESTINATION 2020 & 2033
- Table 6: Global US Dangerous Goods Logistics Market Revenue billion Forecast, by Country 2020 & 2033
- Table 7: United States US Dangerous Goods Logistics Market Revenue (billion) Forecast, by Application 2020 & 2033
- Table 8: Canada US Dangerous Goods Logistics Market Revenue (billion) Forecast, by Application 2020 & 2033
- Table 9: Mexico US Dangerous Goods Logistics Market Revenue (billion) Forecast, by Application 2020 & 2033
- Table 10: Global US Dangerous Goods Logistics Market Revenue billion Forecast, by BY FUNCTION 2020 & 2033
- Table 11: Global US Dangerous Goods Logistics Market Revenue billion Forecast, by BY DESTINATION 2020 & 2033
- Table 12: Global US Dangerous Goods Logistics Market Revenue billion Forecast, by Country 2020 & 2033
- Table 13: Brazil US Dangerous Goods Logistics Market Revenue (billion) Forecast, by Application 2020 & 2033
- Table 14: Argentina US Dangerous Goods Logistics Market Revenue (billion) Forecast, by Application 2020 & 2033
- Table 15: Rest of South America US Dangerous Goods Logistics Market Revenue (billion) Forecast, by Application 2020 & 2033
- Table 16: Global US Dangerous Goods Logistics Market Revenue billion Forecast, by BY FUNCTION 2020 & 2033
- Table 17: Global US Dangerous Goods Logistics Market Revenue billion Forecast, by BY DESTINATION 2020 & 2033
- Table 18: Global US Dangerous Goods Logistics Market Revenue billion Forecast, by Country 2020 & 2033
- Table 19: United Kingdom US Dangerous Goods Logistics Market Revenue (billion) Forecast, by Application 2020 & 2033
- Table 20: Germany US Dangerous Goods Logistics Market Revenue (billion) Forecast, by Application 2020 & 2033
- Table 21: France US Dangerous Goods Logistics Market Revenue (billion) Forecast, by Application 2020 & 2033
- Table 22: Italy US Dangerous Goods Logistics Market Revenue (billion) Forecast, by Application 2020 & 2033
- Table 23: Spain US Dangerous Goods Logistics Market Revenue (billion) Forecast, by Application 2020 & 2033
- Table 24: Russia US Dangerous Goods Logistics Market Revenue (billion) Forecast, by Application 2020 & 2033
- Table 25: Benelux US Dangerous Goods Logistics Market Revenue (billion) Forecast, by Application 2020 & 2033
- Table 26: Nordics US Dangerous Goods Logistics Market Revenue (billion) Forecast, by Application 2020 & 2033
- Table 27: Rest of Europe US Dangerous Goods Logistics Market Revenue (billion) Forecast, by Application 2020 & 2033
- Table 28: Global US Dangerous Goods Logistics Market Revenue billion Forecast, by BY FUNCTION 2020 & 2033
- Table 29: Global US Dangerous Goods Logistics Market Revenue billion Forecast, by BY DESTINATION 2020 & 2033
- Table 30: Global US Dangerous Goods Logistics Market Revenue billion Forecast, by Country 2020 & 2033
- Table 31: Turkey US Dangerous Goods Logistics Market Revenue (billion) Forecast, by Application 2020 & 2033
- Table 32: Israel US Dangerous Goods Logistics Market Revenue (billion) Forecast, by Application 2020 & 2033
- Table 33: GCC US Dangerous Goods Logistics Market Revenue (billion) Forecast, by Application 2020 & 2033
- Table 34: North Africa US Dangerous Goods Logistics Market Revenue (billion) Forecast, by Application 2020 & 2033
- Table 35: South Africa US Dangerous Goods Logistics Market Revenue (billion) Forecast, by Application 2020 & 2033
- Table 36: Rest of Middle East & Africa US Dangerous Goods Logistics Market Revenue (billion) Forecast, by Application 2020 & 2033
- Table 37: Global US Dangerous Goods Logistics Market Revenue billion Forecast, by BY FUNCTION 2020 & 2033
- Table 38: Global US Dangerous Goods Logistics Market Revenue billion Forecast, by BY DESTINATION 2020 & 2033
- Table 39: Global US Dangerous Goods Logistics Market Revenue billion Forecast, by Country 2020 & 2033
- Table 40: China US Dangerous Goods Logistics Market Revenue (billion) Forecast, by Application 2020 & 2033
- Table 41: India US Dangerous Goods Logistics Market Revenue (billion) Forecast, by Application 2020 & 2033
- Table 42: Japan US Dangerous Goods Logistics Market Revenue (billion) Forecast, by Application 2020 & 2033
- Table 43: South Korea US Dangerous Goods Logistics Market Revenue (billion) Forecast, by Application 2020 & 2033
- Table 44: ASEAN US Dangerous Goods Logistics Market Revenue (billion) Forecast, by Application 2020 & 2033
- Table 45: Oceania US Dangerous Goods Logistics Market Revenue (billion) Forecast, by Application 2020 & 2033
- Table 46: Rest of Asia Pacific US Dangerous Goods Logistics Market Revenue (billion) Forecast, by Application 2020 & 2033
Frequently Asked Questions
1. What is the projected Compound Annual Growth Rate (CAGR) of the US Dangerous Goods Logistics Market?
The projected CAGR is approximately 7.6%.
2. Which companies are prominent players in the US Dangerous Goods Logistics Market?
Key companies in the market include United Parcel Service Inc, APL Logistics, FedEx Corporation, GEODIS, XPO Logistics, Landstar System Inc **List Not Exhaustive, DB Schenker (The Americas), Kuehne + Nagel, Schneider Logistics, Deutsche Post DHL Group, DSV.
3. What are the main segments of the US Dangerous Goods Logistics Market?
The market segments include BY FUNCTION, BY DESTINATION.
4. Can you provide details about the market size?
The market size is estimated to be USD 251.13 billion as of 2022.
5. What are some drivers contributing to market growth?
5.1 Drivers 5.2 Restraints 5.3 Opportunities 5.4 Porter's Five Forces Analysis 5.5 Industry Value Chain Analysis.
6. What are the notable trends driving market growth?
The US Oil Industry Growth.
7. Are there any restraints impacting market growth?
5.1 Drivers 5.2 Restraints 5.3 Opportunities 5.4 Porter's Five Forces Analysis 5.5 Industry Value Chain Analysis.
8. Can you provide examples of recent developments in the market?
N/A
9. What pricing options are available for accessing the report?
Pricing options include single-user, multi-user, and enterprise licenses priced at USD 3800, USD 4500, and USD 5800 respectively.
10. Is the market size provided in terms of value or volume?
The market size is provided in terms of value, measured in billion.
11. Are there any specific market keywords associated with the report?
Yes, the market keyword associated with the report is "US Dangerous Goods Logistics Market," which aids in identifying and referencing the specific market segment covered.
12. How do I determine which pricing option suits my needs best?
The pricing options vary based on user requirements and access needs. Individual users may opt for single-user licenses, while businesses requiring broader access may choose multi-user or enterprise licenses for cost-effective access to the report.
13. Are there any additional resources or data provided in the US Dangerous Goods Logistics Market report?
While the report offers comprehensive insights, it's advisable to review the specific contents or supplementary materials provided to ascertain if additional resources or data are available.
14. How can I stay updated on further developments or reports in the US Dangerous Goods Logistics Market?
To stay informed about further developments, trends, and reports in the US Dangerous Goods Logistics Market, consider subscribing to industry newsletters, following relevant companies and organizations, or regularly checking reputable industry news sources and publications.
Methodology
Step 1 - Identification of Relevant Samples Size from Population Database


Step 2 - Approaches for Defining Global Market Size (Value, Volume* & Price*)

Note*: In applicable scenarios
Step 3 - Data Sources
Primary Research
- Web Analytics
- Survey Reports
- Research Institute
- Latest Research Reports
- Opinion Leaders
Secondary Research
- Annual Reports
- White Paper
- Latest Press Release
- Industry Association
- Paid Database
- Investor Presentations

Step 4 - Data Triangulation
Involves using different sources of information in order to increase the validity of a study
These sources are likely to be stakeholders in a program - participants, other researchers, program staff, other community members, and so on.
Then we put all data in single framework & apply various statistical tools to find out the dynamic on the market.
During the analysis stage, feedback from the stakeholder groups would be compared to determine areas of agreement as well as areas of divergence