

Key Insights
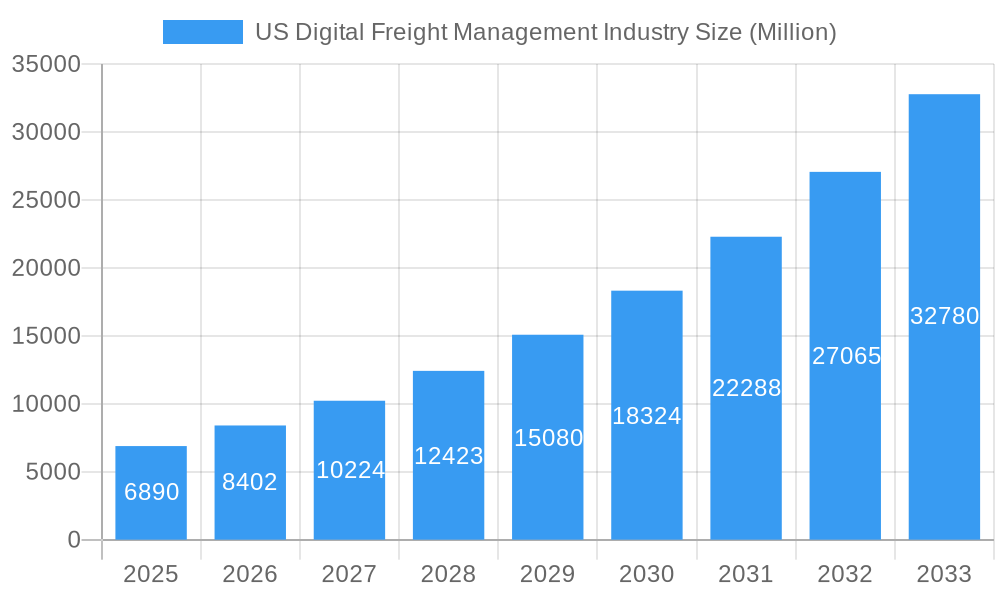
The US digital freight management market, valued at $6.89 billion in 2025, is experiencing robust growth, projected to expand at a compound annual growth rate (CAGR) of 21.72% from 2025 to 2033. This surge is driven by several key factors. The increasing adoption of digital technologies across the logistics sector, coupled with the need for enhanced efficiency and transparency in supply chain operations, is a primary catalyst. E-commerce growth and the resulting demand for faster and more reliable delivery services further fuel market expansion. Furthermore, the integration of advanced analytics and AI-powered solutions allows for better route optimization, predictive maintenance, and real-time shipment tracking, contributing significantly to cost reduction and improved customer satisfaction. The market is segmented by firm type (SMEs, large enterprises, and governments) and mode of transportation (ocean, air, and land), with each segment exhibiting unique growth trajectories. Large enterprises are currently leading adoption due to their higher investment capacity, but SMEs are expected to exhibit faster growth in the coming years due to the increasing accessibility and affordability of digital freight management solutions. Competitive pressures from established players like DHL and Kuehne + Nagel, alongside the emergence of innovative startups like Flexport and Forto, are shaping market dynamics, fostering innovation and driving down prices for consumers. Geographical distribution shows significant concentration in regions with high economic activity and robust logistics networks, with the West, Southeast, and Northeast regions of the United States likely holding the largest market shares. However, Midwest and Southwest regions are expected to show considerable growth as infrastructure improves and digitalization penetrates further into regional logistics.
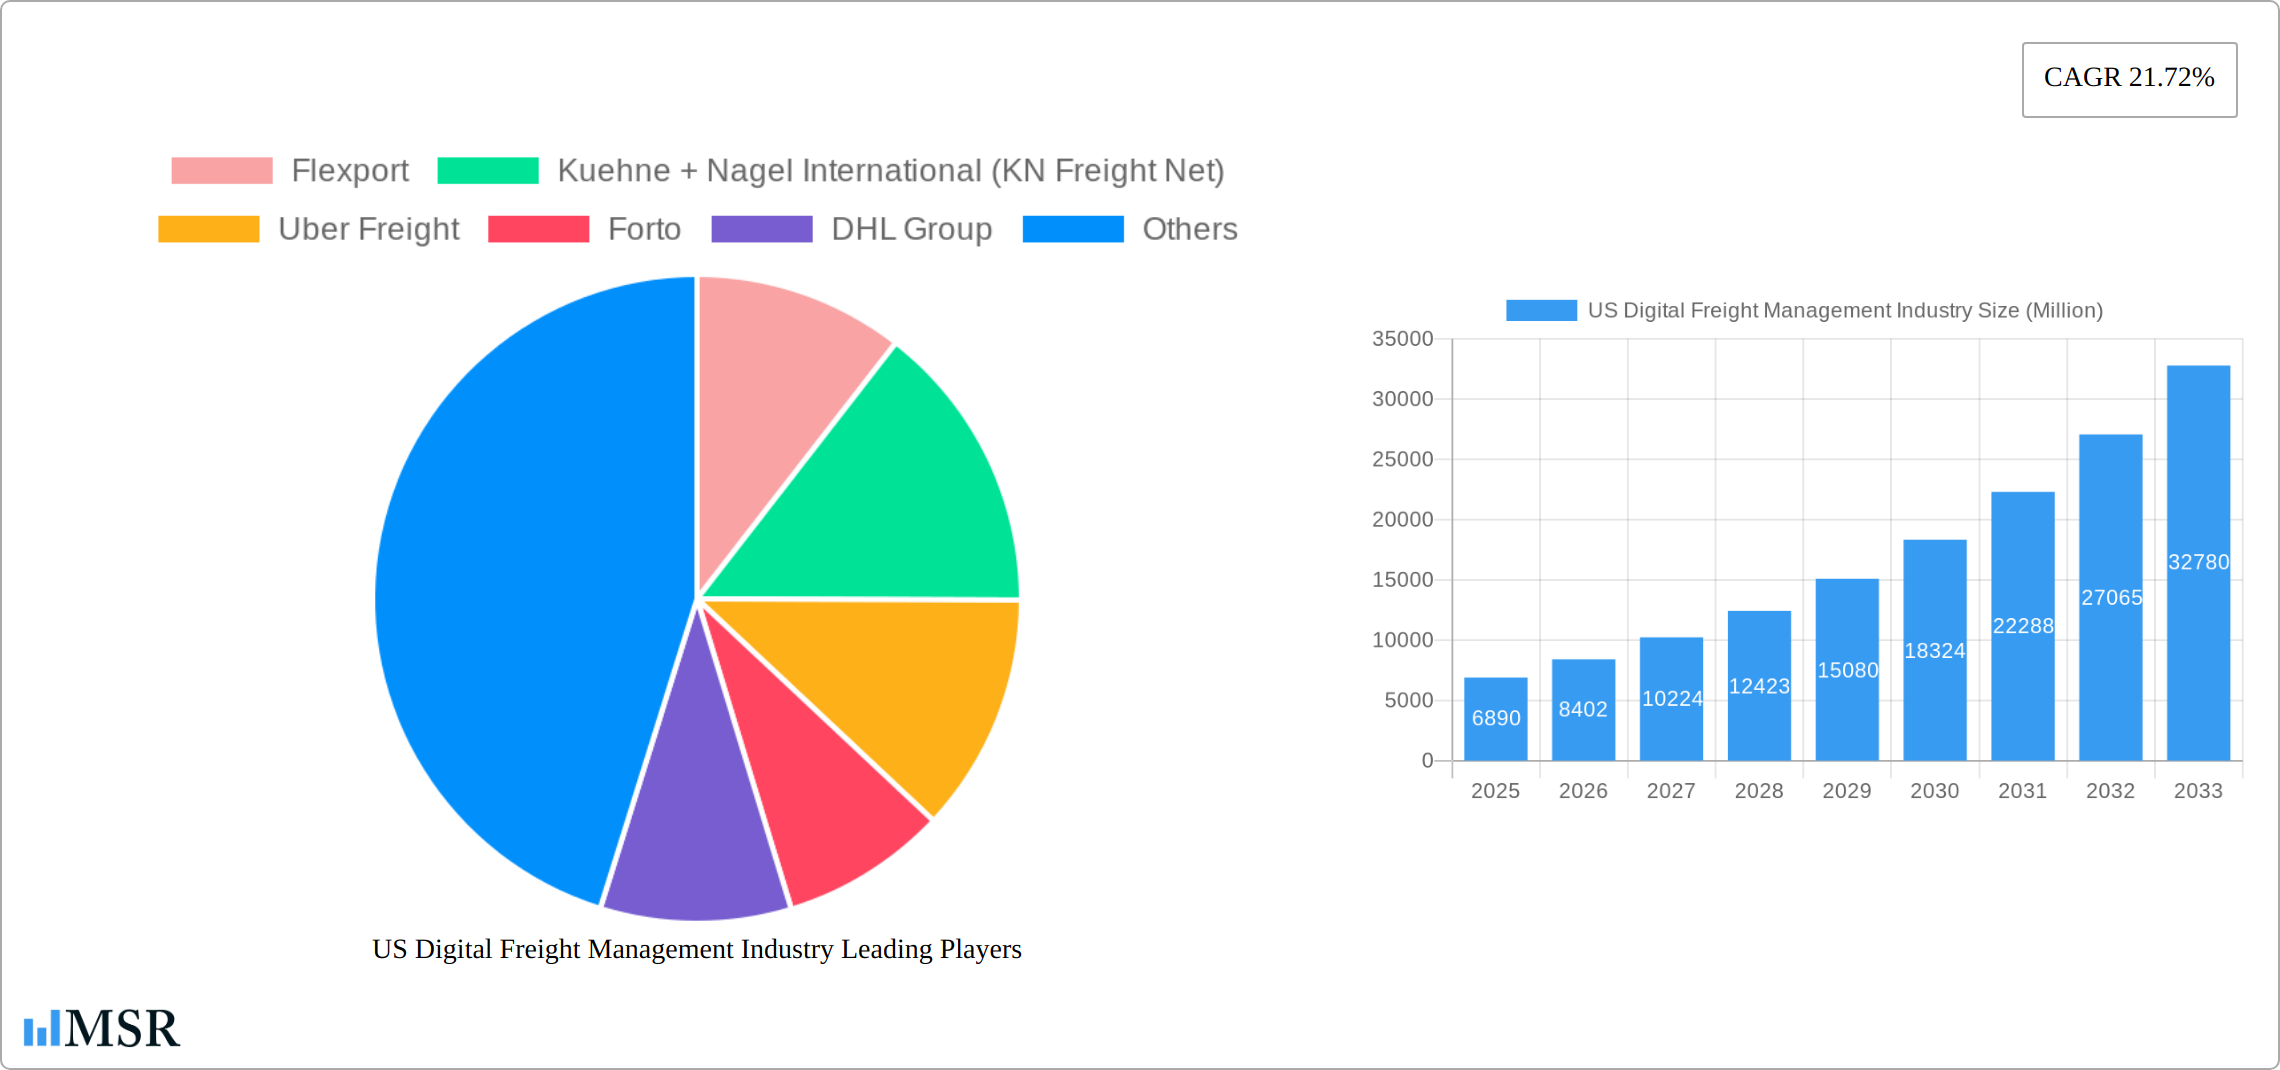
US Digital Freight Management Industry Market Size (In Billion)
The market's growth trajectory is poised to continue, fueled by technological advancements such as blockchain technology for enhanced security and transparency, the Internet of Things (IoT) for real-time data capture, and the further integration of Artificial Intelligence (AI) and Machine Learning (ML) for advanced predictive capabilities. However, challenges remain, including the need for robust cybersecurity measures to protect sensitive data and the integration complexities across different legacy systems within the logistics ecosystem. Regulatory compliance and data privacy concerns also present hurdles to overcome. Despite these challenges, the long-term outlook for the US digital freight management market remains highly positive, with substantial opportunities for growth and innovation in the years to come. The continuous expansion of e-commerce and the ongoing demand for efficient and cost-effective freight solutions are key drivers ensuring sustained market growth and attracting substantial investment in the sector.
US Digital Freight Management Industry Company Market Share
US Digital Freight Management Industry: A Comprehensive Market Report (2019-2033)
This in-depth report provides a comprehensive analysis of the US Digital Freight Management industry, offering invaluable insights for stakeholders, investors, and industry professionals. Covering the period from 2019 to 2033, with a focus on 2025, this report unveils the market's dynamics, key players, emerging trends, and future growth potential. The US digital freight management market, valued at xx Million in 2025, is projected to reach xx Million by 2033, exhibiting a CAGR of xx%.
US Digital Freight Management Industry Market Concentration & Dynamics
The US digital freight management market is a vibrant ecosystem characterized by the strategic convergence of established industry leaders and agile, technology-driven startups. While moderate market concentration exists, with a handful of prominent players commanding substantial market share, the landscape is also rich with numerous smaller enterprises and SMEs that collectively fuel innovation and competition. This dynamic environment is propelled by a robust innovation ecosystem, significantly influenced by rapid technological advancements, including the pervasive integration of Artificial Intelligence (AI), Machine Learning (ML), and the burgeoning potential of blockchain technology. Navigating this market also requires careful consideration of the prevailing regulatory frameworks, particularly those governing data privacy and transportation safety, which exert a material influence on operational strategies. Although traditional freight forwarding methods persist as viable substitutes, digital solutions are increasingly demonstrating their superiority through enhanced efficiency, unparalleled transparency, and streamlined workflows. Key end-user trends, such as the escalating demand for real-time cargo visibility and optimized logistics, are proving to be pivotal growth catalysts. The market has also witnessed significant merger and acquisition (M&A) activity, with notable consolidations, such as the transformative merger of Transplace and Uber Freight in October 2022, fundamentally reshaping the competitive contours of the industry.
- Market Share Evolution: Leading players are strategically consolidating their positions, with the top 5 entities currently estimated to control approximately 55-65% of the market share, reflecting ongoing industry consolidation.
- M&A Activity: The period between 2019 and 2024 has seen a surge in strategic M&A, with over 30 major deals recorded, indicating a clear trend towards consolidation and platform expansion.
- Key Regulatory Factors: Compliance with Federal Motor Carrier Safety Administration (FMCSA) regulations, alongside evolving data privacy laws like the California Consumer Privacy Act (CCPA) and its successors, remains paramount. Emerging regulations around autonomous vehicle integration and emissions standards are also gaining prominence.
- Substitute Products & Emerging Alternatives: While traditional freight forwarding and brokerage services remain significant competitors, emerging digital platforms are increasingly offering integrated solutions that encompass visibility, booking, and payment, challenging the status quo.
US Digital Freight Management Industry Industry Insights & Trends
The US digital freight management market is experiencing rapid expansion, fueled by several key factors. The increasing adoption of digital technologies across the supply chain, including automation, predictive analytics, and real-time tracking, is significantly boosting efficiency and reducing operational costs. Evolving consumer behaviors, such as the demand for faster delivery and enhanced transparency, are driving the need for sophisticated digital freight management solutions. The growth of e-commerce and the rise of omnichannel retail strategies further contribute to market expansion. Market size increased from xx Million in 2019 to xx Million in 2024, demonstrating a strong upward trajectory.
This growth is further accelerated by the integration of advanced technologies such as blockchain for enhanced security and transparency, IoT for real-time tracking and predictive maintenance, and AI for optimized routing and capacity planning. The market is witnessing the emergence of specialized platforms catering to niche sectors, showcasing increasing diversification.
Key Markets & Segments Leading US Digital Freight Management Industry
The US digital freight management market demonstrates strong growth across various segments.
By Firm Type:
- Large Enterprises: This segment dominates the market, driven by their high shipping volumes and need for sophisticated logistics solutions. Factors like robust IT infrastructure and substantial budgets facilitate wider adoption.
- SMEs: This segment shows significant growth potential, fueled by the availability of affordable and user-friendly digital platforms designed for smaller businesses. The increasing accessibility of cloud-based solutions and SaaS offerings is a significant catalyst.
- Governments: This segment represents a growing market, driven by the need for improved efficiency in public procurement and logistics management. Government initiatives focusing on infrastructure development and digital transformation are significant drivers.
By Mode of Transportation:
- Land: This segment currently holds the largest market share due to the extensive land transportation network within the US. The ongoing growth of e-commerce significantly drives the need for efficient land-based freight solutions.
- Ocean: This segment exhibits substantial growth potential, driven by increasing global trade and the need for efficient and transparent ocean freight management solutions.
- Air: This segment showcases steady growth, driven by the demand for faster delivery of high-value goods and time-sensitive shipments.
US Digital Freight Management Industry Product Developments
The US digital freight management sector is at the forefront of a wave of groundbreaking product and service innovations. Companies are actively deploying sophisticated AI-powered tools for predictive route optimization, leveraging machine learning algorithms to minimize transit times and fuel consumption. Blockchain technology is being integrated to create immutable, transparent, and secure cargo tracking systems, enhancing trust and accountability across the supply chain. Furthermore, advanced analytics dashboards are providing unprecedented real-time visibility into every facet of freight operations, from shipment status and potential disruptions to cost analysis and carrier performance. These technological leaps are not merely incremental improvements; they are fundamentally transforming operational efficiencies, driving significant cost reductions, and fostering greater transparency and predictability throughout the entire logistics lifecycle. Consequently, businesses leveraging these advanced digital solutions are able to secure substantial competitive advantages in an increasingly complex global marketplace.
Challenges in the US Digital Freight Management Industry Market
The US digital freight management industry faces challenges, including regulatory hurdles related to data privacy and cybersecurity, persistent supply chain disruptions causing fluctuating fuel costs and capacity shortages, and intense competition from both established players and new entrants. These factors can impact profitability and hinder market expansion, although innovative solutions and strategic partnerships are mitigating these obstacles.
Forces Driving US Digital Freight Management Industry Growth
The trajectory of growth within the US digital freight management industry is being propelled by a confluence of powerful forces. A primary driver is the accelerating adoption of digital technologies across all segments of the logistics value chain, moving beyond basic digitization to encompass sophisticated automation and intelligence. The continued expansion of e-commerce and the increasing prevalence of omnichannel retail models are creating unprecedented demand for flexible, efficient, and visible freight solutions. Government initiatives aimed at promoting digitalization within the logistics sector, coupled with investments in infrastructure and technological development, are providing a supportive environment for growth. Moreover, the persistent and escalating demand for enhanced supply chain efficiency, cost optimization, and superior transparency from shippers and consumers alike continues to fuel innovation and market expansion.
Long-Term Growth Catalysts in the US Digital Freight Management Industry
Long-term growth will be driven by continuous technological innovations, strategic partnerships and collaborations between technology providers and logistics companies, and expansion into new market segments and geographical areas. The increasing adoption of automation and AI will further enhance efficiency and reduce operational costs, driving sustainable growth.
Emerging Opportunities in US Digital Freight Management Industry
The US digital freight management industry is ripe with emerging opportunities for forward-thinking companies. A significant avenue lies in the expansion of digital freight management solutions into specialized, niche industries that have traditionally been underserved by broad-based platforms. The strategic integration of cutting-edge technologies, such as the Internet of Things (IoT) for granular cargo monitoring and enhanced predictive maintenance, alongside the continued maturation of blockchain for secure and traceable transactions, presents substantial growth potential. Furthermore, the development of highly tailored, customizable solutions designed to meet the specific operational needs, risk profiles, and evolving preferences of diverse customer segments is a key opportunity. In parallel, the growing global emphasis on sustainability within logistics is creating a fertile ground for environmentally conscious solutions, including those focused on reducing carbon footprints, optimizing load factors, and promoting greener transportation modes.
Leading Players in the US Digital Freight Management Industry Sector
- Flexport
- Kuehne + Nagel International (KN Freight Net)
- Uber Freight
- Forto
- DHL Group
- Agility Logistics Pvt Ltd
- Expeditors International
- InstaFreight
- Turvo
- iContainers
- Twill
- NYSHEX
- Transporteca
- uShip
- Convoy
- Kontainers
Key Milestones in US Digital Freight Management Industry Industry
- October 2022: Transplace and Uber Freight merger completed, creating a significant player in the market, enhancing technological capabilities, and expanding network reach.
- September 2022: Kuehne+Nagel announced the development of a new healthcare contract logistics network in the US, highlighting the growing demand for specialized logistics solutions within the healthcare sector.
Strategic Outlook for US Digital Freight Management Industry Market
The future of the US digital freight management market is bright, with continued growth driven by technological innovation, increasing demand for efficient and transparent logistics solutions, and the expansion into new market segments. Strategic partnerships and collaborations will play a crucial role in shaping the market landscape, fostering innovation and driving market expansion. The focus on sustainability and data-driven decision-making will further shape market developments in the coming years.
US Digital Freight Management Industry Segmentation
-
1. Mode of Transportation
- 1.1. Ocean
- 1.2. Air
- 1.3. Land
-
2. Firm Type
- 2.1. SMEs
- 2.2. Large Enterprises and Governments
US Digital Freight Management Industry Segmentation By Geography
-
1. North America
- 1.1. United States
- 1.2. Canada
- 1.3. Mexico
-
2. South America
- 2.1. Brazil
- 2.2. Argentina
- 2.3. Rest of South America
-
3. Europe
- 3.1. United Kingdom
- 3.2. Germany
- 3.3. France
- 3.4. Italy
- 3.5. Spain
- 3.6. Russia
- 3.7. Benelux
- 3.8. Nordics
- 3.9. Rest of Europe
-
4. Middle East & Africa
- 4.1. Turkey
- 4.2. Israel
- 4.3. GCC
- 4.4. North Africa
- 4.5. South Africa
- 4.6. Rest of Middle East & Africa
-
5. Asia Pacific
- 5.1. China
- 5.2. India
- 5.3. Japan
- 5.4. South Korea
- 5.5. ASEAN
- 5.6. Oceania
- 5.7. Rest of Asia Pacific
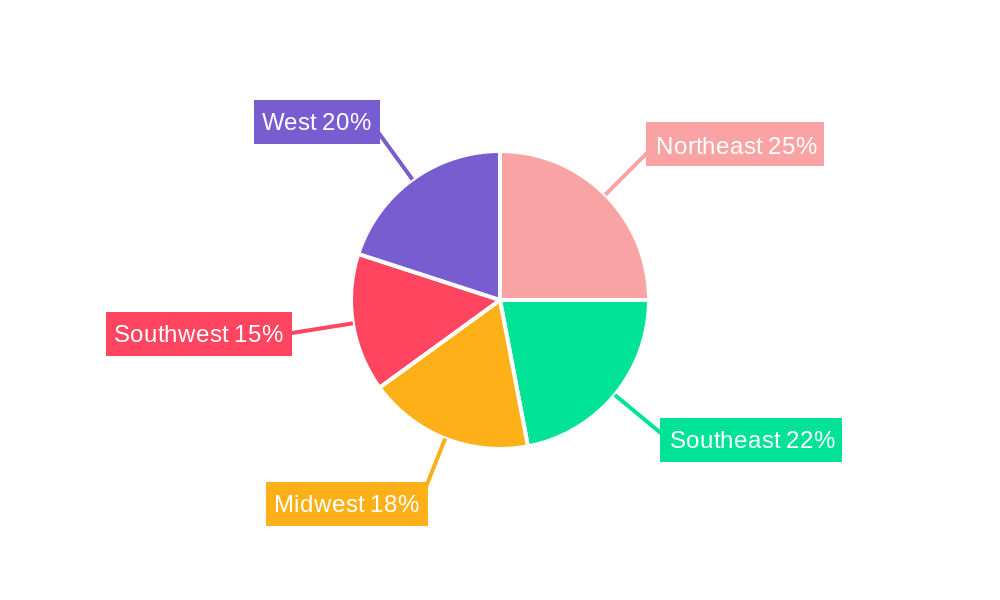
US Digital Freight Management Industry Regional Market Share
Geographic Coverage of US Digital Freight Management Industry
US Digital Freight Management Industry REPORT HIGHLIGHTS
| Aspects | Details |
|---|---|
| Study Period | 2020-2034 |
| Base Year | 2025 |
| Estimated Year | 2026 |
| Forecast Period | 2026-2034 |
| Historical Period | 2020-2025 |
| Growth Rate | CAGR of 21.72% from 2020-2034 |
| Segmentation |
|
Table of Contents
- 1. Introduction
- 1.1. Research Scope
- 1.2. Market Segmentation
- 1.3. Research Objective
- 1.4. Definitions and Assumptions
- 2. Executive Summary
- 2.1. Market Snapshot
- 3. Market Dynamics
- 3.1. Market Drivers
- 3.2. Market Restrains
- 3.3. Market Trends
- 3.4. Market Opportunities
- 4. Market Factor Analysis
- 4.1. Porters Five Forces
- 4.1.1. Bargaining Power of Suppliers
- 4.1.2. Bargaining Power of Buyers
- 4.1.3. Threat of New Entrants
- 4.1.4. Threat of Substitutes
- 4.1.5. Competitive Rivalry
- 4.2. PESTEL analysis
- 4.3. BCG Analysis
- 4.3.1. Stars (High Growth, High Market Share)
- 4.3.2. Cash Cows (Low Growth, High Market Share)
- 4.3.3. Question Mark (High Growth, Low Market Share)
- 4.3.4. Dogs (Low Growth, Low Market Share)
- 4.4. Ansoff Matrix Analysis
- 4.5. Supply Chain Analysis
- 4.6. Regulatory Landscape
- 4.7. Current Market Potential and Opportunity Assessment (TAM–SAM–SOM Framework)
- 4.8. MSR Analyst Note
- 4.1. Porters Five Forces
- 5. Market Analysis, Insights and Forecast 2021-2033
- 5.1. Market Analysis, Insights and Forecast - by Mode of Transportation
- 5.1.1. Ocean
- 5.1.2. Air
- 5.1.3. Land
- 5.2. Market Analysis, Insights and Forecast - by Firm Type
- 5.2.1. SMEs
- 5.2.2. Large Enterprises and Governments
- 5.3. Market Analysis, Insights and Forecast - by Region
- 5.3.1. North America
- 5.3.2. South America
- 5.3.3. Europe
- 5.3.4. Middle East & Africa
- 5.3.5. Asia Pacific
- 5.1. Market Analysis, Insights and Forecast - by Mode of Transportation
- 6. Global US Digital Freight Management Industry Analysis, Insights and Forecast, 2021-2033
- 6.1. Market Analysis, Insights and Forecast - by Mode of Transportation
- 6.1.1. Ocean
- 6.1.2. Air
- 6.1.3. Land
- 6.2. Market Analysis, Insights and Forecast - by Firm Type
- 6.2.1. SMEs
- 6.2.2. Large Enterprises and Governments
- 6.1. Market Analysis, Insights and Forecast - by Mode of Transportation
- 7. North America US Digital Freight Management Industry Analysis, Insights and Forecast, 2020-2032
- 7.1. Market Analysis, Insights and Forecast - by Mode of Transportation
- 7.1.1. Ocean
- 7.1.2. Air
- 7.1.3. Land
- 7.2. Market Analysis, Insights and Forecast - by Firm Type
- 7.2.1. SMEs
- 7.2.2. Large Enterprises and Governments
- 7.1. Market Analysis, Insights and Forecast - by Mode of Transportation
- 8. South America US Digital Freight Management Industry Analysis, Insights and Forecast, 2020-2032
- 8.1. Market Analysis, Insights and Forecast - by Mode of Transportation
- 8.1.1. Ocean
- 8.1.2. Air
- 8.1.3. Land
- 8.2. Market Analysis, Insights and Forecast - by Firm Type
- 8.2.1. SMEs
- 8.2.2. Large Enterprises and Governments
- 8.1. Market Analysis, Insights and Forecast - by Mode of Transportation
- 9. Europe US Digital Freight Management Industry Analysis, Insights and Forecast, 2020-2032
- 9.1. Market Analysis, Insights and Forecast - by Mode of Transportation
- 9.1.1. Ocean
- 9.1.2. Air
- 9.1.3. Land
- 9.2. Market Analysis, Insights and Forecast - by Firm Type
- 9.2.1. SMEs
- 9.2.2. Large Enterprises and Governments
- 9.1. Market Analysis, Insights and Forecast - by Mode of Transportation
- 10. Middle East & Africa US Digital Freight Management Industry Analysis, Insights and Forecast, 2020-2032
- 10.1. Market Analysis, Insights and Forecast - by Mode of Transportation
- 10.1.1. Ocean
- 10.1.2. Air
- 10.1.3. Land
- 10.2. Market Analysis, Insights and Forecast - by Firm Type
- 10.2.1. SMEs
- 10.2.2. Large Enterprises and Governments
- 10.1. Market Analysis, Insights and Forecast - by Mode of Transportation
- 11. Asia Pacific US Digital Freight Management Industry Analysis, Insights and Forecast, 2020-2032
- 11.1. Market Analysis, Insights and Forecast - by Mode of Transportation
- 11.1.1. Ocean
- 11.1.2. Air
- 11.1.3. Land
- 11.2. Market Analysis, Insights and Forecast - by Firm Type
- 11.2.1. SMEs
- 11.2.2. Large Enterprises and Governments
- 11.1. Market Analysis, Insights and Forecast - by Mode of Transportation
- 12. Competitive Analysis
- 12.1. Company Profiles
- 12.1.1 Flexport
- 12.1.1.1. Company Overview
- 12.1.1.2. Products
- 12.1.1.3. Company Financials
- 12.1.1.4. SWOT Analysis
- 12.1.2 Kuehne + Nagel International (KN Freight Net)
- 12.1.2.1. Company Overview
- 12.1.2.2. Products
- 12.1.2.3. Company Financials
- 12.1.2.4. SWOT Analysis
- 12.1.3 Uber Freight
- 12.1.3.1. Company Overview
- 12.1.3.2. Products
- 12.1.3.3. Company Financials
- 12.1.3.4. SWOT Analysis
- 12.1.4 Forto
- 12.1.4.1. Company Overview
- 12.1.4.2. Products
- 12.1.4.3. Company Financials
- 12.1.4.4. SWOT Analysis
- 12.1.5 DHL Group
- 12.1.5.1. Company Overview
- 12.1.5.2. Products
- 12.1.5.3. Company Financials
- 12.1.5.4. SWOT Analysis
- 12.1.6 Agility Logistics Pvt Ltd
- 12.1.6.1. Company Overview
- 12.1.6.2. Products
- 12.1.6.3. Company Financials
- 12.1.6.4. SWOT Analysis
- 12.1.7 Expeditors International
- 12.1.7.1. Company Overview
- 12.1.7.2. Products
- 12.1.7.3. Company Financials
- 12.1.7.4. SWOT Analysis
- 12.1.8 InstaFreight
- 12.1.8.1. Company Overview
- 12.1.8.2. Products
- 12.1.8.3. Company Financials
- 12.1.8.4. SWOT Analysis
- 12.1.9 Turvo
- 12.1.9.1. Company Overview
- 12.1.9.2. Products
- 12.1.9.3. Company Financials
- 12.1.9.4. SWOT Analysis
- 12.1.10 iContainers
- 12.1.10.1. Company Overview
- 12.1.10.2. Products
- 12.1.10.3. Company Financials
- 12.1.10.4. SWOT Analysis
- 12.1.11 Twill
- 12.1.11.1. Company Overview
- 12.1.11.2. Products
- 12.1.11.3. Company Financials
- 12.1.11.4. SWOT Analysis
- 12.1.12 NYSHEX
- 12.1.12.1. Company Overview
- 12.1.12.2. Products
- 12.1.12.3. Company Financials
- 12.1.12.4. SWOT Analysis
- 12.1.13 Transporteca
- 12.1.13.1. Company Overview
- 12.1.13.2. Products
- 12.1.13.3. Company Financials
- 12.1.13.4. SWOT Analysis
- 12.1.14 uShip**List Not Exhaustive
- 12.1.14.1. Company Overview
- 12.1.14.2. Products
- 12.1.14.3. Company Financials
- 12.1.14.4. SWOT Analysis
- 12.1.15 Convoy
- 12.1.15.1. Company Overview
- 12.1.15.2. Products
- 12.1.15.3. Company Financials
- 12.1.15.4. SWOT Analysis
- 12.1.16 Kontainers
- 12.1.16.1. Company Overview
- 12.1.16.2. Products
- 12.1.16.3. Company Financials
- 12.1.16.4. SWOT Analysis
- 12.1.1 Flexport
- 12.2. Market Entropy
- 12.2.1 Company's Key Areas Served
- 12.2.2 Recent Developments
- 12.3. Company Market Share Analysis 2025
- 12.3.1 Top 5 Companies Market Share Analysis
- 12.3.2 Top 3 Companies Market Share Analysis
- 12.4. List of Potential Customers
- 13. Research Methodology
List of Figures
- Figure 1: Global US Digital Freight Management Industry Revenue Breakdown (Million, %) by Region 2025 & 2033
- Figure 2: North America US Digital Freight Management Industry Revenue (Million), by Mode of Transportation 2025 & 2033
- Figure 3: North America US Digital Freight Management Industry Revenue Share (%), by Mode of Transportation 2025 & 2033
- Figure 4: North America US Digital Freight Management Industry Revenue (Million), by Firm Type 2025 & 2033
- Figure 5: North America US Digital Freight Management Industry Revenue Share (%), by Firm Type 2025 & 2033
- Figure 6: North America US Digital Freight Management Industry Revenue (Million), by Country 2025 & 2033
- Figure 7: North America US Digital Freight Management Industry Revenue Share (%), by Country 2025 & 2033
- Figure 8: South America US Digital Freight Management Industry Revenue (Million), by Mode of Transportation 2025 & 2033
- Figure 9: South America US Digital Freight Management Industry Revenue Share (%), by Mode of Transportation 2025 & 2033
- Figure 10: South America US Digital Freight Management Industry Revenue (Million), by Firm Type 2025 & 2033
- Figure 11: South America US Digital Freight Management Industry Revenue Share (%), by Firm Type 2025 & 2033
- Figure 12: South America US Digital Freight Management Industry Revenue (Million), by Country 2025 & 2033
- Figure 13: South America US Digital Freight Management Industry Revenue Share (%), by Country 2025 & 2033
- Figure 14: Europe US Digital Freight Management Industry Revenue (Million), by Mode of Transportation 2025 & 2033
- Figure 15: Europe US Digital Freight Management Industry Revenue Share (%), by Mode of Transportation 2025 & 2033
- Figure 16: Europe US Digital Freight Management Industry Revenue (Million), by Firm Type 2025 & 2033
- Figure 17: Europe US Digital Freight Management Industry Revenue Share (%), by Firm Type 2025 & 2033
- Figure 18: Europe US Digital Freight Management Industry Revenue (Million), by Country 2025 & 2033
- Figure 19: Europe US Digital Freight Management Industry Revenue Share (%), by Country 2025 & 2033
- Figure 20: Middle East & Africa US Digital Freight Management Industry Revenue (Million), by Mode of Transportation 2025 & 2033
- Figure 21: Middle East & Africa US Digital Freight Management Industry Revenue Share (%), by Mode of Transportation 2025 & 2033
- Figure 22: Middle East & Africa US Digital Freight Management Industry Revenue (Million), by Firm Type 2025 & 2033
- Figure 23: Middle East & Africa US Digital Freight Management Industry Revenue Share (%), by Firm Type 2025 & 2033
- Figure 24: Middle East & Africa US Digital Freight Management Industry Revenue (Million), by Country 2025 & 2033
- Figure 25: Middle East & Africa US Digital Freight Management Industry Revenue Share (%), by Country 2025 & 2033
- Figure 26: Asia Pacific US Digital Freight Management Industry Revenue (Million), by Mode of Transportation 2025 & 2033
- Figure 27: Asia Pacific US Digital Freight Management Industry Revenue Share (%), by Mode of Transportation 2025 & 2033
- Figure 28: Asia Pacific US Digital Freight Management Industry Revenue (Million), by Firm Type 2025 & 2033
- Figure 29: Asia Pacific US Digital Freight Management Industry Revenue Share (%), by Firm Type 2025 & 2033
- Figure 30: Asia Pacific US Digital Freight Management Industry Revenue (Million), by Country 2025 & 2033
- Figure 31: Asia Pacific US Digital Freight Management Industry Revenue Share (%), by Country 2025 & 2033
List of Tables
- Table 1: Global US Digital Freight Management Industry Revenue Million Forecast, by Mode of Transportation 2020 & 2033
- Table 2: Global US Digital Freight Management Industry Revenue Million Forecast, by Firm Type 2020 & 2033
- Table 3: Global US Digital Freight Management Industry Revenue Million Forecast, by Region 2020 & 2033
- Table 4: Global US Digital Freight Management Industry Revenue Million Forecast, by Mode of Transportation 2020 & 2033
- Table 5: Global US Digital Freight Management Industry Revenue Million Forecast, by Firm Type 2020 & 2033
- Table 6: Global US Digital Freight Management Industry Revenue Million Forecast, by Country 2020 & 2033
- Table 7: United States US Digital Freight Management Industry Revenue (Million) Forecast, by Application 2020 & 2033
- Table 8: Canada US Digital Freight Management Industry Revenue (Million) Forecast, by Application 2020 & 2033
- Table 9: Mexico US Digital Freight Management Industry Revenue (Million) Forecast, by Application 2020 & 2033
- Table 10: Global US Digital Freight Management Industry Revenue Million Forecast, by Mode of Transportation 2020 & 2033
- Table 11: Global US Digital Freight Management Industry Revenue Million Forecast, by Firm Type 2020 & 2033
- Table 12: Global US Digital Freight Management Industry Revenue Million Forecast, by Country 2020 & 2033
- Table 13: Brazil US Digital Freight Management Industry Revenue (Million) Forecast, by Application 2020 & 2033
- Table 14: Argentina US Digital Freight Management Industry Revenue (Million) Forecast, by Application 2020 & 2033
- Table 15: Rest of South America US Digital Freight Management Industry Revenue (Million) Forecast, by Application 2020 & 2033
- Table 16: Global US Digital Freight Management Industry Revenue Million Forecast, by Mode of Transportation 2020 & 2033
- Table 17: Global US Digital Freight Management Industry Revenue Million Forecast, by Firm Type 2020 & 2033
- Table 18: Global US Digital Freight Management Industry Revenue Million Forecast, by Country 2020 & 2033
- Table 19: United Kingdom US Digital Freight Management Industry Revenue (Million) Forecast, by Application 2020 & 2033
- Table 20: Germany US Digital Freight Management Industry Revenue (Million) Forecast, by Application 2020 & 2033
- Table 21: France US Digital Freight Management Industry Revenue (Million) Forecast, by Application 2020 & 2033
- Table 22: Italy US Digital Freight Management Industry Revenue (Million) Forecast, by Application 2020 & 2033
- Table 23: Spain US Digital Freight Management Industry Revenue (Million) Forecast, by Application 2020 & 2033
- Table 24: Russia US Digital Freight Management Industry Revenue (Million) Forecast, by Application 2020 & 2033
- Table 25: Benelux US Digital Freight Management Industry Revenue (Million) Forecast, by Application 2020 & 2033
- Table 26: Nordics US Digital Freight Management Industry Revenue (Million) Forecast, by Application 2020 & 2033
- Table 27: Rest of Europe US Digital Freight Management Industry Revenue (Million) Forecast, by Application 2020 & 2033
- Table 28: Global US Digital Freight Management Industry Revenue Million Forecast, by Mode of Transportation 2020 & 2033
- Table 29: Global US Digital Freight Management Industry Revenue Million Forecast, by Firm Type 2020 & 2033
- Table 30: Global US Digital Freight Management Industry Revenue Million Forecast, by Country 2020 & 2033
- Table 31: Turkey US Digital Freight Management Industry Revenue (Million) Forecast, by Application 2020 & 2033
- Table 32: Israel US Digital Freight Management Industry Revenue (Million) Forecast, by Application 2020 & 2033
- Table 33: GCC US Digital Freight Management Industry Revenue (Million) Forecast, by Application 2020 & 2033
- Table 34: North Africa US Digital Freight Management Industry Revenue (Million) Forecast, by Application 2020 & 2033
- Table 35: South Africa US Digital Freight Management Industry Revenue (Million) Forecast, by Application 2020 & 2033
- Table 36: Rest of Middle East & Africa US Digital Freight Management Industry Revenue (Million) Forecast, by Application 2020 & 2033
- Table 37: Global US Digital Freight Management Industry Revenue Million Forecast, by Mode of Transportation 2020 & 2033
- Table 38: Global US Digital Freight Management Industry Revenue Million Forecast, by Firm Type 2020 & 2033
- Table 39: Global US Digital Freight Management Industry Revenue Million Forecast, by Country 2020 & 2033
- Table 40: China US Digital Freight Management Industry Revenue (Million) Forecast, by Application 2020 & 2033
- Table 41: India US Digital Freight Management Industry Revenue (Million) Forecast, by Application 2020 & 2033
- Table 42: Japan US Digital Freight Management Industry Revenue (Million) Forecast, by Application 2020 & 2033
- Table 43: South Korea US Digital Freight Management Industry Revenue (Million) Forecast, by Application 2020 & 2033
- Table 44: ASEAN US Digital Freight Management Industry Revenue (Million) Forecast, by Application 2020 & 2033
- Table 45: Oceania US Digital Freight Management Industry Revenue (Million) Forecast, by Application 2020 & 2033
- Table 46: Rest of Asia Pacific US Digital Freight Management Industry Revenue (Million) Forecast, by Application 2020 & 2033
Frequently Asked Questions
1. What is the projected Compound Annual Growth Rate (CAGR) of the US Digital Freight Management Industry?
The projected CAGR is approximately 21.72%.
2. Which companies are prominent players in the US Digital Freight Management Industry?
Key companies in the market include Flexport, Kuehne + Nagel International (KN Freight Net), Uber Freight, Forto, DHL Group, Agility Logistics Pvt Ltd, Expeditors International, InstaFreight, Turvo, iContainers, Twill, NYSHEX, Transporteca, uShip**List Not Exhaustive, Convoy, Kontainers.
3. What are the main segments of the US Digital Freight Management Industry?
The market segments include Mode of Transportation, Firm Type.
4. Can you provide details about the market size?
The market size is estimated to be USD 6.89 Million as of 2022.
5. What are some drivers contributing to market growth?
4.; PHARMACEUTICAL INDUSTRY GROWTH4.; RISING FRESH PRODUCE IMPORTS FROM MEXICO4.; INCREASING POPULARITY OF FROZEN FOODS.
6. What are the notable trends driving market growth?
E- Commerce is driving the market.
7. Are there any restraints impacting market growth?
4.; EMISSIONS FROM COLD CHAIN OPERATIONS4.; LABOUR SHORTAGES.
8. Can you provide examples of recent developments in the market?
October 2022: Transplace and Uber Freight just completed their merger. It will bring all lower-tier carriers together under the banner of "the world's largest network demand platform meeting the world's largest supply platform," enabling them to benefit from the technological advancement necessary to participate in the global network platform.
9. What pricing options are available for accessing the report?
Pricing options include single-user, multi-user, and enterprise licenses priced at USD 3800, USD 4500, and USD 5800 respectively.
10. Is the market size provided in terms of value or volume?
The market size is provided in terms of value, measured in Million.
11. Are there any specific market keywords associated with the report?
Yes, the market keyword associated with the report is "US Digital Freight Management Industry," which aids in identifying and referencing the specific market segment covered.
12. How do I determine which pricing option suits my needs best?
The pricing options vary based on user requirements and access needs. Individual users may opt for single-user licenses, while businesses requiring broader access may choose multi-user or enterprise licenses for cost-effective access to the report.
13. Are there any additional resources or data provided in the US Digital Freight Management Industry report?
While the report offers comprehensive insights, it's advisable to review the specific contents or supplementary materials provided to ascertain if additional resources or data are available.
14. How can I stay updated on further developments or reports in the US Digital Freight Management Industry?
To stay informed about further developments, trends, and reports in the US Digital Freight Management Industry, consider subscribing to industry newsletters, following relevant companies and organizations, or regularly checking reputable industry news sources and publications.
Methodology
Step 1 - Identification of Relevant Samples Size from Population Database


Step 2 - Approaches for Defining Global Market Size (Value, Volume* & Price*)

Note*: In applicable scenarios
Step 3 - Data Sources
Primary Research
- Web Analytics
- Survey Reports
- Research Institute
- Latest Research Reports
- Opinion Leaders
Secondary Research
- Annual Reports
- White Paper
- Latest Press Release
- Industry Association
- Paid Database
- Investor Presentations

Step 4 - Data Triangulation
Involves using different sources of information in order to increase the validity of a study
These sources are likely to be stakeholders in a program - participants, other researchers, program staff, other community members, and so on.
Then we put all data in single framework & apply various statistical tools to find out the dynamic on the market.
During the analysis stage, feedback from the stakeholder groups would be compared to determine areas of agreement as well as areas of divergence