

Key Insights
The global wood pulp market is projected for steady expansion, valued at approximately $166.65 billion in the base year 2025. This growth is driven by escalating demand from vital sectors including packaging and paper manufacturing. The market is forecast to expand at a compound annual growth rate (CAGR) of 2.7% between 2025 and 2033. Key growth drivers include an increasing global population fueling paper product consumption, a significant shift towards sustainable packaging solutions leveraging wood pulp's renewable attributes, and advancements in pulp production technology enhancing efficiency and reducing costs. However, market expansion is tempered by volatile raw material prices, stringent environmental regulations impacting deforestation, and competition from alternative materials such as recycled paper and plastics. Chemical pulp is the dominant segment due to its superior performance characteristics. Packaging remains the primary end-use sector, underscoring wood pulp's essential role in consumer goods and e-commerce. While North America and Europe currently lead market share, the Asia-Pacific region is expected to experience substantial growth, propelled by the expanding economies of China and India. Leading industry players, including Kimberly-Clark, Procter & Gamble, and International Paper, are poised to continue influencing market trends through innovation and strategic acquisitions.
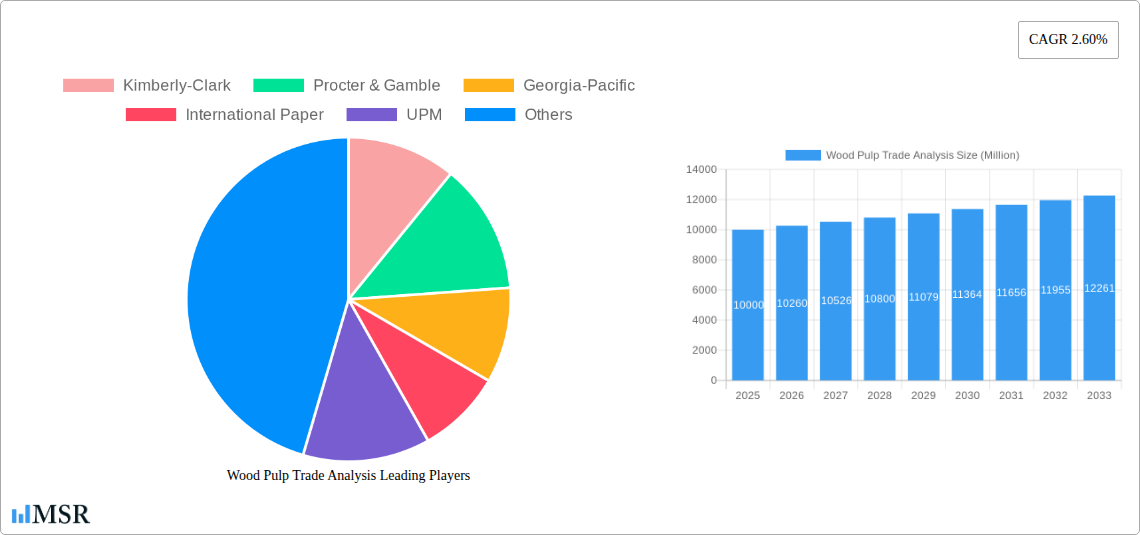
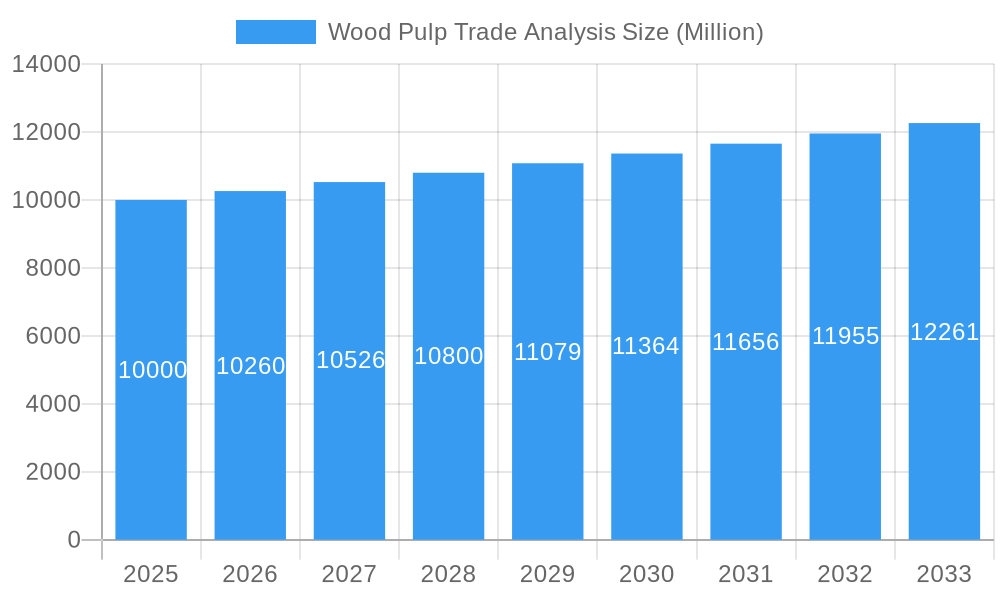
Wood Pulp Trade Analysis Market Size (In Billion)
The competitive environment features a mix of large multinational corporations and smaller regional entities. An increasing emphasis on sustainability and environmental stewardship is revolutionizing industry practices, promoting responsible sourcing and eco-friendly production methods. This heightened environmental awareness influences consumer preferences and regulatory frameworks, fostering the development of innovative, sustainable wood pulp alternatives and manufacturing processes. The forecast period (2025-2033) will likely see a continued pursuit of market share, with companies focusing on product quality, sustainability initiatives, and efficient supply chains. The market's overall outlook is positive, though navigating this competitive landscape successfully will necessitate careful consideration of restraining factors and evolving market dynamics.
Wood Pulp Trade Analysis Company Market Share
Wood Pulp Trade Analysis: 2019-2033 Market Forecast
This comprehensive report provides a detailed analysis of the wood pulp trade market, offering invaluable insights for industry stakeholders. With a focus on key segments like chemical pulp, mechanical pulp, and dissolving pulp, and end-use industries including packaging, paper manufacturing, and textiles, this report forecasts market trends from 2025 to 2033. The study covers the historical period (2019-2024), using 2025 as the base year, and examines the impact of major players like Kimberly-Clark, Procter & Gamble, Georgia-Pacific, International Paper, and UPM. The report quantifies market size in Millions and assesses market growth using compound annual growth rates (CAGR). This in-depth analysis is essential for strategic decision-making within the wood pulp industry.
Wood Pulp Trade Analysis Market Concentration & Dynamics
The wood pulp market exhibits moderate concentration, with a few major players commanding significant market share. The global market share for the top five companies is estimated at xx%. This concentration is influenced by economies of scale, technological advancements, and access to raw materials. Innovation within the industry focuses on enhancing pulp properties for specific applications, such as improved strength and printability. Regulatory frameworks, particularly those related to environmental sustainability and forest management, significantly impact the industry. Substitute products, such as recycled fibers and alternative materials, are gaining traction, but the inherent properties of wood pulp, such as strength and versatility, maintain its dominance. End-user trends, particularly the growth in e-commerce and the packaging sector, drive demand for wood pulp. M&A activity in the sector has been moderate in recent years, with xx deals recorded between 2019 and 2024.
- Market Share: Top 5 companies – xx% (estimated)
- M&A Deal Count (2019-2024): xx
- Key Regulatory Factors: Environmental regulations, forest management policies
- Substitute Products: Recycled fibers, alternative materials
Wood Pulp Trade Analysis Industry Insights & Trends
The global wood pulp market is projected to experience significant growth during the forecast period (2025-2033), with a CAGR of xx%. This growth is primarily driven by the increasing demand for packaging materials fueled by the expansion of the e-commerce sector, rising consumption of packaged goods, and growth in emerging economies. Technological disruptions, such as the adoption of advanced pulping technologies and improved process efficiency, are further contributing to market expansion. Evolving consumer behaviors, with a growing emphasis on sustainable and eco-friendly products, are also shaping industry dynamics. The global market size in 2025 is estimated to be $xx Million, expanding to $xx Million by 2033. The shift towards sustainable packaging solutions is a key trend, with companies investing in innovative and eco-friendly pulp production methods. This shift impacts consumer purchasing decisions and influences packaging design.
Key Markets & Segments Leading Wood Pulp Trade Analysis
The packaging segment dominates the wood pulp end-use industry, driven by the rapid growth of e-commerce and the rising demand for consumer goods. Within product types, Chemical Pulp holds the largest market share, due to its superior properties and versatility. Geographically, the Asia-Pacific region is expected to experience the highest growth rate in the forecast period.
- Dominant Segment: Packaging (End-Use) and Chemical Pulp (Product Type)
- Dominant Region: Asia-Pacific
- Drivers for Asia-Pacific Growth:
- Rapid economic growth
- Expanding middle class
- Increasing urbanization and industrialization
- Growing e-commerce sector
The dominance of the packaging segment is attributed to its versatile applications across various industries. The superior properties of chemical pulp, including its strength, softness, and printability, drive its substantial market share in comparison to mechanical and dissolving pulp. The Asia-Pacific region's robust economic growth, burgeoning population, and rising consumer spending fuel the high growth rate projected in this region. The rising demand for paper-based packaging solutions from emerging economies like India and China are key contributors to this dynamic.
Wood Pulp Trade Analysis Product Developments
Recent innovations in wood pulp technology focus on enhancing fiber properties for specific applications, leading to improved strength, brightness, and printability. This includes the development of new pulping processes and the utilization of advanced bleaching technologies. The focus on sustainability has driven the development of wood pulp produced from responsibly managed forests. These advancements provide a competitive edge to manufacturers by offering improved product quality and environmental responsibility.
Challenges in the Wood Pulp Trade Analysis Market
The wood pulp market faces challenges including increasing raw material costs, fluctuating energy prices, and intense competition. Stringent environmental regulations add to the operational costs. Supply chain disruptions, particularly in the wake of recent global events, have led to price volatility and impacted production. Furthermore, the availability of skilled labor and maintaining efficient operations within a competitive global market remain ongoing concerns for many market players. These factors combined estimate an impact of xx% on overall profitability.
Forces Driving Wood Pulp Trade Analysis Growth
The increasing demand for packaging, particularly in emerging markets, is a key growth driver. Technological advancements in pulping and bleaching processes are enhancing pulp quality and efficiency, while sustainable forestry practices contribute to environmental responsibility and long-term growth. Government policies promoting sustainable development and investment in infrastructure also stimulate market growth.
Challenges in the Wood Pulp Trade Analysis Market
Long-term growth hinges on innovation in sustainable pulping technologies, strategic partnerships to secure raw material supply chains, and expanding into high-growth markets. Investments in research and development will drive the creation of new, high-value products, maintaining the sector's competitiveness.
Emerging Opportunities in Wood Pulp Trade Analysis
Emerging opportunities lie in developing new applications for wood pulp, including biodegradable packaging materials and advanced composites. The growing emphasis on sustainability presents opportunities for eco-friendly pulp production and utilization. Expansion into new markets, particularly in developing economies, offers significant growth potential.
Leading Players in the Wood Pulp Trade Analysis Sector
Key Milestones in Wood Pulp Trade Analysis Industry
- April 2022: ICRA report highlights a paradigm shift in the Indian paper industry, with declining demand for newsprint and printing papers but significant growth in packaging paper due to e-commerce and other sectors.
- December 2022: IIT Roorkee and Shah Paper Mills Limited launch a project to develop an advanced packaging research laboratory and skill development program, fostering innovation and collaboration within the Indian paper industry.
Strategic Outlook for Wood Pulp Trade Analysis Market
The wood pulp market is poised for continued growth, driven by strong demand from various end-use sectors. Strategic opportunities include focusing on sustainable and innovative products, optimizing supply chains, and expanding into new geographical markets. Companies that prioritize sustainability and technological advancements are expected to gain a competitive advantage in the long term.
Wood Pulp Trade Analysis Segmentation
- 1. Production Analysis
- 2. Consumption Analysis
- 3. Import Market Analysis (Value & Volume)
- 4. Export Market Analysis (Value & Volume)
- 5. Price Trend Analysis
Wood Pulp Trade Analysis Segmentation By Geography
-
1. North America
- 1.1. United States
- 1.2. Canada
- 1.3. Mexico
-
2. Europe
- 2.1. Germany
- 2.2. United Kingdom
- 2.3. Italy
- 2.4. France
- 2.5. Netherlands
- 2.6. Sweden
- 2.7. Russia
-
3. Asia Pacific
- 3.1. China
- 3.2. Australia
- 3.3. India
- 3.4. South Korea
- 3.5. Japan
- 3.6. Indonesia
-
4. South America
- 4.1. Brazil
- 4.2. Chile
-
5. Africa
- 5.1. South Africa
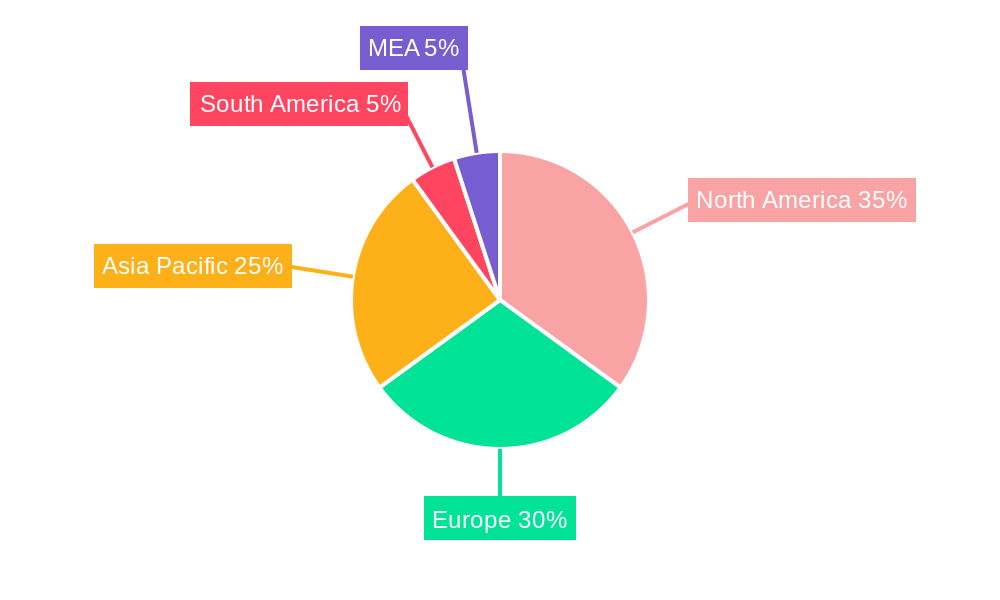
Wood Pulp Trade Analysis Regional Market Share
Geographic Coverage of Wood Pulp Trade Analysis
Wood Pulp Trade Analysis REPORT HIGHLIGHTS
| Aspects | Details |
|---|---|
| Study Period | 2020-2034 |
| Base Year | 2025 |
| Estimated Year | 2026 |
| Forecast Period | 2026-2034 |
| Historical Period | 2020-2025 |
| Growth Rate | CAGR of 2.7% from 2020-2034 |
| Segmentation |
|
Table of Contents
- 1. Introduction
- 1.1. Research Scope
- 1.2. Market Segmentation
- 1.3. Research Objective
- 1.4. Definitions and Assumptions
- 2. Executive Summary
- 2.1. Market Snapshot
- 3. Market Dynamics
- 3.1. Market Drivers
- 3.2. Market Restrains
- 3.3. Market Trends
- 3.4. Market Opportunities
- 4. Market Factor Analysis
- 4.1. Porters Five Forces
- 4.1.1. Bargaining Power of Suppliers
- 4.1.2. Bargaining Power of Buyers
- 4.1.3. Threat of New Entrants
- 4.1.4. Threat of Substitutes
- 4.1.5. Competitive Rivalry
- 4.2. PESTEL analysis
- 4.3. BCG Analysis
- 4.3.1. Stars (High Growth, High Market Share)
- 4.3.2. Cash Cows (Low Growth, High Market Share)
- 4.3.3. Question Mark (High Growth, Low Market Share)
- 4.3.4. Dogs (Low Growth, Low Market Share)
- 4.4. Ansoff Matrix Analysis
- 4.5. Supply Chain Analysis
- 4.6. Regulatory Landscape
- 4.7. Current Market Potential and Opportunity Assessment (TAM–SAM–SOM Framework)
- 4.8. MSR Analyst Note
- 4.1. Porters Five Forces
- 5. Market Analysis, Insights and Forecast 2021-2033
- 5.1. Market Analysis, Insights and Forecast - by Production Analysis
- 5.2. Market Analysis, Insights and Forecast - by Consumption Analysis
- 5.3. Market Analysis, Insights and Forecast - by Import Market Analysis (Value & Volume)
- 5.4. Market Analysis, Insights and Forecast - by Export Market Analysis (Value & Volume)
- 5.5. Market Analysis, Insights and Forecast - by Price Trend Analysis
- 5.6. Market Analysis, Insights and Forecast - by Region
- 5.6.1. North America
- 5.6.2. Europe
- 5.6.3. Asia Pacific
- 5.6.4. South America
- 5.6.5. Africa
- 6. Global Wood Pulp Trade Analysis Analysis, Insights and Forecast, 2021-2033
- 6.1. Market Analysis, Insights and Forecast - by Production Analysis
- 6.2. Market Analysis, Insights and Forecast - by Consumption Analysis
- 6.3. Market Analysis, Insights and Forecast - by Import Market Analysis (Value & Volume)
- 6.4. Market Analysis, Insights and Forecast - by Export Market Analysis (Value & Volume)
- 6.5. Market Analysis, Insights and Forecast - by Price Trend Analysis
- 7. North America Wood Pulp Trade Analysis Analysis, Insights and Forecast, 2020-2032
- 7.1. Market Analysis, Insights and Forecast - by Production Analysis
- 7.2. Market Analysis, Insights and Forecast - by Consumption Analysis
- 7.3. Market Analysis, Insights and Forecast - by Import Market Analysis (Value & Volume)
- 7.4. Market Analysis, Insights and Forecast - by Export Market Analysis (Value & Volume)
- 7.5. Market Analysis, Insights and Forecast - by Price Trend Analysis
- 8. Europe Wood Pulp Trade Analysis Analysis, Insights and Forecast, 2020-2032
- 8.1. Market Analysis, Insights and Forecast - by Production Analysis
- 8.2. Market Analysis, Insights and Forecast - by Consumption Analysis
- 8.3. Market Analysis, Insights and Forecast - by Import Market Analysis (Value & Volume)
- 8.4. Market Analysis, Insights and Forecast - by Export Market Analysis (Value & Volume)
- 8.5. Market Analysis, Insights and Forecast - by Price Trend Analysis
- 9. Asia Pacific Wood Pulp Trade Analysis Analysis, Insights and Forecast, 2020-2032
- 9.1. Market Analysis, Insights and Forecast - by Production Analysis
- 9.2. Market Analysis, Insights and Forecast - by Consumption Analysis
- 9.3. Market Analysis, Insights and Forecast - by Import Market Analysis (Value & Volume)
- 9.4. Market Analysis, Insights and Forecast - by Export Market Analysis (Value & Volume)
- 9.5. Market Analysis, Insights and Forecast - by Price Trend Analysis
- 10. South America Wood Pulp Trade Analysis Analysis, Insights and Forecast, 2020-2032
- 10.1. Market Analysis, Insights and Forecast - by Production Analysis
- 10.2. Market Analysis, Insights and Forecast - by Consumption Analysis
- 10.3. Market Analysis, Insights and Forecast - by Import Market Analysis (Value & Volume)
- 10.4. Market Analysis, Insights and Forecast - by Export Market Analysis (Value & Volume)
- 10.5. Market Analysis, Insights and Forecast - by Price Trend Analysis
- 11. Africa Wood Pulp Trade Analysis Analysis, Insights and Forecast, 2020-2032
- 11.1. Market Analysis, Insights and Forecast - by Production Analysis
- 11.2. Market Analysis, Insights and Forecast - by Consumption Analysis
- 11.3. Market Analysis, Insights and Forecast - by Import Market Analysis (Value & Volume)
- 11.4. Market Analysis, Insights and Forecast - by Export Market Analysis (Value & Volume)
- 11.5. Market Analysis, Insights and Forecast - by Price Trend Analysis
- 12. Competitive Analysis
- 12.1. Company Profiles
- 12.1.1 Kimberly-Clark
- 12.1.1.1. Company Overview
- 12.1.1.2. Products
- 12.1.1.3. Company Financials
- 12.1.1.4. SWOT Analysis
- 12.1.2 Procter & Gamble
- 12.1.2.1. Company Overview
- 12.1.2.2. Products
- 12.1.2.3. Company Financials
- 12.1.2.4. SWOT Analysis
- 12.1.3 Georgia-Pacific
- 12.1.3.1. Company Overview
- 12.1.3.2. Products
- 12.1.3.3. Company Financials
- 12.1.3.4. SWOT Analysis
- 12.1.4 International Paper
- 12.1.4.1. Company Overview
- 12.1.4.2. Products
- 12.1.4.3. Company Financials
- 12.1.4.4. SWOT Analysis
- 12.1.5 UPM
- 12.1.5.1. Company Overview
- 12.1.5.2. Products
- 12.1.5.3. Company Financials
- 12.1.5.4. SWOT Analysis
- 12.1.1 Kimberly-Clark
- 12.2. Market Entropy
- 12.2.1 Company's Key Areas Served
- 12.2.2 Recent Developments
- 12.3. Company Market Share Analysis 2025
- 12.3.1 Top 5 Companies Market Share Analysis
- 12.3.2 Top 3 Companies Market Share Analysis
- 12.4. List of Potential Customers
- 13. Research Methodology
List of Figures
- Figure 1: Global Wood Pulp Trade Analysis Revenue Breakdown (billion, %) by Region 2025 & 2033
- Figure 2: North America Wood Pulp Trade Analysis Revenue (billion), by Production Analysis 2025 & 2033
- Figure 3: North America Wood Pulp Trade Analysis Revenue Share (%), by Production Analysis 2025 & 2033
- Figure 4: North America Wood Pulp Trade Analysis Revenue (billion), by Consumption Analysis 2025 & 2033
- Figure 5: North America Wood Pulp Trade Analysis Revenue Share (%), by Consumption Analysis 2025 & 2033
- Figure 6: North America Wood Pulp Trade Analysis Revenue (billion), by Import Market Analysis (Value & Volume) 2025 & 2033
- Figure 7: North America Wood Pulp Trade Analysis Revenue Share (%), by Import Market Analysis (Value & Volume) 2025 & 2033
- Figure 8: North America Wood Pulp Trade Analysis Revenue (billion), by Export Market Analysis (Value & Volume) 2025 & 2033
- Figure 9: North America Wood Pulp Trade Analysis Revenue Share (%), by Export Market Analysis (Value & Volume) 2025 & 2033
- Figure 10: North America Wood Pulp Trade Analysis Revenue (billion), by Price Trend Analysis 2025 & 2033
- Figure 11: North America Wood Pulp Trade Analysis Revenue Share (%), by Price Trend Analysis 2025 & 2033
- Figure 12: North America Wood Pulp Trade Analysis Revenue (billion), by Country 2025 & 2033
- Figure 13: North America Wood Pulp Trade Analysis Revenue Share (%), by Country 2025 & 2033
- Figure 14: Europe Wood Pulp Trade Analysis Revenue (billion), by Production Analysis 2025 & 2033
- Figure 15: Europe Wood Pulp Trade Analysis Revenue Share (%), by Production Analysis 2025 & 2033
- Figure 16: Europe Wood Pulp Trade Analysis Revenue (billion), by Consumption Analysis 2025 & 2033
- Figure 17: Europe Wood Pulp Trade Analysis Revenue Share (%), by Consumption Analysis 2025 & 2033
- Figure 18: Europe Wood Pulp Trade Analysis Revenue (billion), by Import Market Analysis (Value & Volume) 2025 & 2033
- Figure 19: Europe Wood Pulp Trade Analysis Revenue Share (%), by Import Market Analysis (Value & Volume) 2025 & 2033
- Figure 20: Europe Wood Pulp Trade Analysis Revenue (billion), by Export Market Analysis (Value & Volume) 2025 & 2033
- Figure 21: Europe Wood Pulp Trade Analysis Revenue Share (%), by Export Market Analysis (Value & Volume) 2025 & 2033
- Figure 22: Europe Wood Pulp Trade Analysis Revenue (billion), by Price Trend Analysis 2025 & 2033
- Figure 23: Europe Wood Pulp Trade Analysis Revenue Share (%), by Price Trend Analysis 2025 & 2033
- Figure 24: Europe Wood Pulp Trade Analysis Revenue (billion), by Country 2025 & 2033
- Figure 25: Europe Wood Pulp Trade Analysis Revenue Share (%), by Country 2025 & 2033
- Figure 26: Asia Pacific Wood Pulp Trade Analysis Revenue (billion), by Production Analysis 2025 & 2033
- Figure 27: Asia Pacific Wood Pulp Trade Analysis Revenue Share (%), by Production Analysis 2025 & 2033
- Figure 28: Asia Pacific Wood Pulp Trade Analysis Revenue (billion), by Consumption Analysis 2025 & 2033
- Figure 29: Asia Pacific Wood Pulp Trade Analysis Revenue Share (%), by Consumption Analysis 2025 & 2033
- Figure 30: Asia Pacific Wood Pulp Trade Analysis Revenue (billion), by Import Market Analysis (Value & Volume) 2025 & 2033
- Figure 31: Asia Pacific Wood Pulp Trade Analysis Revenue Share (%), by Import Market Analysis (Value & Volume) 2025 & 2033
- Figure 32: Asia Pacific Wood Pulp Trade Analysis Revenue (billion), by Export Market Analysis (Value & Volume) 2025 & 2033
- Figure 33: Asia Pacific Wood Pulp Trade Analysis Revenue Share (%), by Export Market Analysis (Value & Volume) 2025 & 2033
- Figure 34: Asia Pacific Wood Pulp Trade Analysis Revenue (billion), by Price Trend Analysis 2025 & 2033
- Figure 35: Asia Pacific Wood Pulp Trade Analysis Revenue Share (%), by Price Trend Analysis 2025 & 2033
- Figure 36: Asia Pacific Wood Pulp Trade Analysis Revenue (billion), by Country 2025 & 2033
- Figure 37: Asia Pacific Wood Pulp Trade Analysis Revenue Share (%), by Country 2025 & 2033
- Figure 38: South America Wood Pulp Trade Analysis Revenue (billion), by Production Analysis 2025 & 2033
- Figure 39: South America Wood Pulp Trade Analysis Revenue Share (%), by Production Analysis 2025 & 2033
- Figure 40: South America Wood Pulp Trade Analysis Revenue (billion), by Consumption Analysis 2025 & 2033
- Figure 41: South America Wood Pulp Trade Analysis Revenue Share (%), by Consumption Analysis 2025 & 2033
- Figure 42: South America Wood Pulp Trade Analysis Revenue (billion), by Import Market Analysis (Value & Volume) 2025 & 2033
- Figure 43: South America Wood Pulp Trade Analysis Revenue Share (%), by Import Market Analysis (Value & Volume) 2025 & 2033
- Figure 44: South America Wood Pulp Trade Analysis Revenue (billion), by Export Market Analysis (Value & Volume) 2025 & 2033
- Figure 45: South America Wood Pulp Trade Analysis Revenue Share (%), by Export Market Analysis (Value & Volume) 2025 & 2033
- Figure 46: South America Wood Pulp Trade Analysis Revenue (billion), by Price Trend Analysis 2025 & 2033
- Figure 47: South America Wood Pulp Trade Analysis Revenue Share (%), by Price Trend Analysis 2025 & 2033
- Figure 48: South America Wood Pulp Trade Analysis Revenue (billion), by Country 2025 & 2033
- Figure 49: South America Wood Pulp Trade Analysis Revenue Share (%), by Country 2025 & 2033
- Figure 50: Africa Wood Pulp Trade Analysis Revenue (billion), by Production Analysis 2025 & 2033
- Figure 51: Africa Wood Pulp Trade Analysis Revenue Share (%), by Production Analysis 2025 & 2033
- Figure 52: Africa Wood Pulp Trade Analysis Revenue (billion), by Consumption Analysis 2025 & 2033
- Figure 53: Africa Wood Pulp Trade Analysis Revenue Share (%), by Consumption Analysis 2025 & 2033
- Figure 54: Africa Wood Pulp Trade Analysis Revenue (billion), by Import Market Analysis (Value & Volume) 2025 & 2033
- Figure 55: Africa Wood Pulp Trade Analysis Revenue Share (%), by Import Market Analysis (Value & Volume) 2025 & 2033
- Figure 56: Africa Wood Pulp Trade Analysis Revenue (billion), by Export Market Analysis (Value & Volume) 2025 & 2033
- Figure 57: Africa Wood Pulp Trade Analysis Revenue Share (%), by Export Market Analysis (Value & Volume) 2025 & 2033
- Figure 58: Africa Wood Pulp Trade Analysis Revenue (billion), by Price Trend Analysis 2025 & 2033
- Figure 59: Africa Wood Pulp Trade Analysis Revenue Share (%), by Price Trend Analysis 2025 & 2033
- Figure 60: Africa Wood Pulp Trade Analysis Revenue (billion), by Country 2025 & 2033
- Figure 61: Africa Wood Pulp Trade Analysis Revenue Share (%), by Country 2025 & 2033
List of Tables
- Table 1: Global Wood Pulp Trade Analysis Revenue billion Forecast, by Production Analysis 2020 & 2033
- Table 2: Global Wood Pulp Trade Analysis Revenue billion Forecast, by Consumption Analysis 2020 & 2033
- Table 3: Global Wood Pulp Trade Analysis Revenue billion Forecast, by Import Market Analysis (Value & Volume) 2020 & 2033
- Table 4: Global Wood Pulp Trade Analysis Revenue billion Forecast, by Export Market Analysis (Value & Volume) 2020 & 2033
- Table 5: Global Wood Pulp Trade Analysis Revenue billion Forecast, by Price Trend Analysis 2020 & 2033
- Table 6: Global Wood Pulp Trade Analysis Revenue billion Forecast, by Region 2020 & 2033
- Table 7: Global Wood Pulp Trade Analysis Revenue billion Forecast, by Production Analysis 2020 & 2033
- Table 8: Global Wood Pulp Trade Analysis Revenue billion Forecast, by Consumption Analysis 2020 & 2033
- Table 9: Global Wood Pulp Trade Analysis Revenue billion Forecast, by Import Market Analysis (Value & Volume) 2020 & 2033
- Table 10: Global Wood Pulp Trade Analysis Revenue billion Forecast, by Export Market Analysis (Value & Volume) 2020 & 2033
- Table 11: Global Wood Pulp Trade Analysis Revenue billion Forecast, by Price Trend Analysis 2020 & 2033
- Table 12: Global Wood Pulp Trade Analysis Revenue billion Forecast, by Country 2020 & 2033
- Table 13: United States Wood Pulp Trade Analysis Revenue (billion) Forecast, by Application 2020 & 2033
- Table 14: Canada Wood Pulp Trade Analysis Revenue (billion) Forecast, by Application 2020 & 2033
- Table 15: Mexico Wood Pulp Trade Analysis Revenue (billion) Forecast, by Application 2020 & 2033
- Table 16: Global Wood Pulp Trade Analysis Revenue billion Forecast, by Production Analysis 2020 & 2033
- Table 17: Global Wood Pulp Trade Analysis Revenue billion Forecast, by Consumption Analysis 2020 & 2033
- Table 18: Global Wood Pulp Trade Analysis Revenue billion Forecast, by Import Market Analysis (Value & Volume) 2020 & 2033
- Table 19: Global Wood Pulp Trade Analysis Revenue billion Forecast, by Export Market Analysis (Value & Volume) 2020 & 2033
- Table 20: Global Wood Pulp Trade Analysis Revenue billion Forecast, by Price Trend Analysis 2020 & 2033
- Table 21: Global Wood Pulp Trade Analysis Revenue billion Forecast, by Country 2020 & 2033
- Table 22: Germany Wood Pulp Trade Analysis Revenue (billion) Forecast, by Application 2020 & 2033
- Table 23: United Kingdom Wood Pulp Trade Analysis Revenue (billion) Forecast, by Application 2020 & 2033
- Table 24: Italy Wood Pulp Trade Analysis Revenue (billion) Forecast, by Application 2020 & 2033
- Table 25: France Wood Pulp Trade Analysis Revenue (billion) Forecast, by Application 2020 & 2033
- Table 26: Netherlands Wood Pulp Trade Analysis Revenue (billion) Forecast, by Application 2020 & 2033
- Table 27: Sweden Wood Pulp Trade Analysis Revenue (billion) Forecast, by Application 2020 & 2033
- Table 28: Russia Wood Pulp Trade Analysis Revenue (billion) Forecast, by Application 2020 & 2033
- Table 29: Global Wood Pulp Trade Analysis Revenue billion Forecast, by Production Analysis 2020 & 2033
- Table 30: Global Wood Pulp Trade Analysis Revenue billion Forecast, by Consumption Analysis 2020 & 2033
- Table 31: Global Wood Pulp Trade Analysis Revenue billion Forecast, by Import Market Analysis (Value & Volume) 2020 & 2033
- Table 32: Global Wood Pulp Trade Analysis Revenue billion Forecast, by Export Market Analysis (Value & Volume) 2020 & 2033
- Table 33: Global Wood Pulp Trade Analysis Revenue billion Forecast, by Price Trend Analysis 2020 & 2033
- Table 34: Global Wood Pulp Trade Analysis Revenue billion Forecast, by Country 2020 & 2033
- Table 35: China Wood Pulp Trade Analysis Revenue (billion) Forecast, by Application 2020 & 2033
- Table 36: Australia Wood Pulp Trade Analysis Revenue (billion) Forecast, by Application 2020 & 2033
- Table 37: India Wood Pulp Trade Analysis Revenue (billion) Forecast, by Application 2020 & 2033
- Table 38: South Korea Wood Pulp Trade Analysis Revenue (billion) Forecast, by Application 2020 & 2033
- Table 39: Japan Wood Pulp Trade Analysis Revenue (billion) Forecast, by Application 2020 & 2033
- Table 40: Indonesia Wood Pulp Trade Analysis Revenue (billion) Forecast, by Application 2020 & 2033
- Table 41: Global Wood Pulp Trade Analysis Revenue billion Forecast, by Production Analysis 2020 & 2033
- Table 42: Global Wood Pulp Trade Analysis Revenue billion Forecast, by Consumption Analysis 2020 & 2033
- Table 43: Global Wood Pulp Trade Analysis Revenue billion Forecast, by Import Market Analysis (Value & Volume) 2020 & 2033
- Table 44: Global Wood Pulp Trade Analysis Revenue billion Forecast, by Export Market Analysis (Value & Volume) 2020 & 2033
- Table 45: Global Wood Pulp Trade Analysis Revenue billion Forecast, by Price Trend Analysis 2020 & 2033
- Table 46: Global Wood Pulp Trade Analysis Revenue billion Forecast, by Country 2020 & 2033
- Table 47: Brazil Wood Pulp Trade Analysis Revenue (billion) Forecast, by Application 2020 & 2033
- Table 48: Chile Wood Pulp Trade Analysis Revenue (billion) Forecast, by Application 2020 & 2033
- Table 49: Global Wood Pulp Trade Analysis Revenue billion Forecast, by Production Analysis 2020 & 2033
- Table 50: Global Wood Pulp Trade Analysis Revenue billion Forecast, by Consumption Analysis 2020 & 2033
- Table 51: Global Wood Pulp Trade Analysis Revenue billion Forecast, by Import Market Analysis (Value & Volume) 2020 & 2033
- Table 52: Global Wood Pulp Trade Analysis Revenue billion Forecast, by Export Market Analysis (Value & Volume) 2020 & 2033
- Table 53: Global Wood Pulp Trade Analysis Revenue billion Forecast, by Price Trend Analysis 2020 & 2033
- Table 54: Global Wood Pulp Trade Analysis Revenue billion Forecast, by Country 2020 & 2033
- Table 55: South Africa Wood Pulp Trade Analysis Revenue (billion) Forecast, by Application 2020 & 2033
Frequently Asked Questions
1. What is the projected Compound Annual Growth Rate (CAGR) of the Wood Pulp Trade Analysis?
The projected CAGR is approximately 2.7%.
2. Which companies are prominent players in the Wood Pulp Trade Analysis?
Key companies in the market include Kimberly-Clark , Procter & Gamble , Georgia-Pacific, International Paper , UPM .
3. What are the main segments of the Wood Pulp Trade Analysis?
The market segments include Production Analysis, Consumption Analysis, Import Market Analysis (Value & Volume), Export Market Analysis (Value & Volume), Price Trend Analysis.
4. Can you provide details about the market size?
The market size is estimated to be USD 166.65 billion as of 2022.
5. What are some drivers contributing to market growth?
; Increasing Food Security Concerns; Inclination Toward a Healthy Lifestyle.
6. What are the notable trends driving market growth?
Huge Demand in Packaging and Industrial Papers.
7. Are there any restraints impacting market growth?
; Unfavorable Climatic Conditions; Higher Market Entry Cost.
8. Can you provide examples of recent developments in the market?
December 2022: The Indian Institute of Technology (IIT) Roorkee, in association with Shah Paper Mills Limited, launched a new project to develop the advanced packaging research laboratory and skill development program at the Department of Paper Technology, Saharanpur Campus. The institute has been fostering collaboration with paper industries from India, focusing on providing cutting-edge innovation research and skill development globally.
9. What pricing options are available for accessing the report?
Pricing options include single-user, multi-user, and enterprise licenses priced at USD 4750, USD 5250, and USD 8750 respectively.
10. Is the market size provided in terms of value or volume?
The market size is provided in terms of value, measured in billion.
11. Are there any specific market keywords associated with the report?
Yes, the market keyword associated with the report is "Wood Pulp Trade Analysis," which aids in identifying and referencing the specific market segment covered.
12. How do I determine which pricing option suits my needs best?
The pricing options vary based on user requirements and access needs. Individual users may opt for single-user licenses, while businesses requiring broader access may choose multi-user or enterprise licenses for cost-effective access to the report.
13. Are there any additional resources or data provided in the Wood Pulp Trade Analysis report?
While the report offers comprehensive insights, it's advisable to review the specific contents or supplementary materials provided to ascertain if additional resources or data are available.
14. How can I stay updated on further developments or reports in the Wood Pulp Trade Analysis?
To stay informed about further developments, trends, and reports in the Wood Pulp Trade Analysis, consider subscribing to industry newsletters, following relevant companies and organizations, or regularly checking reputable industry news sources and publications.
Methodology
Step 1 - Identification of Relevant Samples Size from Population Database


Step 2 - Approaches for Defining Global Market Size (Value, Volume* & Price*)

Note*: In applicable scenarios
Step 3 - Data Sources
Primary Research
- Web Analytics
- Survey Reports
- Research Institute
- Latest Research Reports
- Opinion Leaders
Secondary Research
- Annual Reports
- White Paper
- Latest Press Release
- Industry Association
- Paid Database
- Investor Presentations

Step 4 - Data Triangulation
Involves using different sources of information in order to increase the validity of a study
These sources are likely to be stakeholders in a program - participants, other researchers, program staff, other community members, and so on.
Then we put all data in single framework & apply various statistical tools to find out the dynamic on the market.
During the analysis stage, feedback from the stakeholder groups would be compared to determine areas of agreement as well as areas of divergence