

Key Insights
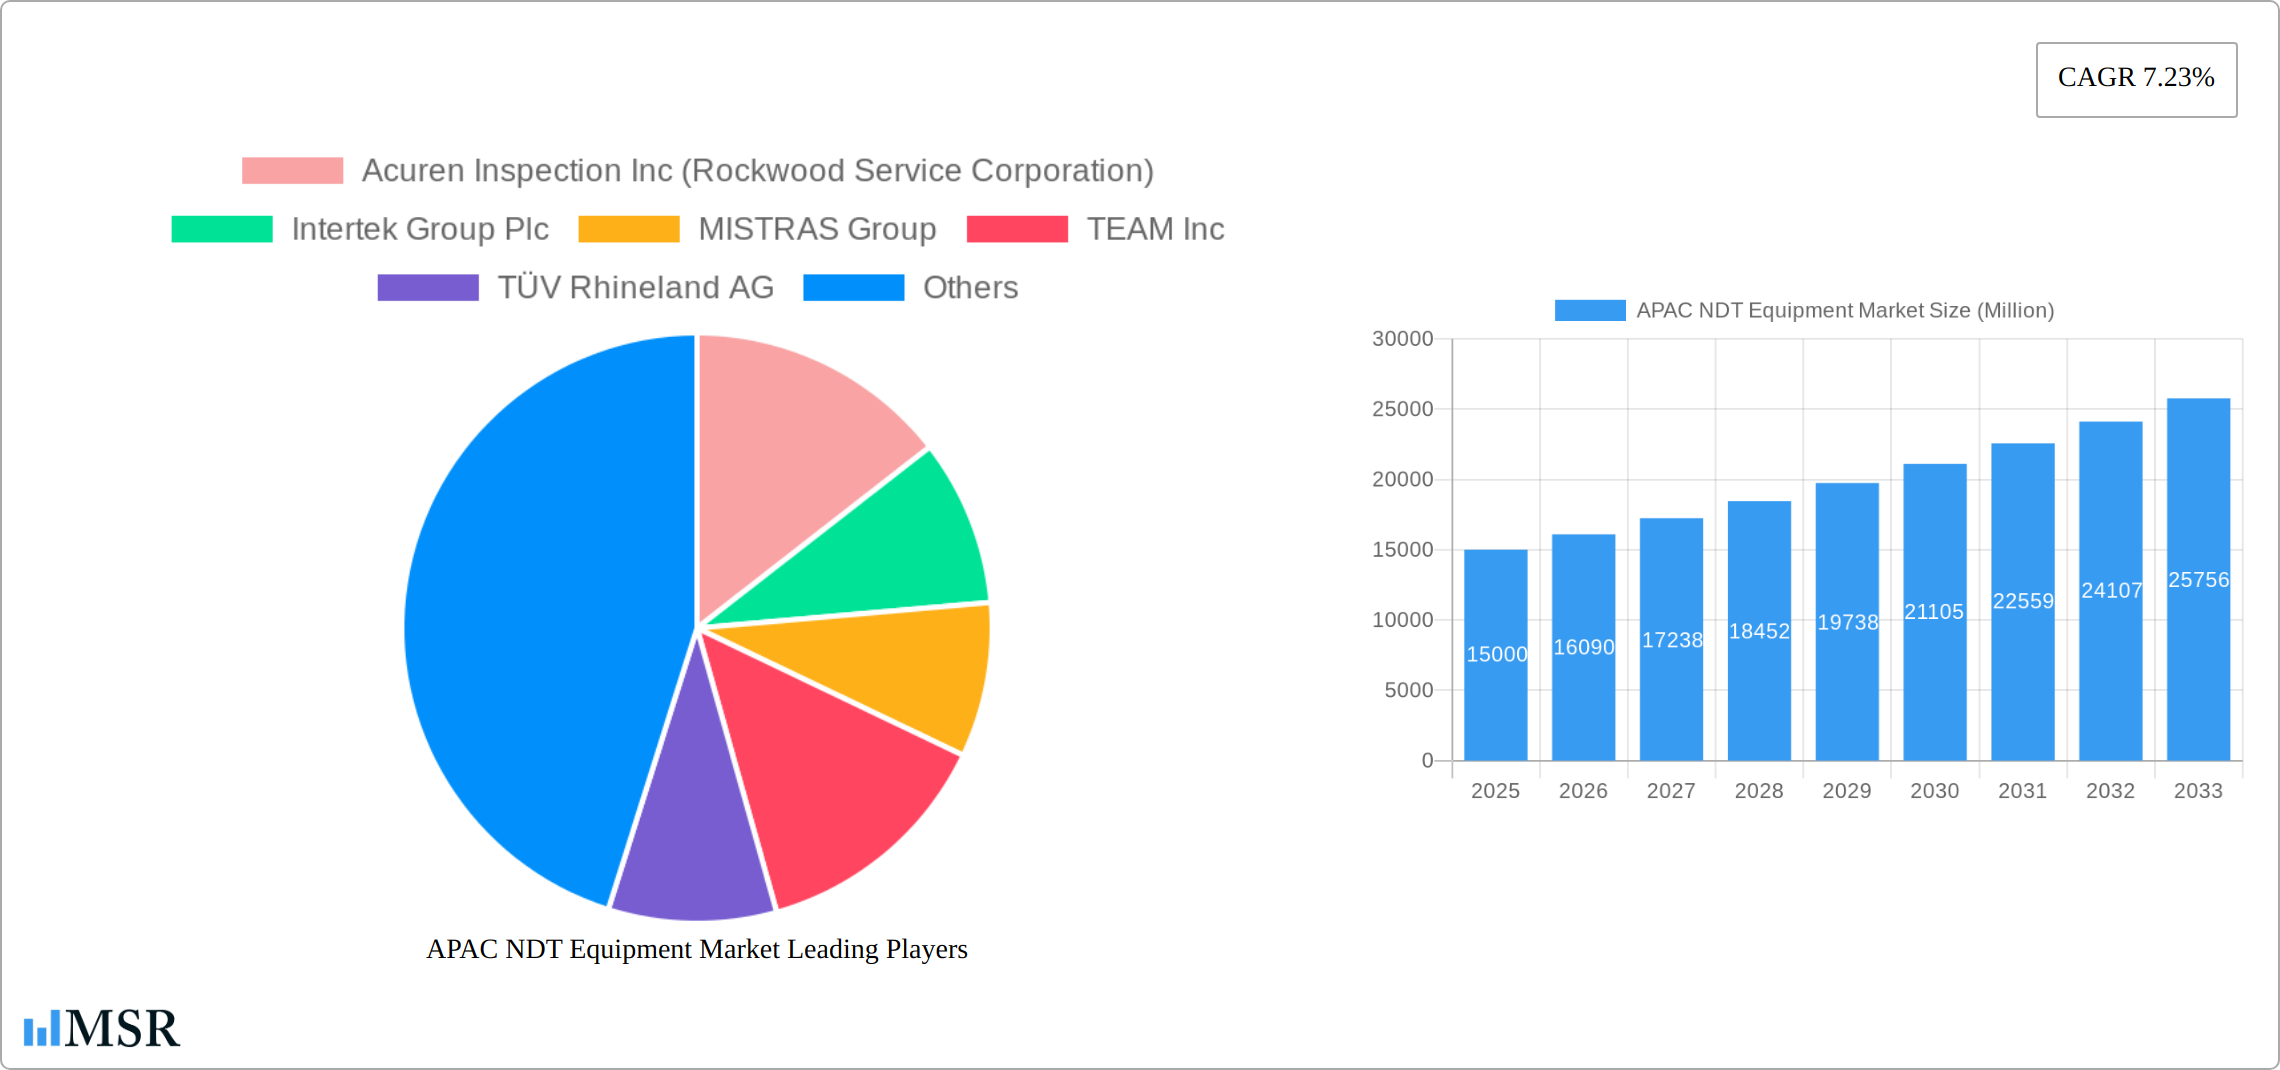
The Asia-Pacific (APAC) Non-Destructive Testing (NDT) equipment market is projected for significant expansion, estimated at 5 billion by 2025, with a Compound Annual Growth Rate (CAGR) of 7.23% from the base year 2025. This growth is propelled by escalating infrastructure development, rigorous quality control mandates across diverse industries, and the increasing adoption of advanced testing technologies. Key drivers include the region's substantial manufacturing output, particularly in China, Japan, South Korea, and India, which necessitates reliable NDT solutions for product integrity and safety. Emerging trends such as the burgeoning automotive and aerospace sectors, expansion in renewable energy projects, and advancements in oil and gas infrastructure are further stimulating demand. Magnetic Particle Testing and Eddy Current Testing are expected to lead technology segments due to their widespread applicability and economic efficiency. While initial investment costs and potential skill gaps present challenges, government initiatives supporting industrial growth and NDT technological advancements bolster a positive market outlook.
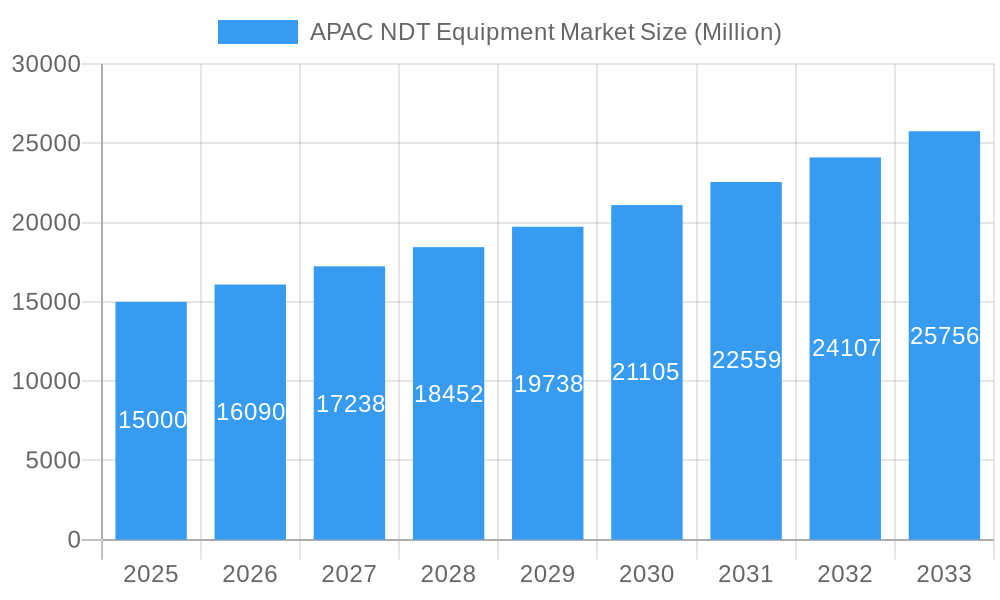
APAC NDT Equipment Market Market Size (In Billion)
China and India are pivotal markets within APAC, driven by their extensive industrial bases and ongoing infrastructure projects. Japan and South Korea contribute through advanced manufacturing and NDT innovation. The market is segmented by technology, including Radiography, Ultrasonic, Magnetic Particle, Liquid Penetrant, Visual, Eddy Current, and others, and by end-user industries such as Oil & Gas, Power & Energy, Construction, Automotive & Transportation, Aerospace & Defense, and more. The competitive environment features both global leaders and regional manufacturers, fostering dynamic pricing and technological innovation. Future growth will likely be enhanced by the integration of automation and AI-driven NDT solutions, improving operational efficiency and accuracy.
APAC NDT Equipment Market Company Market Share
APAC NDT Equipment Market: A Comprehensive Report (2019-2033)
This in-depth report provides a comprehensive analysis of the Asia-Pacific (APAC) Non-Destructive Testing (NDT) equipment market, offering invaluable insights for stakeholders, investors, and industry professionals. Covering the period from 2019 to 2033, with a focus on 2025, this report meticulously examines market dynamics, key segments, leading players, and future growth opportunities within this burgeoning sector. The report leverages rigorous data analysis and industry expertise to present actionable insights for informed decision-making. The market size is projected to reach xx Million by 2033.
APAC NDT Equipment Market Concentration & Dynamics
The APAC NDT equipment market exhibits a moderately concentrated landscape, with a few dominant players and numerous smaller specialized companies. Market share is primarily influenced by technological capabilities, geographic reach, and established customer relationships. Innovation ecosystems are primarily driven by research institutions and collaborative efforts between equipment manufacturers and end-users. Regulatory frameworks, varying across APAC nations, play a crucial role in shaping market practices and influencing adoption rates of specific NDT technologies. The market witnesses considerable substitution among different NDT methods depending on the application and material being inspected. End-user trends, particularly in sectors like Oil & Gas and renewable energy, heavily influence demand patterns. M&A activities within this segment have remained relatively modest in recent years, with an estimated xx M&A deals recorded between 2019 and 2024. However, strategic acquisitions are anticipated to increase as companies strive for greater market share and diversification.
- Market Concentration: Moderately concentrated, with top 5 players holding approximately xx% market share.
- Innovation Ecosystems: Collaboration between manufacturers, research institutes, and end-users driving advancements.
- Regulatory Frameworks: Varying across nations, impacting market practices and technology adoption.
- Substitute Products: Interchangeability between NDT methods based on application and material.
- End-User Trends: Strong growth driven by Oil & Gas, renewable energy, and infrastructure development.
- M&A Activities: xx deals recorded between 2019-2024; an increase is anticipated.
APAC NDT Equipment Market Industry Insights & Trends
The APAC NDT equipment market is experiencing robust growth, fueled by rising infrastructure investments, stringent quality control standards, and increasing demand for efficient inspection techniques across diverse industries. The market size was valued at xx Million in 2024 and is projected to exhibit a CAGR of xx% during the forecast period (2025-2033), reaching an estimated xx Million by 2033. Technological disruptions, particularly in areas like AI-powered automation and advanced sensor technologies, are transforming the landscape. Evolving consumer behaviors, such as heightened awareness of safety and quality, are positively influencing market growth.
Key Markets & Segments Leading APAC NDT Equipment Market
The Asia-Pacific (APAC) Non-Destructive Testing (NDT) Equipment Market is experiencing robust expansion, primarily driven by the region's dynamic industrial landscape and burgeoning infrastructure development. Currently, China stands as the dominant force, fueled by its massive industrial output and ongoing large-scale infrastructure projects. Following closely, India presents substantial growth potential, propelled by its rapid industrialization and increasing investments in manufacturing and infrastructure. South Korea also maintains a strong presence, underpinned by its highly advanced and sophisticated manufacturing sector, particularly in automotive and electronics.
In terms of technology, Ultrasonic Testing (UT) and Radiography Testing (RT) command the largest market shares. UT's versatility, ease of use, and ability to detect a wide range of defects make it a go-to solution across numerous industries. RT, on the other hand, remains indispensable for its capability to accurately identify internal flaws and material discontinuities. Other significant technologies gaining traction include Eddy Current Testing (ECT), Magnetic Particle Testing (MPT), and Penetrant Testing (PT), each catering to specific material and defect types.
The Oil & Gas sector continues to be a primary end-user, driven by the critical need for stringent safety and integrity checks throughout exploration, production, and refining operations. The Power & Energy sector, encompassing traditional power generation and the rapidly growing renewable energy segment (e.g., wind turbines, solar farms), also requires continuous and reliable NDT for equipment maintenance and safety. The Construction sector, with its emphasis on structural integrity, safety, and compliance in large-scale infrastructure projects like bridges, buildings, and transportation networks, represents another significant area of demand.
Dominant Regions/Countries:
- China: Holds the largest market share due to its extensive industrial base, ongoing infrastructure development, and increasing adoption of advanced manufacturing technologies.
- India: Exhibits significant growth potential, driven by government initiatives promoting manufacturing, infrastructure development, and a rising focus on quality and safety standards across industries.
- South Korea: Maintains a strong market presence, fueled by its advanced manufacturing and technology sectors, including automotive, shipbuilding, and electronics, which demand high-precision NDT solutions.
- Southeast Asian Nations (e.g., Vietnam, Indonesia, Thailand): Emerging as key growth markets, supported by increasing industrialization, foreign direct investment, and infrastructure expansion.
Dominant Technology Types:
- Ultrasonic Testing (UT): Remains the frontrunner due to its versatility, portability, real-time defect detection capabilities, and suitability for a wide array of materials and applications, including phased array UT and guided wave UT.
- Radiography Testing (RT): Continues to be a vital technique for volumetric inspection, crucial for detecting internal flaws and ensuring material integrity, especially in critical components. Digital radiography is increasingly replacing traditional film-based methods for faster results and better data management.
- Eddy Current Testing (ECT): Widely used for surface and near-surface defect detection, particularly in conductive materials, finding applications in aerospace and automotive industries.
- Magnetic Particle Testing (MPT) & Penetrant Testing (PT): Essential for surface crack detection in ferromagnetic and non-ferromagnetic materials, respectively, offering cost-effective solutions for many applications.
Dominant End-users:
- Oil & Gas: Critical for ensuring the integrity and safety of pipelines, storage tanks, drilling equipment, and processing facilities, driven by strict regulatory compliance and the need to prevent catastrophic failures.
- Power & Energy: Essential for inspecting turbines, boilers, nuclear reactors, and renewable energy infrastructure (e.g., wind turbine blades and towers), ensuring operational efficiency and safety.
- Construction: Crucial for verifying the quality and structural integrity of concrete, steel structures, welds, and foundations in buildings, bridges, tunnels, and other infrastructure projects.
- Aerospace: High demand for advanced NDT due to stringent safety requirements and the need to inspect complex composite and metallic structures for defects.
- Automotive: Used for quality control of engine components, welds, and structural integrity, ensuring vehicle safety and performance.
Key Growth Drivers:
- Robust Economic Growth & Infrastructure Investment: Sustained economic expansion across APAC fuels significant investments in industrial development, manufacturing, and large-scale infrastructure projects, creating a consistent demand for NDT equipment.
- Stringent Safety Regulations & Quality Standards: Growing awareness and enforcement of national and international safety regulations across various industries necessitate reliable and accurate NDT methods for compliance and risk mitigation.
- Technological Advancements & Miniaturization: The continuous development of more advanced, portable, automated, and intelligent NDT equipment, including AI-powered analysis and robotic inspection solutions, enhances efficiency and accessibility.
- Growth of Renewable Energy Sector: The expansion of solar, wind, and other renewable energy projects requires extensive NDT for the inspection and maintenance of critical components, presenting a significant new avenue for market growth.
- Increased Focus on Predictive Maintenance: Industries are shifting towards predictive maintenance strategies, where NDT plays a crucial role in identifying potential issues before they lead to failures, thus optimizing asset lifespan and reducing downtime.
APAC NDT Equipment Market Product Developments
The APAC NDT Equipment Market is witnessing a surge in product innovation, with manufacturers intensely focusing on several key areas to meet evolving industry demands. A significant trend is the emphasis on enhanced portability and ruggedization, allowing for easier deployment in challenging field environments. Furthermore, there's a concerted effort to improve accuracy and sensitivity, enabling the detection of smaller and more subtle defects, often through the integration of advanced sensor technologies and signal processing algorithms. Automation and robotics are also playing an increasingly vital role, with the development of automated inspection systems and robotic platforms that can perform repetitive tasks with greater consistency and reach difficult-to-access areas.
The integration of advanced data analysis capabilities, including Artificial Intelligence (AI) and Machine Learning (ML), is a transformative development, allowing for more intelligent interpretation of NDT data, predictive maintenance insights, and automated reporting. Manufacturers are investing heavily in developing user-friendly interfaces, intuitive software, and cloud-based solutions that facilitate remote monitoring, data management, and collaborative inspections. These advancements collectively aim to boost operational efficiency, significantly reduce inspection times, improve the overall reliability and precision of NDT processes, and ultimately provide end-users with a significant competitive edge through better asset management and quality assurance.
Challenges in the APAC NDT Equipment Market
The APAC NDT Equipment Market, while experiencing significant growth, is not without its hurdles. A primary challenge is the inconsistency in regulatory standards and certification processes across different countries within the region. This fragmentation can create complexities for manufacturers seeking to offer their products and services uniformly and can lead to varying levels of quality assurance and adoption. Supply chain complexities, particularly for specialized components and finished goods, can also pose logistical challenges, leading to extended lead times and increased costs. Moreover, the market is characterized by intense competition, with a mix of established global players, regional manufacturers, and emerging domestic companies vying for market share. This competition can lead to price pressures and the need for continuous innovation to differentiate products.
Furthermore, the skilled workforce gap remains a concern; a shortage of highly trained and certified NDT technicians capable of operating advanced equipment and interpreting complex data can hinder widespread adoption and effective utilization. The initial high cost of advanced NDT equipment can also be a barrier for smaller enterprises or in price-sensitive markets. Overcoming these challenges requires a concerted effort in standardization, supply chain optimization, talent development, and the demonstration of clear return on investment for advanced NDT solutions. The estimated impact of these factors on market growth could range from 10-15% if not addressed effectively, affecting both the pace of technological adoption and overall market expansion.
Forces Driving APAC NDT Equipment Market Growth
Several factors are driving the growth of the APAP NDT equipment market. Technological advancements such as AI-powered automation and improved sensor technology are increasing efficiency and accuracy. Stringent government regulations promoting safety and quality control are boosting demand. Economic growth, particularly in developing economies, is driving investment in infrastructure and industrial projects, leading to higher demand for NDT services and equipment.
Long-Term Growth Catalysts in APAP NDT Equipment Market
Long-term growth within the APAC NDT market is expected to be driven by continued technological innovation, particularly the development of advanced NDT techniques and AI integration. Strategic partnerships between manufacturers and end-users will play a crucial role in improving the application of NDT technologies. Expanding into new markets, particularly within the renewable energy sector, will further stimulate growth and open new opportunities for market expansion.
Emerging Opportunities in APAC NDT Equipment Market
The APAC NDT Equipment Market is brimming with emerging opportunities, driven by new industrial frontiers and technological integration. The rapidly expanding renewable energy sector, including solar farms, wind power generation (both onshore and offshore), and associated infrastructure, presents a significant and growing demand for robust NDT solutions for component inspection and integrity management. Similarly, the burgeoning field of advanced materials, such as composites and novel alloys, requires specialized NDT techniques for defect detection and characterization during manufacturing and operational phases.
The widespread adoption of Industry 4.0 principles is a major catalyst, driving demand for NDT equipment that integrates seamlessly with smart factories. This includes a strong push for advanced automation, real-time data analytics, IoT connectivity, and AI-powered decision-making capabilities. Furthermore, developing economies across APAC, with their ongoing and projected increases in infrastructure spending (e.g., transportation networks, smart cities, water management systems), provide vast untapped potential for NDT services and equipment sales. The growing emphasis on asset longevity and predictive maintenance across all industries is also creating opportunities for NDT technologies that can identify potential failures early, minimizing downtime and operational costs. Finally, the development of more affordable, user-friendly, and specialized NDT solutions tailored for specific regional needs and smaller industries can unlock new market segments.
Leading Players in the APAC NDT Equipment Market Sector
- Acuren Inspection Inc (Rockwood Service Corporation)
- Intertek Group Plc
- MISTRAS Group
- TEAM Inc
- TÜV Rhineland AG
- Zetec Inc
- SGS Group
- Bureau Veritas S A
- Nikon Metrology NV
- Fujifilm Corporation
- Olympus Corporation
- Magnaflux Corp
- NCS Testing Technology Co Limited
- GE Measurement and Control
- Applus Services S A
- YXLON International Gmbh ( COMET Group)
Key Milestones in APAC NDT Equipment Industry
- April 2021: Nikon Corporation launched the Lasermeister 102A, an optical processing system for titanium alloy additive manufacturing, impacting the precision measurement segment.
- April 2021: Nikon Corporation released a "Remote Control SDK" for its NEXIV series, enhancing automated measurement system integration and efficiency.
- April 2021: Bureau Veritas joined the TCFD, promoting climate-related transparency and influencing the adoption of sustainable NDT practices.
- April 2021: Carnival Corporation partnered with Bureau Veritas for health and safety services (NDT), showcasing the increasing importance of NDT in the travel industry.
Strategic Outlook for APAC NDT Equipment Market
The APAC NDT equipment market presents significant growth potential driven by technological advancements, increasing infrastructure investments, and stringent safety regulations. Strategic opportunities for players include focusing on innovative product development, expanding into high-growth markets, and developing strategic partnerships to capture increasing demand for advanced NDT solutions. The market's future trajectory hinges on embracing technological disruption and adapting to evolving end-user needs.
APAC NDT Equipment Market Segmentation
-
1. Technology Type
- 1.1. Radiography Testing
- 1.2. Ultrasonic Testing
- 1.3. Magnetic Particle Testing*
- 1.4. Liquid Penetrant Testing
- 1.5. Visual Inspection
- 1.6. Eddy Current Testing*
- 1.7. Other Technologies
-
2. End-user
- 2.1. Oil & Gas
- 2.2. Power & Energy
- 2.3. Construction
- 2.4. Automotive & Transportation
- 2.5. Aerospace & Defense
- 2.6. Other End-users
APAC NDT Equipment Market Segmentation By Geography
-
1. North America
- 1.1. United States
- 1.2. Canada
- 1.3. Mexico
-
2. South America
- 2.1. Brazil
- 2.2. Argentina
- 2.3. Rest of South America
-
3. Europe
- 3.1. United Kingdom
- 3.2. Germany
- 3.3. France
- 3.4. Italy
- 3.5. Spain
- 3.6. Russia
- 3.7. Benelux
- 3.8. Nordics
- 3.9. Rest of Europe
-
4. Middle East & Africa
- 4.1. Turkey
- 4.2. Israel
- 4.3. GCC
- 4.4. North Africa
- 4.5. South Africa
- 4.6. Rest of Middle East & Africa
-
5. Asia Pacific
- 5.1. China
- 5.2. India
- 5.3. Japan
- 5.4. South Korea
- 5.5. ASEAN
- 5.6. Oceania
- 5.7. Rest of Asia Pacific
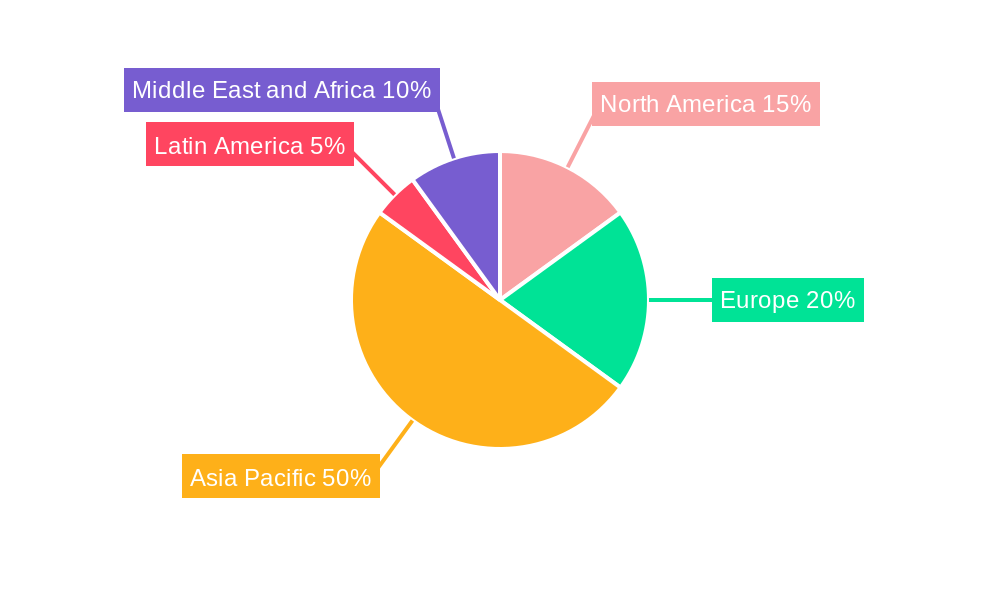
APAC NDT Equipment Market Regional Market Share
Geographic Coverage of APAC NDT Equipment Market
APAC NDT Equipment Market REPORT HIGHLIGHTS
| Aspects | Details |
|---|---|
| Study Period | 2020-2034 |
| Base Year | 2025 |
| Estimated Year | 2026 |
| Forecast Period | 2026-2034 |
| Historical Period | 2020-2025 |
| Growth Rate | CAGR of 7.23% from 2020-2034 |
| Segmentation |
|
Table of Contents
- 1. Introduction
- 1.1. Research Scope
- 1.2. Market Segmentation
- 1.3. Research Objective
- 1.4. Definitions and Assumptions
- 2. Executive Summary
- 2.1. Market Snapshot
- 3. Market Dynamics
- 3.1. Market Drivers
- 3.2. Market Restrains
- 3.3. Market Trends
- 3.4. Market Opportunities
- 4. Market Factor Analysis
- 4.1. Porters Five Forces
- 4.1.1. Bargaining Power of Suppliers
- 4.1.2. Bargaining Power of Buyers
- 4.1.3. Threat of New Entrants
- 4.1.4. Threat of Substitutes
- 4.1.5. Competitive Rivalry
- 4.2. PESTEL analysis
- 4.3. BCG Analysis
- 4.3.1. Stars (High Growth, High Market Share)
- 4.3.2. Cash Cows (Low Growth, High Market Share)
- 4.3.3. Question Mark (High Growth, Low Market Share)
- 4.3.4. Dogs (Low Growth, Low Market Share)
- 4.4. Ansoff Matrix Analysis
- 4.5. Supply Chain Analysis
- 4.6. Regulatory Landscape
- 4.7. Current Market Potential and Opportunity Assessment (TAM–SAM–SOM Framework)
- 4.8. MSR Analyst Note
- 4.1. Porters Five Forces
- 5. Market Analysis, Insights and Forecast 2021-2033
- 5.1. Market Analysis, Insights and Forecast - by Technology Type
- 5.1.1. Radiography Testing
- 5.1.2. Ultrasonic Testing
- 5.1.3. Magnetic Particle Testing*
- 5.1.4. Liquid Penetrant Testing
- 5.1.5. Visual Inspection
- 5.1.6. Eddy Current Testing*
- 5.1.7. Other Technologies
- 5.2. Market Analysis, Insights and Forecast - by End-user
- 5.2.1. Oil & Gas
- 5.2.2. Power & Energy
- 5.2.3. Construction
- 5.2.4. Automotive & Transportation
- 5.2.5. Aerospace & Defense
- 5.2.6. Other End-users
- 5.3. Market Analysis, Insights and Forecast - by Region
- 5.3.1. North America
- 5.3.2. South America
- 5.3.3. Europe
- 5.3.4. Middle East & Africa
- 5.3.5. Asia Pacific
- 5.1. Market Analysis, Insights and Forecast - by Technology Type
- 6. Global APAC NDT Equipment Market Analysis, Insights and Forecast, 2021-2033
- 6.1. Market Analysis, Insights and Forecast - by Technology Type
- 6.1.1. Radiography Testing
- 6.1.2. Ultrasonic Testing
- 6.1.3. Magnetic Particle Testing*
- 6.1.4. Liquid Penetrant Testing
- 6.1.5. Visual Inspection
- 6.1.6. Eddy Current Testing*
- 6.1.7. Other Technologies
- 6.2. Market Analysis, Insights and Forecast - by End-user
- 6.2.1. Oil & Gas
- 6.2.2. Power & Energy
- 6.2.3. Construction
- 6.2.4. Automotive & Transportation
- 6.2.5. Aerospace & Defense
- 6.2.6. Other End-users
- 6.1. Market Analysis, Insights and Forecast - by Technology Type
- 7. North America APAC NDT Equipment Market Analysis, Insights and Forecast, 2020-2032
- 7.1. Market Analysis, Insights and Forecast - by Technology Type
- 7.1.1. Radiography Testing
- 7.1.2. Ultrasonic Testing
- 7.1.3. Magnetic Particle Testing*
- 7.1.4. Liquid Penetrant Testing
- 7.1.5. Visual Inspection
- 7.1.6. Eddy Current Testing*
- 7.1.7. Other Technologies
- 7.2. Market Analysis, Insights and Forecast - by End-user
- 7.2.1. Oil & Gas
- 7.2.2. Power & Energy
- 7.2.3. Construction
- 7.2.4. Automotive & Transportation
- 7.2.5. Aerospace & Defense
- 7.2.6. Other End-users
- 7.1. Market Analysis, Insights and Forecast - by Technology Type
- 8. South America APAC NDT Equipment Market Analysis, Insights and Forecast, 2020-2032
- 8.1. Market Analysis, Insights and Forecast - by Technology Type
- 8.1.1. Radiography Testing
- 8.1.2. Ultrasonic Testing
- 8.1.3. Magnetic Particle Testing*
- 8.1.4. Liquid Penetrant Testing
- 8.1.5. Visual Inspection
- 8.1.6. Eddy Current Testing*
- 8.1.7. Other Technologies
- 8.2. Market Analysis, Insights and Forecast - by End-user
- 8.2.1. Oil & Gas
- 8.2.2. Power & Energy
- 8.2.3. Construction
- 8.2.4. Automotive & Transportation
- 8.2.5. Aerospace & Defense
- 8.2.6. Other End-users
- 8.1. Market Analysis, Insights and Forecast - by Technology Type
- 9. Europe APAC NDT Equipment Market Analysis, Insights and Forecast, 2020-2032
- 9.1. Market Analysis, Insights and Forecast - by Technology Type
- 9.1.1. Radiography Testing
- 9.1.2. Ultrasonic Testing
- 9.1.3. Magnetic Particle Testing*
- 9.1.4. Liquid Penetrant Testing
- 9.1.5. Visual Inspection
- 9.1.6. Eddy Current Testing*
- 9.1.7. Other Technologies
- 9.2. Market Analysis, Insights and Forecast - by End-user
- 9.2.1. Oil & Gas
- 9.2.2. Power & Energy
- 9.2.3. Construction
- 9.2.4. Automotive & Transportation
- 9.2.5. Aerospace & Defense
- 9.2.6. Other End-users
- 9.1. Market Analysis, Insights and Forecast - by Technology Type
- 10. Middle East & Africa APAC NDT Equipment Market Analysis, Insights and Forecast, 2020-2032
- 10.1. Market Analysis, Insights and Forecast - by Technology Type
- 10.1.1. Radiography Testing
- 10.1.2. Ultrasonic Testing
- 10.1.3. Magnetic Particle Testing*
- 10.1.4. Liquid Penetrant Testing
- 10.1.5. Visual Inspection
- 10.1.6. Eddy Current Testing*
- 10.1.7. Other Technologies
- 10.2. Market Analysis, Insights and Forecast - by End-user
- 10.2.1. Oil & Gas
- 10.2.2. Power & Energy
- 10.2.3. Construction
- 10.2.4. Automotive & Transportation
- 10.2.5. Aerospace & Defense
- 10.2.6. Other End-users
- 10.1. Market Analysis, Insights and Forecast - by Technology Type
- 11. Asia Pacific APAC NDT Equipment Market Analysis, Insights and Forecast, 2020-2032
- 11.1. Market Analysis, Insights and Forecast - by Technology Type
- 11.1.1. Radiography Testing
- 11.1.2. Ultrasonic Testing
- 11.1.3. Magnetic Particle Testing*
- 11.1.4. Liquid Penetrant Testing
- 11.1.5. Visual Inspection
- 11.1.6. Eddy Current Testing*
- 11.1.7. Other Technologies
- 11.2. Market Analysis, Insights and Forecast - by End-user
- 11.2.1. Oil & Gas
- 11.2.2. Power & Energy
- 11.2.3. Construction
- 11.2.4. Automotive & Transportation
- 11.2.5. Aerospace & Defense
- 11.2.6. Other End-users
- 11.1. Market Analysis, Insights and Forecast - by Technology Type
- 12. Competitive Analysis
- 12.1. Company Profiles
- 12.1.1 Acuren Inspection Inc (Rockwood Service Corporation)
- 12.1.1.1. Company Overview
- 12.1.1.2. Products
- 12.1.1.3. Company Financials
- 12.1.1.4. SWOT Analysis
- 12.1.2 Intertek Group Plc
- 12.1.2.1. Company Overview
- 12.1.2.2. Products
- 12.1.2.3. Company Financials
- 12.1.2.4. SWOT Analysis
- 12.1.3 MISTRAS Group
- 12.1.3.1. Company Overview
- 12.1.3.2. Products
- 12.1.3.3. Company Financials
- 12.1.3.4. SWOT Analysis
- 12.1.4 TEAM Inc
- 12.1.4.1. Company Overview
- 12.1.4.2. Products
- 12.1.4.3. Company Financials
- 12.1.4.4. SWOT Analysis
- 12.1.5 TÜV Rhineland AG
- 12.1.5.1. Company Overview
- 12.1.5.2. Products
- 12.1.5.3. Company Financials
- 12.1.5.4. SWOT Analysis
- 12.1.6 Zetec Inc *List Not Exhaustive
- 12.1.6.1. Company Overview
- 12.1.6.2. Products
- 12.1.6.3. Company Financials
- 12.1.6.4. SWOT Analysis
- 12.1.7 SGS Group
- 12.1.7.1. Company Overview
- 12.1.7.2. Products
- 12.1.7.3. Company Financials
- 12.1.7.4. SWOT Analysis
- 12.1.8 Bureau Veritas S A
- 12.1.8.1. Company Overview
- 12.1.8.2. Products
- 12.1.8.3. Company Financials
- 12.1.8.4. SWOT Analysis
- 12.1.9 Nikon Metrology NV
- 12.1.9.1. Company Overview
- 12.1.9.2. Products
- 12.1.9.3. Company Financials
- 12.1.9.4. SWOT Analysis
- 12.1.10 Fujifilm Corporation
- 12.1.10.1. Company Overview
- 12.1.10.2. Products
- 12.1.10.3. Company Financials
- 12.1.10.4. SWOT Analysis
- 12.1.11 Olympus Corporation
- 12.1.11.1. Company Overview
- 12.1.11.2. Products
- 12.1.11.3. Company Financials
- 12.1.11.4. SWOT Analysis
- 12.1.12 Magnaflux Corp
- 12.1.12.1. Company Overview
- 12.1.12.2. Products
- 12.1.12.3. Company Financials
- 12.1.12.4. SWOT Analysis
- 12.1.13 NCS Testing Technology Co Limited
- 12.1.13.1. Company Overview
- 12.1.13.2. Products
- 12.1.13.3. Company Financials
- 12.1.13.4. SWOT Analysis
- 12.1.14 GE Measurement and Control
- 12.1.14.1. Company Overview
- 12.1.14.2. Products
- 12.1.14.3. Company Financials
- 12.1.14.4. SWOT Analysis
- 12.1.15 Applus Services S A
- 12.1.15.1. Company Overview
- 12.1.15.2. Products
- 12.1.15.3. Company Financials
- 12.1.15.4. SWOT Analysis
- 12.1.16 YXLON International Gmbh ( COMET Group)
- 12.1.16.1. Company Overview
- 12.1.16.2. Products
- 12.1.16.3. Company Financials
- 12.1.16.4. SWOT Analysis
- 12.1.1 Acuren Inspection Inc (Rockwood Service Corporation)
- 12.2. Market Entropy
- 12.2.1 Company's Key Areas Served
- 12.2.2 Recent Developments
- 12.3. Company Market Share Analysis 2025
- 12.3.1 Top 5 Companies Market Share Analysis
- 12.3.2 Top 3 Companies Market Share Analysis
- 12.4. List of Potential Customers
- 13. Research Methodology
List of Figures
- Figure 1: Global APAC NDT Equipment Market Revenue Breakdown (billion, %) by Region 2025 & 2033
- Figure 2: North America APAC NDT Equipment Market Revenue (billion), by Technology Type 2025 & 2033
- Figure 3: North America APAC NDT Equipment Market Revenue Share (%), by Technology Type 2025 & 2033
- Figure 4: North America APAC NDT Equipment Market Revenue (billion), by End-user 2025 & 2033
- Figure 5: North America APAC NDT Equipment Market Revenue Share (%), by End-user 2025 & 2033
- Figure 6: North America APAC NDT Equipment Market Revenue (billion), by Country 2025 & 2033
- Figure 7: North America APAC NDT Equipment Market Revenue Share (%), by Country 2025 & 2033
- Figure 8: South America APAC NDT Equipment Market Revenue (billion), by Technology Type 2025 & 2033
- Figure 9: South America APAC NDT Equipment Market Revenue Share (%), by Technology Type 2025 & 2033
- Figure 10: South America APAC NDT Equipment Market Revenue (billion), by End-user 2025 & 2033
- Figure 11: South America APAC NDT Equipment Market Revenue Share (%), by End-user 2025 & 2033
- Figure 12: South America APAC NDT Equipment Market Revenue (billion), by Country 2025 & 2033
- Figure 13: South America APAC NDT Equipment Market Revenue Share (%), by Country 2025 & 2033
- Figure 14: Europe APAC NDT Equipment Market Revenue (billion), by Technology Type 2025 & 2033
- Figure 15: Europe APAC NDT Equipment Market Revenue Share (%), by Technology Type 2025 & 2033
- Figure 16: Europe APAC NDT Equipment Market Revenue (billion), by End-user 2025 & 2033
- Figure 17: Europe APAC NDT Equipment Market Revenue Share (%), by End-user 2025 & 2033
- Figure 18: Europe APAC NDT Equipment Market Revenue (billion), by Country 2025 & 2033
- Figure 19: Europe APAC NDT Equipment Market Revenue Share (%), by Country 2025 & 2033
- Figure 20: Middle East & Africa APAC NDT Equipment Market Revenue (billion), by Technology Type 2025 & 2033
- Figure 21: Middle East & Africa APAC NDT Equipment Market Revenue Share (%), by Technology Type 2025 & 2033
- Figure 22: Middle East & Africa APAC NDT Equipment Market Revenue (billion), by End-user 2025 & 2033
- Figure 23: Middle East & Africa APAC NDT Equipment Market Revenue Share (%), by End-user 2025 & 2033
- Figure 24: Middle East & Africa APAC NDT Equipment Market Revenue (billion), by Country 2025 & 2033
- Figure 25: Middle East & Africa APAC NDT Equipment Market Revenue Share (%), by Country 2025 & 2033
- Figure 26: Asia Pacific APAC NDT Equipment Market Revenue (billion), by Technology Type 2025 & 2033
- Figure 27: Asia Pacific APAC NDT Equipment Market Revenue Share (%), by Technology Type 2025 & 2033
- Figure 28: Asia Pacific APAC NDT Equipment Market Revenue (billion), by End-user 2025 & 2033
- Figure 29: Asia Pacific APAC NDT Equipment Market Revenue Share (%), by End-user 2025 & 2033
- Figure 30: Asia Pacific APAC NDT Equipment Market Revenue (billion), by Country 2025 & 2033
- Figure 31: Asia Pacific APAC NDT Equipment Market Revenue Share (%), by Country 2025 & 2033
List of Tables
- Table 1: Global APAC NDT Equipment Market Revenue billion Forecast, by Technology Type 2020 & 2033
- Table 2: Global APAC NDT Equipment Market Revenue billion Forecast, by End-user 2020 & 2033
- Table 3: Global APAC NDT Equipment Market Revenue billion Forecast, by Region 2020 & 2033
- Table 4: Global APAC NDT Equipment Market Revenue billion Forecast, by Technology Type 2020 & 2033
- Table 5: Global APAC NDT Equipment Market Revenue billion Forecast, by End-user 2020 & 2033
- Table 6: Global APAC NDT Equipment Market Revenue billion Forecast, by Country 2020 & 2033
- Table 7: United States APAC NDT Equipment Market Revenue (billion) Forecast, by Application 2020 & 2033
- Table 8: Canada APAC NDT Equipment Market Revenue (billion) Forecast, by Application 2020 & 2033
- Table 9: Mexico APAC NDT Equipment Market Revenue (billion) Forecast, by Application 2020 & 2033
- Table 10: Global APAC NDT Equipment Market Revenue billion Forecast, by Technology Type 2020 & 2033
- Table 11: Global APAC NDT Equipment Market Revenue billion Forecast, by End-user 2020 & 2033
- Table 12: Global APAC NDT Equipment Market Revenue billion Forecast, by Country 2020 & 2033
- Table 13: Brazil APAC NDT Equipment Market Revenue (billion) Forecast, by Application 2020 & 2033
- Table 14: Argentina APAC NDT Equipment Market Revenue (billion) Forecast, by Application 2020 & 2033
- Table 15: Rest of South America APAC NDT Equipment Market Revenue (billion) Forecast, by Application 2020 & 2033
- Table 16: Global APAC NDT Equipment Market Revenue billion Forecast, by Technology Type 2020 & 2033
- Table 17: Global APAC NDT Equipment Market Revenue billion Forecast, by End-user 2020 & 2033
- Table 18: Global APAC NDT Equipment Market Revenue billion Forecast, by Country 2020 & 2033
- Table 19: United Kingdom APAC NDT Equipment Market Revenue (billion) Forecast, by Application 2020 & 2033
- Table 20: Germany APAC NDT Equipment Market Revenue (billion) Forecast, by Application 2020 & 2033
- Table 21: France APAC NDT Equipment Market Revenue (billion) Forecast, by Application 2020 & 2033
- Table 22: Italy APAC NDT Equipment Market Revenue (billion) Forecast, by Application 2020 & 2033
- Table 23: Spain APAC NDT Equipment Market Revenue (billion) Forecast, by Application 2020 & 2033
- Table 24: Russia APAC NDT Equipment Market Revenue (billion) Forecast, by Application 2020 & 2033
- Table 25: Benelux APAC NDT Equipment Market Revenue (billion) Forecast, by Application 2020 & 2033
- Table 26: Nordics APAC NDT Equipment Market Revenue (billion) Forecast, by Application 2020 & 2033
- Table 27: Rest of Europe APAC NDT Equipment Market Revenue (billion) Forecast, by Application 2020 & 2033
- Table 28: Global APAC NDT Equipment Market Revenue billion Forecast, by Technology Type 2020 & 2033
- Table 29: Global APAC NDT Equipment Market Revenue billion Forecast, by End-user 2020 & 2033
- Table 30: Global APAC NDT Equipment Market Revenue billion Forecast, by Country 2020 & 2033
- Table 31: Turkey APAC NDT Equipment Market Revenue (billion) Forecast, by Application 2020 & 2033
- Table 32: Israel APAC NDT Equipment Market Revenue (billion) Forecast, by Application 2020 & 2033
- Table 33: GCC APAC NDT Equipment Market Revenue (billion) Forecast, by Application 2020 & 2033
- Table 34: North Africa APAC NDT Equipment Market Revenue (billion) Forecast, by Application 2020 & 2033
- Table 35: South Africa APAC NDT Equipment Market Revenue (billion) Forecast, by Application 2020 & 2033
- Table 36: Rest of Middle East & Africa APAC NDT Equipment Market Revenue (billion) Forecast, by Application 2020 & 2033
- Table 37: Global APAC NDT Equipment Market Revenue billion Forecast, by Technology Type 2020 & 2033
- Table 38: Global APAC NDT Equipment Market Revenue billion Forecast, by End-user 2020 & 2033
- Table 39: Global APAC NDT Equipment Market Revenue billion Forecast, by Country 2020 & 2033
- Table 40: China APAC NDT Equipment Market Revenue (billion) Forecast, by Application 2020 & 2033
- Table 41: India APAC NDT Equipment Market Revenue (billion) Forecast, by Application 2020 & 2033
- Table 42: Japan APAC NDT Equipment Market Revenue (billion) Forecast, by Application 2020 & 2033
- Table 43: South Korea APAC NDT Equipment Market Revenue (billion) Forecast, by Application 2020 & 2033
- Table 44: ASEAN APAC NDT Equipment Market Revenue (billion) Forecast, by Application 2020 & 2033
- Table 45: Oceania APAC NDT Equipment Market Revenue (billion) Forecast, by Application 2020 & 2033
- Table 46: Rest of Asia Pacific APAC NDT Equipment Market Revenue (billion) Forecast, by Application 2020 & 2033
Frequently Asked Questions
1. What is the projected Compound Annual Growth Rate (CAGR) of the APAC NDT Equipment Market?
The projected CAGR is approximately 7.23%.
2. Which companies are prominent players in the APAC NDT Equipment Market?
Key companies in the market include Acuren Inspection Inc (Rockwood Service Corporation), Intertek Group Plc, MISTRAS Group, TEAM Inc, TÜV Rhineland AG, Zetec Inc *List Not Exhaustive, SGS Group, Bureau Veritas S A, Nikon Metrology NV, Fujifilm Corporation, Olympus Corporation, Magnaflux Corp, NCS Testing Technology Co Limited, GE Measurement and Control, Applus Services S A, YXLON International Gmbh ( COMET Group).
3. What are the main segments of the APAC NDT Equipment Market?
The market segments include Technology Type, End-user.
4. Can you provide details about the market size?
The market size is estimated to be USD 5 billion as of 2022.
5. What are some drivers contributing to market growth?
Stringent safety regulations and growth in inspection services industry expected to drive adoption; Growing demand from the construction industry.
6. What are the notable trends driving market growth?
Stringent Regulations Mandating Safety.
7. Are there any restraints impacting market growth?
High replacement rate remains a key concern followed by reluctance to adopt new technologies in emerging regions.
8. Can you provide examples of recent developments in the market?
APRIL 2021- Nikon Corporation launched the Lasermeister 102A, a new optical processing system capable of titanium alloy additive manufacturing. The Lasermeister series uses a high-precision laser to perform a variety of metal processing tasks, including additive manufacturing like a 3D printer and laser marking and welding.
9. What pricing options are available for accessing the report?
Pricing options include single-user, multi-user, and enterprise licenses priced at USD 4750, USD 4950, and USD 6800 respectively.
10. Is the market size provided in terms of value or volume?
The market size is provided in terms of value, measured in billion.
11. Are there any specific market keywords associated with the report?
Yes, the market keyword associated with the report is "APAC NDT Equipment Market," which aids in identifying and referencing the specific market segment covered.
12. How do I determine which pricing option suits my needs best?
The pricing options vary based on user requirements and access needs. Individual users may opt for single-user licenses, while businesses requiring broader access may choose multi-user or enterprise licenses for cost-effective access to the report.
13. Are there any additional resources or data provided in the APAC NDT Equipment Market report?
While the report offers comprehensive insights, it's advisable to review the specific contents or supplementary materials provided to ascertain if additional resources or data are available.
14. How can I stay updated on further developments or reports in the APAC NDT Equipment Market?
To stay informed about further developments, trends, and reports in the APAC NDT Equipment Market, consider subscribing to industry newsletters, following relevant companies and organizations, or regularly checking reputable industry news sources and publications.
Methodology
Step 1 - Identification of Relevant Samples Size from Population Database


Step 2 - Approaches for Defining Global Market Size (Value, Volume* & Price*)

Note*: In applicable scenarios
Step 3 - Data Sources
Primary Research
- Web Analytics
- Survey Reports
- Research Institute
- Latest Research Reports
- Opinion Leaders
Secondary Research
- Annual Reports
- White Paper
- Latest Press Release
- Industry Association
- Paid Database
- Investor Presentations

Step 4 - Data Triangulation
Involves using different sources of information in order to increase the validity of a study
These sources are likely to be stakeholders in a program - participants, other researchers, program staff, other community members, and so on.
Then we put all data in single framework & apply various statistical tools to find out the dynamic on the market.
During the analysis stage, feedback from the stakeholder groups would be compared to determine areas of agreement as well as areas of divergence