

Key Insights
The B2B e-commerce market is experiencing robust growth, fueled by the increasing adoption of digital technologies by businesses globally. The 12.36% CAGR (Compound Annual Growth Rate) indicates a significant expansion, projected to continue through 2033. This growth is driven by several factors, including the rising need for improved supply chain efficiency, the desire for enhanced customer experience, and the cost-effectiveness of online transactions compared to traditional methods. Key trends include the increasing integration of e-commerce platforms with enterprise resource planning (ERP) systems, the rise of mobile-first B2B commerce, and the growing adoption of artificial intelligence (AI) and machine learning (ML) for personalized recommendations and improved customer service. While data security concerns and the need for robust IT infrastructure pose challenges, the overall market outlook remains positive. The dominance of large players like Alibaba, Amazon, and eBay underscores the market's consolidation, yet opportunities remain for specialized niche players catering to specific industry segments. The geographical distribution showcases significant potential in Asia Pacific, driven by the rapid growth of economies like China and India. North America and Europe remain strong markets, although their growth rates may be slightly lower than those in the Asia-Pacific region. The market segmentation by channel (Direct Sales and Marketplace Sales) highlights diverse business models and customer preferences. While direct sales offer greater control, marketplace sales provide wider reach and access to a broader customer base. The sustained growth trajectory suggests continued investment and innovation in B2B e-commerce solutions, further accelerating market expansion in the coming years.
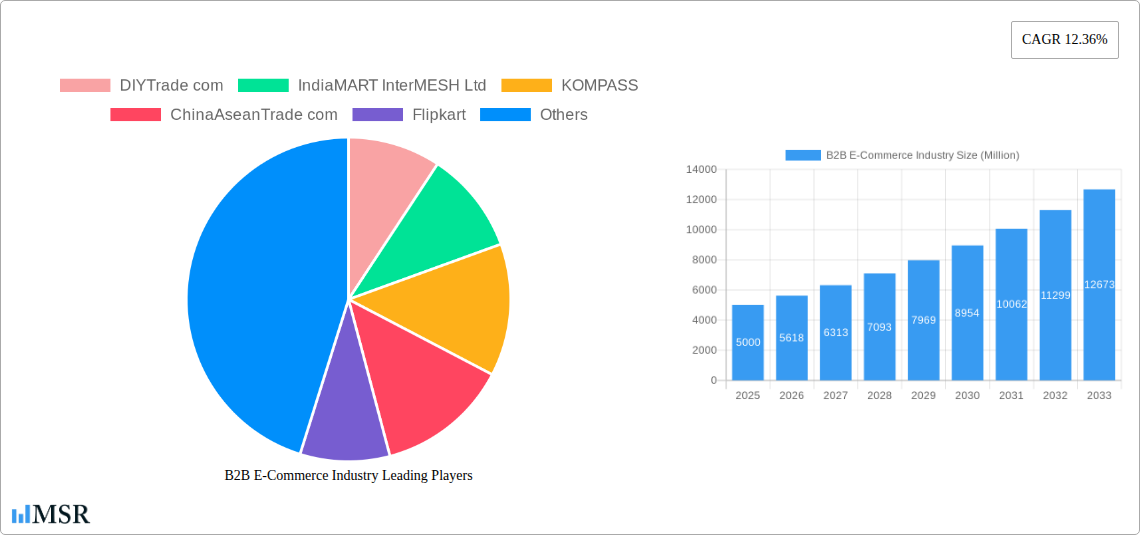
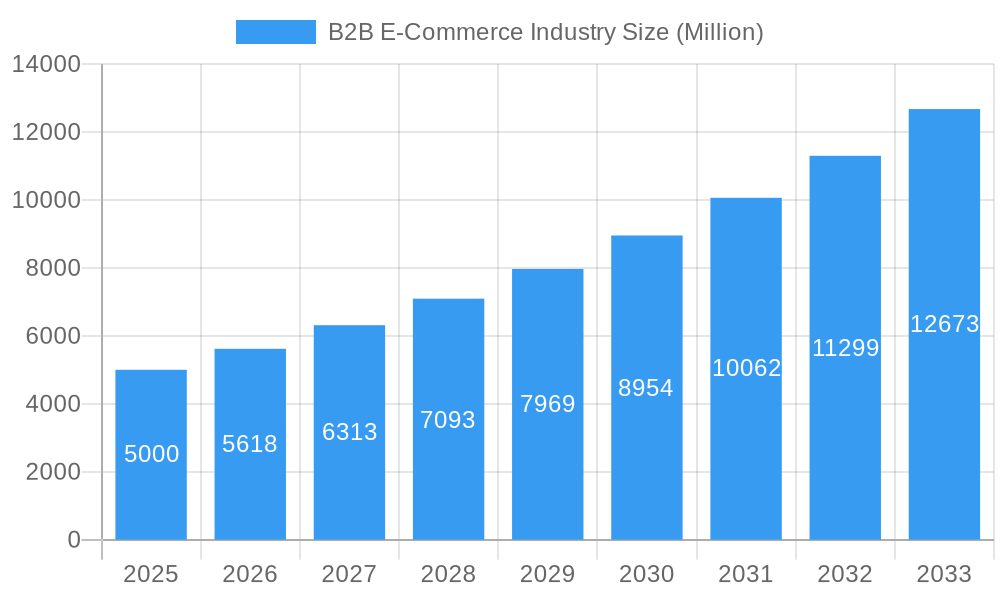
B2B E-Commerce Industry Market Size (In Billion)
The competitive landscape is characterized by a mix of established giants and emerging players. Established players leverage their extensive networks and brand recognition, while smaller companies focus on niche markets and innovative solutions. Success in this dynamic market requires agility, technological proficiency, and a deep understanding of customer needs. Businesses are increasingly adopting integrated platforms combining CRM, e-procurement, and payment systems, creating a more seamless and efficient experience for buyers and sellers. Furthermore, the growing adoption of blockchain technology holds the potential to enhance security and transparency in B2B transactions, representing another major driver for future growth. The continuing shift from traditional methods to online channels suggests that the B2B e-commerce sector will continue its upward trajectory in the years to come, presenting lucrative opportunities for both established businesses and new entrants.
B2B E-Commerce Industry Company Market Share
B2B E-Commerce Industry: A Comprehensive Market Report (2019-2033)
This comprehensive report provides an in-depth analysis of the B2B e-commerce industry, offering invaluable insights for stakeholders navigating this rapidly evolving landscape. Covering the period from 2019 to 2033, with a base year of 2025 and a forecast period of 2025-2033, this report unveils key trends, challenges, and opportunities shaping the future of B2B online commerce. The global market size is projected to reach xx Million by 2025, demonstrating a robust CAGR of xx% during the forecast period. This report features analysis of major players such as Amazon com Inc, Alibaba Group, and eBay Inc, alongside key regional markets and industry segments.
B2B E-Commerce Industry Market Concentration & Dynamics
The B2B e-commerce market exhibits a moderately concentrated structure, with a few dominant players holding significant market share. While giants like Amazon and Alibaba command substantial portions, a fragmented landscape exists with numerous niche players catering to specific industries and regions. Market share dynamics are influenced by factors including technological innovation, regulatory frameworks, and strategic mergers & acquisitions (M&A). The historical period (2019-2024) witnessed xx Million M&A deals, with a projected increase to xx Million during the forecast period (2025-2033).
Market Share: Amazon and Alibaba collectively hold an estimated xx% market share in 2025. Other significant players like IndiaMART and DIYTrade each command approximately xx% and xx%, respectively.
Innovation Ecosystems: Constant innovation in areas such as AI-powered personalization, blockchain-based security, and advanced analytics fuels competition and market evolution.
Regulatory Frameworks: Varying regulatory landscapes across different geographies impact market entry and operational strategies, creating both opportunities and challenges.
Substitute Products: Traditional B2B sales channels continue to compete, though the shift toward digitalization is steadily increasing B2B e-commerce's dominance.
End-User Trends: The increasing adoption of e-procurement systems and the growing preference for online ordering among businesses are driving industry growth.
M&A Activities: Strategic acquisitions are reshaping the competitive landscape, fostering consolidation and expansion into new markets.
B2B E-Commerce Industry Industry Insights & Trends
The B2B e-commerce market is experiencing exponential growth driven by several factors. The increasing penetration of internet and mobile technologies, coupled with rising consumer demand for convenience and efficiency, fuels market expansion. Technological disruptions, like the integration of AI and machine learning, personalize the customer experience and optimize operational processes. The shift towards digital transformation in businesses is another key driver. Companies are embracing B2B e-commerce to enhance operational efficiency, improve supply chain management, and optimize cost structures. The global market size is estimated at xx Million in 2025, exhibiting significant growth potential over the forecast period.
Key Markets & Segments Leading B2B E-Commerce Industry
North America and Asia-Pacific currently dominate the B2B e-commerce market, fueled by strong economic growth and advanced digital infrastructure. Within these regions, China and the United States stand out as key players.
By Channel:
Marketplace Sales: Marketplace platforms like Amazon Business and Alibaba.com enjoy significant advantages, offering access to a broad customer base and streamlined logistics. The dominance is due to their established brand recognition and extensive seller networks.
Direct Sales: Companies utilizing direct sales strategies benefit from stronger customer relationships and greater control over branding and pricing. However, this approach often requires significant investment in marketing and infrastructure.
Drivers for Dominance:
- Economic Growth: Strong economic conditions in key markets directly contribute to increased business spending on online procurement solutions.
- Digital Infrastructure: Robust internet penetration and advanced logistics networks facilitate seamless online transactions.
- Government Policies: Supportive government initiatives promoting digital commerce further accelerate market growth.
- Consumer Preferences: Shifting consumer preferences toward online purchasing convenience drives business adoption of B2B e-commerce platforms.
B2B E-Commerce Industry Product Developments
Recent product innovations emphasize personalization, automation, and enhanced security. AI-powered recommendation engines, integrated payment gateways, and blockchain-based solutions for supply chain transparency are enhancing the customer experience and improving operational efficiencies. These advancements provide businesses with a competitive edge, enabling greater agility and cost optimization.
Challenges in the B2B E-Commerce Industry Market
Several factors hinder B2B e-commerce market growth, including regulatory complexities, cybersecurity threats, and logistical challenges. Data privacy concerns, evolving regulations, and the risk of fraudulent activities create hurdles for businesses. Supply chain disruptions, particularly prevalent in recent years, add complexities and impact timely delivery. Furthermore, intense competition necessitates continuous innovation and adaptation to maintain market relevance. These challenges collectively impact the overall market growth and efficiency. The estimated impact on market growth due to these factors is approximately xx Million annually.
Forces Driving B2B E-Commerce Industry Growth
Several factors fuel the B2B e-commerce market's growth. Technological advancements, such as AI and machine learning, enhance customer experiences and operational efficiency. Expanding internet access and increasing digital literacy are broadening market reach. Favorable regulatory environments and government initiatives supporting digital transformation are also contributing to market growth. For instance, the rising adoption of cloud-based solutions for inventory management and order fulfillment streamlines operations and reduces costs.
Long-Term Growth Catalysts in the B2B E-Commerce Industry Market
Long-term growth hinges on strategic partnerships, technological innovations, and market expansion into emerging economies. Collaborative initiatives among industry players, such as the partnership between Razer Merchant Services and Atome, foster the adoption of innovative payment solutions. Continued advancements in AI, blockchain, and big data analytics will further enhance efficiency and security. Expansion into untapped markets in Africa and Latin America presents significant opportunities for future growth.
Emerging Opportunities in B2B E-Commerce Industry
The rise of omnichannel strategies, integrating online and offline sales channels, offers significant growth potential. The increasing demand for personalized experiences and targeted marketing opens avenues for niche players to thrive. The expansion of B2B e-commerce into new sectors, such as healthcare and pharmaceuticals, presents lucrative opportunities. Furthermore, the integration of augmented reality (AR) and virtual reality (VR) technologies for product visualization can enhance the customer experience.
Leading Players in the B2B E-Commerce Industry Sector
- DIYTrade com
- IndiaMART InterMESH Ltd
- KOMPASS
- ChinaAseanTrade com
- Flipkart
- Amazon com Inc
- Alibaba Group
- eBay Inc
- eworldtrade com
- Quill Lincolnshire Inc
Key Milestones in B2B E-Commerce Industry Industry
- July 2022: Golf Genius and RepSpark integrated their platforms, streamlining ordering processes for golf shop retailers. This improved efficiency and reduced errors, enhancing customer service.
- August 2022: Razer Merchant Services partnered with Atome to offer Buy Now Pay Later (BNPL) options, increasing accessibility and purchase flexibility for B2B customers.
Strategic Outlook for B2B E-Commerce Industry Market
The future of the B2B e-commerce market is bright, fueled by sustained technological innovation and expanding market penetration. Strategic partnerships, targeted investments in digital infrastructure, and a focus on customer experience will be crucial for success. Businesses that embrace agility, personalization, and data-driven decision-making will be best positioned to capitalize on the immense growth potential of this dynamic sector. The market is poised for continued expansion, driven by factors discussed throughout this report, presenting significant opportunities for both established players and new entrants.
B2B E-Commerce Industry Segmentation
-
1. Channel
- 1.1. Direct Sales
- 1.2. Marketplace Sales
B2B E-Commerce Industry Segmentation By Geography
- 1. North America
- 2. Europe
- 3. Asia Pacific
- 4. Latin America
- 5. Middle East and Africa
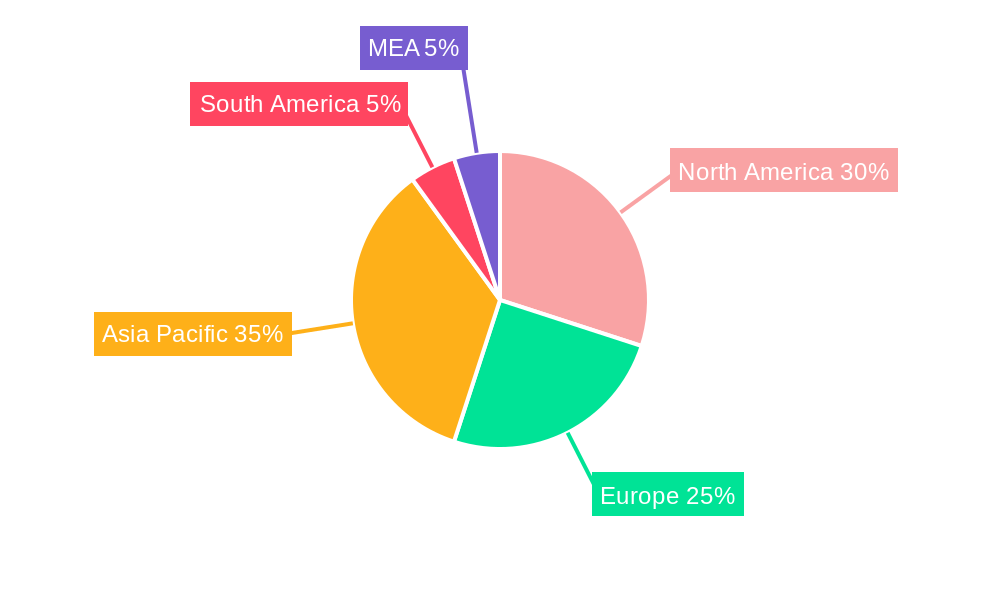
B2B E-Commerce Industry Regional Market Share
Geographic Coverage of B2B E-Commerce Industry
B2B E-Commerce Industry REPORT HIGHLIGHTS
| Aspects | Details |
|---|---|
| Study Period | 2020-2034 |
| Base Year | 2025 |
| Estimated Year | 2026 |
| Forecast Period | 2026-2034 |
| Historical Period | 2020-2025 |
| Growth Rate | CAGR of 12.36% from 2020-2034 |
| Segmentation |
|
Table of Contents
- 1. Introduction
- 1.1. Research Scope
- 1.2. Market Segmentation
- 1.3. Research Methodology
- 1.4. Definitions and Assumptions
- 2. Executive Summary
- 2.1. Introduction
- 3. Market Dynamics
- 3.1. Introduction
- 3.2. Market Drivers
- 3.2.1. Innovative Business Solutions and Increased digitalization in B2B e-commerce; Omnichannel Business Model
- 3.3. Market Restrains
- 3.3.1. Paid version of some applications can challenge further penetration
- 3.4. Market Trends
- 3.4.1. Increase in Digitalization across the B2B e-commerce is driving growth
- 4. Market Factor Analysis
- 4.1. Porters Five Forces
- 4.2. Supply/Value Chain
- 4.3. PESTEL analysis
- 4.4. Market Entropy
- 4.5. Patent/Trademark Analysis
- 5. Global B2B E-Commerce Industry Analysis, Insights and Forecast, 2020-2032
- 5.1. Market Analysis, Insights and Forecast - by Channel
- 5.1.1. Direct Sales
- 5.1.2. Marketplace Sales
- 5.2. Market Analysis, Insights and Forecast - by Region
- 5.2.1. North America
- 5.2.2. Europe
- 5.2.3. Asia Pacific
- 5.2.4. Latin America
- 5.2.5. Middle East and Africa
- 5.1. Market Analysis, Insights and Forecast - by Channel
- 6. North America B2B E-Commerce Industry Analysis, Insights and Forecast, 2020-2032
- 6.1. Market Analysis, Insights and Forecast - by Channel
- 6.1.1. Direct Sales
- 6.1.2. Marketplace Sales
- 6.1. Market Analysis, Insights and Forecast - by Channel
- 7. Europe B2B E-Commerce Industry Analysis, Insights and Forecast, 2020-2032
- 7.1. Market Analysis, Insights and Forecast - by Channel
- 7.1.1. Direct Sales
- 7.1.2. Marketplace Sales
- 7.1. Market Analysis, Insights and Forecast - by Channel
- 8. Asia Pacific B2B E-Commerce Industry Analysis, Insights and Forecast, 2020-2032
- 8.1. Market Analysis, Insights and Forecast - by Channel
- 8.1.1. Direct Sales
- 8.1.2. Marketplace Sales
- 8.1. Market Analysis, Insights and Forecast - by Channel
- 9. Latin America B2B E-Commerce Industry Analysis, Insights and Forecast, 2020-2032
- 9.1. Market Analysis, Insights and Forecast - by Channel
- 9.1.1. Direct Sales
- 9.1.2. Marketplace Sales
- 9.1. Market Analysis, Insights and Forecast - by Channel
- 10. Middle East and Africa B2B E-Commerce Industry Analysis, Insights and Forecast, 2020-2032
- 10.1. Market Analysis, Insights and Forecast - by Channel
- 10.1.1. Direct Sales
- 10.1.2. Marketplace Sales
- 10.1. Market Analysis, Insights and Forecast - by Channel
- 11. Competitive Analysis
- 11.1. Global Market Share Analysis 2025
- 11.2. Company Profiles
- 11.2.1 DIYTrade com
- 11.2.1.1. Overview
- 11.2.1.2. Products
- 11.2.1.3. SWOT Analysis
- 11.2.1.4. Recent Developments
- 11.2.1.5. Financials (Based on Availability)
- 11.2.2 IndiaMART InterMESH Ltd
- 11.2.2.1. Overview
- 11.2.2.2. Products
- 11.2.2.3. SWOT Analysis
- 11.2.2.4. Recent Developments
- 11.2.2.5. Financials (Based on Availability)
- 11.2.3 KOMPASS
- 11.2.3.1. Overview
- 11.2.3.2. Products
- 11.2.3.3. SWOT Analysis
- 11.2.3.4. Recent Developments
- 11.2.3.5. Financials (Based on Availability)
- 11.2.4 ChinaAseanTrade com
- 11.2.4.1. Overview
- 11.2.4.2. Products
- 11.2.4.3. SWOT Analysis
- 11.2.4.4. Recent Developments
- 11.2.4.5. Financials (Based on Availability)
- 11.2.5 Flipkart
- 11.2.5.1. Overview
- 11.2.5.2. Products
- 11.2.5.3. SWOT Analysis
- 11.2.5.4. Recent Developments
- 11.2.5.5. Financials (Based on Availability)
- 11.2.6 Amazon com Inc
- 11.2.6.1. Overview
- 11.2.6.2. Products
- 11.2.6.3. SWOT Analysis
- 11.2.6.4. Recent Developments
- 11.2.6.5. Financials (Based on Availability)
- 11.2.7 Alibaba Group
- 11.2.7.1. Overview
- 11.2.7.2. Products
- 11.2.7.3. SWOT Analysis
- 11.2.7.4. Recent Developments
- 11.2.7.5. Financials (Based on Availability)
- 11.2.8 eBay Inc
- 11.2.8.1. Overview
- 11.2.8.2. Products
- 11.2.8.3. SWOT Analysis
- 11.2.8.4. Recent Developments
- 11.2.8.5. Financials (Based on Availability)
- 11.2.9 eworldtrade com
- 11.2.9.1. Overview
- 11.2.9.2. Products
- 11.2.9.3. SWOT Analysis
- 11.2.9.4. Recent Developments
- 11.2.9.5. Financials (Based on Availability)
- 11.2.10 Quill Lincolnshire Inc
- 11.2.10.1. Overview
- 11.2.10.2. Products
- 11.2.10.3. SWOT Analysis
- 11.2.10.4. Recent Developments
- 11.2.10.5. Financials (Based on Availability)
- 11.2.1 DIYTrade com
List of Figures
- Figure 1: Global B2B E-Commerce Industry Revenue Breakdown (Million, %) by Region 2025 & 2033
- Figure 2: Global B2B E-Commerce Industry Volume Breakdown (K Unit, %) by Region 2025 & 2033
- Figure 3: North America B2B E-Commerce Industry Revenue (Million), by Channel 2025 & 2033
- Figure 4: North America B2B E-Commerce Industry Volume (K Unit), by Channel 2025 & 2033
- Figure 5: North America B2B E-Commerce Industry Revenue Share (%), by Channel 2025 & 2033
- Figure 6: North America B2B E-Commerce Industry Volume Share (%), by Channel 2025 & 2033
- Figure 7: North America B2B E-Commerce Industry Revenue (Million), by Country 2025 & 2033
- Figure 8: North America B2B E-Commerce Industry Volume (K Unit), by Country 2025 & 2033
- Figure 9: North America B2B E-Commerce Industry Revenue Share (%), by Country 2025 & 2033
- Figure 10: North America B2B E-Commerce Industry Volume Share (%), by Country 2025 & 2033
- Figure 11: Europe B2B E-Commerce Industry Revenue (Million), by Channel 2025 & 2033
- Figure 12: Europe B2B E-Commerce Industry Volume (K Unit), by Channel 2025 & 2033
- Figure 13: Europe B2B E-Commerce Industry Revenue Share (%), by Channel 2025 & 2033
- Figure 14: Europe B2B E-Commerce Industry Volume Share (%), by Channel 2025 & 2033
- Figure 15: Europe B2B E-Commerce Industry Revenue (Million), by Country 2025 & 2033
- Figure 16: Europe B2B E-Commerce Industry Volume (K Unit), by Country 2025 & 2033
- Figure 17: Europe B2B E-Commerce Industry Revenue Share (%), by Country 2025 & 2033
- Figure 18: Europe B2B E-Commerce Industry Volume Share (%), by Country 2025 & 2033
- Figure 19: Asia Pacific B2B E-Commerce Industry Revenue (Million), by Channel 2025 & 2033
- Figure 20: Asia Pacific B2B E-Commerce Industry Volume (K Unit), by Channel 2025 & 2033
- Figure 21: Asia Pacific B2B E-Commerce Industry Revenue Share (%), by Channel 2025 & 2033
- Figure 22: Asia Pacific B2B E-Commerce Industry Volume Share (%), by Channel 2025 & 2033
- Figure 23: Asia Pacific B2B E-Commerce Industry Revenue (Million), by Country 2025 & 2033
- Figure 24: Asia Pacific B2B E-Commerce Industry Volume (K Unit), by Country 2025 & 2033
- Figure 25: Asia Pacific B2B E-Commerce Industry Revenue Share (%), by Country 2025 & 2033
- Figure 26: Asia Pacific B2B E-Commerce Industry Volume Share (%), by Country 2025 & 2033
- Figure 27: Latin America B2B E-Commerce Industry Revenue (Million), by Channel 2025 & 2033
- Figure 28: Latin America B2B E-Commerce Industry Volume (K Unit), by Channel 2025 & 2033
- Figure 29: Latin America B2B E-Commerce Industry Revenue Share (%), by Channel 2025 & 2033
- Figure 30: Latin America B2B E-Commerce Industry Volume Share (%), by Channel 2025 & 2033
- Figure 31: Latin America B2B E-Commerce Industry Revenue (Million), by Country 2025 & 2033
- Figure 32: Latin America B2B E-Commerce Industry Volume (K Unit), by Country 2025 & 2033
- Figure 33: Latin America B2B E-Commerce Industry Revenue Share (%), by Country 2025 & 2033
- Figure 34: Latin America B2B E-Commerce Industry Volume Share (%), by Country 2025 & 2033
- Figure 35: Middle East and Africa B2B E-Commerce Industry Revenue (Million), by Channel 2025 & 2033
- Figure 36: Middle East and Africa B2B E-Commerce Industry Volume (K Unit), by Channel 2025 & 2033
- Figure 37: Middle East and Africa B2B E-Commerce Industry Revenue Share (%), by Channel 2025 & 2033
- Figure 38: Middle East and Africa B2B E-Commerce Industry Volume Share (%), by Channel 2025 & 2033
- Figure 39: Middle East and Africa B2B E-Commerce Industry Revenue (Million), by Country 2025 & 2033
- Figure 40: Middle East and Africa B2B E-Commerce Industry Volume (K Unit), by Country 2025 & 2033
- Figure 41: Middle East and Africa B2B E-Commerce Industry Revenue Share (%), by Country 2025 & 2033
- Figure 42: Middle East and Africa B2B E-Commerce Industry Volume Share (%), by Country 2025 & 2033
List of Tables
- Table 1: Global B2B E-Commerce Industry Revenue Million Forecast, by Channel 2020 & 2033
- Table 2: Global B2B E-Commerce Industry Volume K Unit Forecast, by Channel 2020 & 2033
- Table 3: Global B2B E-Commerce Industry Revenue Million Forecast, by Region 2020 & 2033
- Table 4: Global B2B E-Commerce Industry Volume K Unit Forecast, by Region 2020 & 2033
- Table 5: Global B2B E-Commerce Industry Revenue Million Forecast, by Channel 2020 & 2033
- Table 6: Global B2B E-Commerce Industry Volume K Unit Forecast, by Channel 2020 & 2033
- Table 7: Global B2B E-Commerce Industry Revenue Million Forecast, by Country 2020 & 2033
- Table 8: Global B2B E-Commerce Industry Volume K Unit Forecast, by Country 2020 & 2033
- Table 9: Global B2B E-Commerce Industry Revenue Million Forecast, by Channel 2020 & 2033
- Table 10: Global B2B E-Commerce Industry Volume K Unit Forecast, by Channel 2020 & 2033
- Table 11: Global B2B E-Commerce Industry Revenue Million Forecast, by Country 2020 & 2033
- Table 12: Global B2B E-Commerce Industry Volume K Unit Forecast, by Country 2020 & 2033
- Table 13: Global B2B E-Commerce Industry Revenue Million Forecast, by Channel 2020 & 2033
- Table 14: Global B2B E-Commerce Industry Volume K Unit Forecast, by Channel 2020 & 2033
- Table 15: Global B2B E-Commerce Industry Revenue Million Forecast, by Country 2020 & 2033
- Table 16: Global B2B E-Commerce Industry Volume K Unit Forecast, by Country 2020 & 2033
- Table 17: Global B2B E-Commerce Industry Revenue Million Forecast, by Channel 2020 & 2033
- Table 18: Global B2B E-Commerce Industry Volume K Unit Forecast, by Channel 2020 & 2033
- Table 19: Global B2B E-Commerce Industry Revenue Million Forecast, by Country 2020 & 2033
- Table 20: Global B2B E-Commerce Industry Volume K Unit Forecast, by Country 2020 & 2033
- Table 21: Global B2B E-Commerce Industry Revenue Million Forecast, by Channel 2020 & 2033
- Table 22: Global B2B E-Commerce Industry Volume K Unit Forecast, by Channel 2020 & 2033
- Table 23: Global B2B E-Commerce Industry Revenue Million Forecast, by Country 2020 & 2033
- Table 24: Global B2B E-Commerce Industry Volume K Unit Forecast, by Country 2020 & 2033
Frequently Asked Questions
1. What is the projected Compound Annual Growth Rate (CAGR) of the B2B E-Commerce Industry?
The projected CAGR is approximately 12.36%.
2. Which companies are prominent players in the B2B E-Commerce Industry?
Key companies in the market include DIYTrade com, IndiaMART InterMESH Ltd, KOMPASS, ChinaAseanTrade com, Flipkart, Amazon com Inc, Alibaba Group, eBay Inc, eworldtrade com, Quill Lincolnshire Inc.
3. What are the main segments of the B2B E-Commerce Industry?
The market segments include Channel.
4. Can you provide details about the market size?
The market size is estimated to be USD XX Million as of 2022.
5. What are some drivers contributing to market growth?
Innovative Business Solutions and Increased digitalization in B2B e-commerce; Omnichannel Business Model.
6. What are the notable trends driving market growth?
Increase in Digitalization across the B2B e-commerce is driving growth.
7. Are there any restraints impacting market growth?
Paid version of some applications can challenge further penetration.
8. Can you provide examples of recent developments in the market?
August 2022 - Razer Merchant Services (RMS), the B2B arm of Razer Fintech, partnered with Atome, an Asia-based Buy Now Pay Later (BNPL) service. This partnership is aimed to enable flexible deferred payment acceptance during checkout at online and offline RMS merchants.
9. What pricing options are available for accessing the report?
Pricing options include single-user, multi-user, and enterprise licenses priced at USD 4750, USD 5250, and USD 8750 respectively.
10. Is the market size provided in terms of value or volume?
The market size is provided in terms of value, measured in Million and volume, measured in K Unit.
11. Are there any specific market keywords associated with the report?
Yes, the market keyword associated with the report is "B2B E-Commerce Industry," which aids in identifying and referencing the specific market segment covered.
12. How do I determine which pricing option suits my needs best?
The pricing options vary based on user requirements and access needs. Individual users may opt for single-user licenses, while businesses requiring broader access may choose multi-user or enterprise licenses for cost-effective access to the report.
13. Are there any additional resources or data provided in the B2B E-Commerce Industry report?
While the report offers comprehensive insights, it's advisable to review the specific contents or supplementary materials provided to ascertain if additional resources or data are available.
14. How can I stay updated on further developments or reports in the B2B E-Commerce Industry?
To stay informed about further developments, trends, and reports in the B2B E-Commerce Industry, consider subscribing to industry newsletters, following relevant companies and organizations, or regularly checking reputable industry news sources and publications.
Methodology
Step 1 - Identification of Relevant Samples Size from Population Database


Step 2 - Approaches for Defining Global Market Size (Value, Volume* & Price*)

Note*: In applicable scenarios
Step 3 - Data Sources
Primary Research
- Web Analytics
- Survey Reports
- Research Institute
- Latest Research Reports
- Opinion Leaders
Secondary Research
- Annual Reports
- White Paper
- Latest Press Release
- Industry Association
- Paid Database
- Investor Presentations

Step 4 - Data Triangulation
Involves using different sources of information in order to increase the validity of a study
These sources are likely to be stakeholders in a program - participants, other researchers, program staff, other community members, and so on.
Then we put all data in single framework & apply various statistical tools to find out the dynamic on the market.
During the analysis stage, feedback from the stakeholder groups would be compared to determine areas of agreement as well as areas of divergence