

Key Insights
The Croatian e-commerce market is poised for substantial growth, projected to reach $4.96 billion by 2033, with a Compound Annual Growth Rate (CAGR) of 7.4% from the base year 2024. This expansion is fueled by rising internet and smartphone penetration, a tech-savvy younger demographic, and increasing consumer preference for online convenience and product variety. Enhancements in logistics and secure online payment systems are further accelerating this trend. Key growth drivers include increasing consumer confidence in online transactions, expanded product availability, and advancements in digital infrastructure. While a relatively smaller domestic market and concerns about data security present challenges, the overall outlook remains exceptionally positive. The market's segmentation by application highlights diverse online shopping behaviors, creating targeted opportunities for specialized e-commerce businesses. Leading players like Sancta Domenica, Pevex, and Notino are well-positioned to capitalize on this dynamic market, despite intense competition.
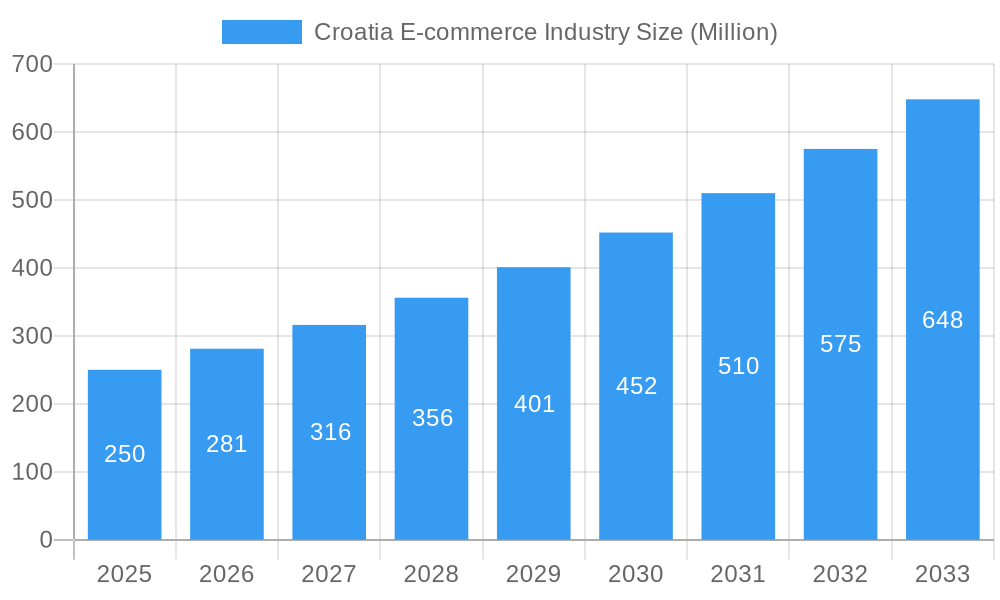
Croatia E-commerce Industry Market Size (In Billion)
Croatia E-commerce Industry: A Comprehensive Market Report (2019-2033)
This in-depth report provides a comprehensive analysis of the Croatian e-commerce industry, covering market dynamics, key players, growth drivers, and future opportunities. The study period spans from 2019 to 2033, with 2025 serving as both the base and estimated year. This report is essential for industry stakeholders, investors, and businesses seeking to understand and capitalize on the evolving Croatian e-commerce landscape. The market size is projected to reach xx Million by 2025, exhibiting a CAGR of xx% during the forecast period (2025-2033).
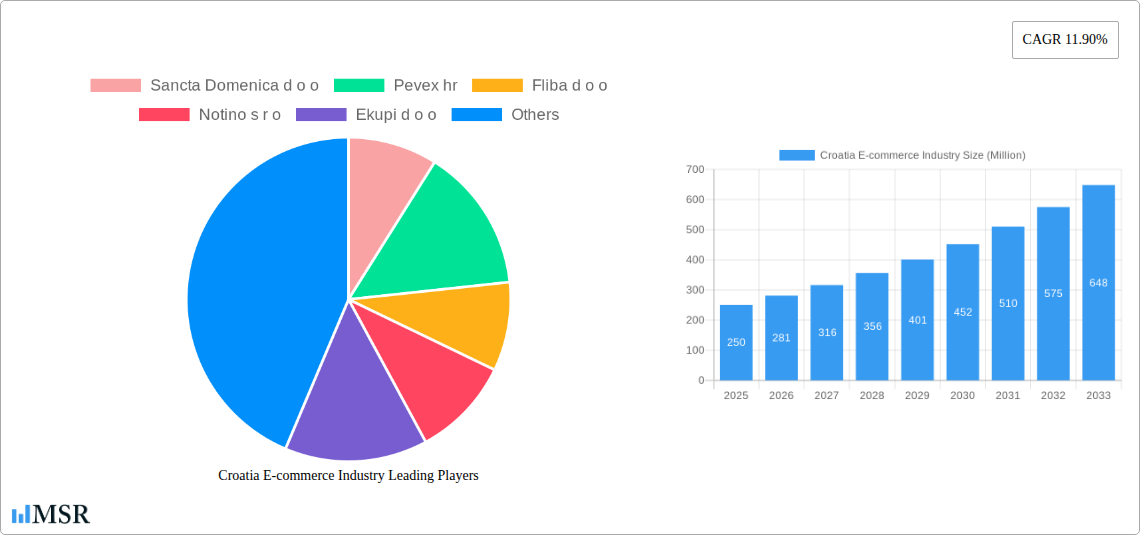
Croatia E-commerce Industry Company Market Share
Croatia E-commerce Industry Market Concentration & Dynamics
The Croatian e-commerce market exhibits a moderately concentrated structure, with a few dominant players controlling a significant market share. However, a vibrant ecosystem of smaller players and startups fosters innovation and competition. The market is influenced by various factors including:
Market Concentration: While precise market share data for individual players like Sancta Domenica d o o, Pevex hr, Fliba d o o, Notino s r o, Ekupi d o o, Sensus Grupa d o o, Emmezeta, Instar Informatika d o o, Bauhaus hr, and Prati Me d o o is unavailable, industry analysis suggests a few key players hold a considerable portion of the overall market. The remaining share is distributed among numerous smaller companies, indicating a somewhat fragmented landscape beyond the top players. Precise figures require further primary research.
Innovation Ecosystems: The Croatian e-commerce sector benefits from a growing startup scene, supported by incubators and accelerators. Technological advancements, particularly in mobile commerce and logistics, drive innovation.
Regulatory Frameworks: While relatively stable, regulatory changes concerning data privacy, consumer protection, and taxation can impact market dynamics. Understanding the evolving regulatory landscape is crucial for businesses.
Substitute Products: Traditional brick-and-mortar stores remain a significant competitor, though the e-commerce sector continues to gain traction, particularly among younger demographics.
End-User Trends: Growing internet penetration and smartphone usage fuel e-commerce adoption. Consumer preferences are shifting towards convenience, personalized experiences, and seamless omnichannel shopping journeys.
M&A Activities: The number of mergers and acquisitions in the Croatian e-commerce sector from 2019-2024 was approximately xx, reflecting consolidation and strategic expansion efforts within the industry. The exact number varies depending on reporting standards and the included companies.
Croatia E-commerce Industry Industry Insights & Trends
The Croatian e-commerce market has witnessed significant growth fueled by various factors. The increasing adoption of e-commerce platforms by businesses of all sizes is a significant driver. Further driving market expansion is the rise of mobile commerce and the increasing comfort level of consumers with online transactions. Technological disruptions like the introduction of advanced logistics solutions are changing the industry landscape. Consumer behaviour is shifting to demand more personalized experiences and faster delivery options, forcing e-commerce players to adapt and innovate. The impact of the COVID-19 pandemic accelerated the transition to online shopping, further solidifying the growth trajectory of the Croatian e-commerce market.
The market size is projected to reach xx Million by 2025 and xx Million by 2033, reflecting a significant overall expansion. The current market share is broadly distributed amongst large established players and a growing segment of small and medium-sized businesses, indicating both market concentration and competition.
Key Markets & Segments Leading Croatia E-commerce Industry
While granular data on specific market segmentation by application is limited, anecdotal evidence and industry reports suggest that the most significant segment is likely consumer goods (e.g., fashion, electronics, groceries). This dominance is due to:
Drivers:
- Rising Disposable Incomes: Increased purchasing power allows for higher e-commerce spending.
- Improved Logistics Infrastructure: Enhanced delivery networks support efficient e-commerce operations.
- Growing Internet & Smartphone Penetration: Widespread access to the internet and mobile devices fuels online shopping adoption.
Dominance Analysis: The consumer goods segment's dominance is driven by its broad appeal and high demand. Other segments, like B2B e-commerce, though growing, are smaller in scale compared to the consumer goods sector in Croatia. Detailed analysis requires access to more granular market segmentation data.
Croatia E-commerce Industry Product Developments
Recent product innovations have primarily focused on enhancing user experience and improving logistics. Improvements to online storefronts, personalized recommendations, advanced search functionalities, and integrated payment gateways are transforming the shopping experience. Likewise, investments in last-mile delivery solutions and innovative warehousing technologies are bolstering efficiency and speed in delivery. These improvements give businesses a competitive edge, fostering customer loyalty and driving sales.
Challenges in the Croatia E-commerce Industry Market
Several challenges hinder the growth of the Croatian e-commerce industry. These include:
- Regulatory Hurdles: Navigating complex regulations related to data privacy, consumer protection, and taxation can be cumbersome.
- Supply Chain Issues: Efficient and reliable logistics networks are essential, especially for rural areas. Current infrastructure may require upgrades and improvements.
- Competitive Pressures: Intense competition among both established players and new entrants requires constant innovation and adaptation.
Forces Driving Croatia E-commerce Industry Growth
Several factors are driving the growth of the Croatian e-commerce market:
- Technological Advancements: Mobile commerce, improved payment gateways, and advanced logistics solutions are significantly enhancing online shopping.
- Economic Growth: Increasing disposable incomes and a growing middle class fuel consumer spending, including online purchases.
- Government Support: Government initiatives promoting digitalization and e-commerce facilitate market development.
Long-Term Growth Catalysts in the Croatia E-commerce Industry Market
Long-term growth in the Croatian e-commerce industry hinges on continued innovation, strategic partnerships, and market expansion. Investments in artificial intelligence, machine learning for personalized experiences, and the integration of augmented/virtual reality technologies will be critical. Strategic collaborations between e-commerce players and logistics providers can streamline operations and enhance customer satisfaction. Finally, expansion into new market segments, such as B2B e-commerce, and targeting international markets will provide significant growth potential.
Emerging Opportunities in Croatia E-commerce Industry
Emerging opportunities lie in:
- Niche Market Exploration: Targeting underserved consumer segments with specialized products and services.
- Cross-border E-commerce: Expanding into neighboring markets within the EU to tap into wider consumer bases.
- Sustainable E-commerce Practices: Adopting environmentally friendly solutions within the supply chain to attract environmentally conscious consumers.
Leading Players in the Croatia E-commerce Industry Sector
- Sancta Domenica d o o
- Pevex hr
- Fliba d o o
- Notino s r o
- Ekupi d o o
- Sensus Grupa d o o
- Emmezeta
- Instar Informatika d o o
- Bauhaus hr
- Prati Me d o o
Key Milestones in Croatia E-commerce Industry Industry
- May 2022: The Croatian KupiMe platform, known for group shopping and coupon sales, invested significantly in expansion and developed specialized e-commerce software, marking a significant entry into the sector leveraging its established customer base.
Strategic Outlook for Croatia E-commerce Industry Market
The Croatian e-commerce market presents significant long-term growth potential, driven by increasing digital literacy, rising disposable incomes, and favorable government policies. Strategic opportunities lie in focusing on personalized shopping experiences, optimizing logistics, and exploring new market segments. Companies that leverage technology and adapt to evolving consumer preferences are poised for success in this dynamic market.
Croatia E-commerce Industry Segmentation
-
1. B2C E-Commerce
- 1.1. Market size (GMV) for the period of 2017-2027
-
1.2. Market Segmentation - By Application
- 1.2.1. Beauty & Personal Care
- 1.2.2. Consumer Electronics
- 1.2.3. Fashion & Apparel
- 1.2.4. Food & Beverage
- 1.2.5. Furniture & Home
- 1.2.6. Others (Toys, DIY, Media, etc.)
- 2. Market size (GMV) for the period of 2017-2027
-
3. Application
- 3.1. Beauty & Personal Care
- 3.2. Consumer Electronics
- 3.3. Fashion & Apparel
- 3.4. Food & Beverage
- 3.5. Furniture & Home
- 3.6. Others (Toys, DIY, Media, etc.)
- 4. Beauty & Personal Care
- 5. Consumer Electronics
- 6. Fashion & Apparel
- 7. Food & Beverage
- 8. Furniture & Home
- 9. Others (Toys, DIY, Media, etc.)
-
10. B2B E-Commerce
- 10.1. Market size for the period of 2017-2027
Croatia E-commerce Industry Segmentation By Geography
- 1. Croatia
Croatia E-commerce Industry Regional Market Share
Geographic Coverage of Croatia E-commerce Industry
Croatia E-commerce Industry REPORT HIGHLIGHTS
| Aspects | Details |
|---|---|
| Study Period | 2020-2034 |
| Base Year | 2025 |
| Estimated Year | 2026 |
| Forecast Period | 2026-2034 |
| Historical Period | 2020-2025 |
| Growth Rate | CAGR of 7.4% from 2020-2034 |
| Segmentation |
|
Table of Contents
- 1. Introduction
- 1.1. Research Scope
- 1.2. Market Segmentation
- 1.3. Research Objective
- 1.4. Definitions and Assumptions
- 2. Executive Summary
- 2.1. Market Snapshot
- 3. Market Dynamics
- 3.1. Market Drivers
- 3.2. Market Restrains
- 3.3. Market Trends
- 3.4. Market Opportunities
- 4. Market Factor Analysis
- 4.1. Porters Five Forces
- 4.1.1. Bargaining Power of Suppliers
- 4.1.2. Bargaining Power of Buyers
- 4.1.3. Threat of New Entrants
- 4.1.4. Threat of Substitutes
- 4.1.5. Competitive Rivalry
- 4.2. PESTEL analysis
- 4.3. BCG Analysis
- 4.3.1. Stars (High Growth, High Market Share)
- 4.3.2. Cash Cows (Low Growth, High Market Share)
- 4.3.3. Question Mark (High Growth, Low Market Share)
- 4.3.4. Dogs (Low Growth, Low Market Share)
- 4.4. Ansoff Matrix Analysis
- 4.5. Supply Chain Analysis
- 4.6. Regulatory Landscape
- 4.7. Current Market Potential and Opportunity Assessment (TAM–SAM–SOM Framework)
- 4.8. MSR Analyst Note
- 4.1. Porters Five Forces
- 5. Market Analysis, Insights and Forecast 2021-2033
- 5.1. Market Analysis, Insights and Forecast - by B2C E-Commerce
- 5.1.1. Market size (GMV) for the period of 2017-2027
- 5.1.2. Market Segmentation - By Application
- 5.1.2.1. Beauty & Personal Care
- 5.1.2.2. Consumer Electronics
- 5.1.2.3. Fashion & Apparel
- 5.1.2.4. Food & Beverage
- 5.1.2.5. Furniture & Home
- 5.1.2.6. Others (Toys, DIY, Media, etc.)
- 5.2. Market Analysis, Insights and Forecast - by Market size (GMV) for the period of 2017-2027
- 5.3. Market Analysis, Insights and Forecast - by Application
- 5.3.1. Beauty & Personal Care
- 5.3.2. Consumer Electronics
- 5.3.3. Fashion & Apparel
- 5.3.4. Food & Beverage
- 5.3.5. Furniture & Home
- 5.3.6. Others (Toys, DIY, Media, etc.)
- 5.4. Market Analysis, Insights and Forecast - by Beauty & Personal Care
- 5.5. Market Analysis, Insights and Forecast - by Consumer Electronics
- 5.6. Market Analysis, Insights and Forecast - by Fashion & Apparel
- 5.7. Market Analysis, Insights and Forecast - by Food & Beverage
- 5.8. Market Analysis, Insights and Forecast - by Furniture & Home
- 5.9. Market Analysis, Insights and Forecast - by Others (Toys, DIY, Media, etc.)
- 5.10. Market Analysis, Insights and Forecast - by B2B E-Commerce
- 5.10.1. Market size for the period of 2017-2027
- 5.11. Market Analysis, Insights and Forecast - by Region
- 5.11.1. Croatia
- 5.1. Market Analysis, Insights and Forecast - by B2C E-Commerce
- 6. Croatia E-commerce Industry Analysis, Insights and Forecast, 2021-2033
- 6.1. Market Analysis, Insights and Forecast - by B2C E-Commerce
- 6.1.1. Market size (GMV) for the period of 2017-2027
- 6.1.2. Market Segmentation - By Application
- 6.1.2.1. Beauty & Personal Care
- 6.1.2.2. Consumer Electronics
- 6.1.2.3. Fashion & Apparel
- 6.1.2.4. Food & Beverage
- 6.1.2.5. Furniture & Home
- 6.1.2.6. Others (Toys, DIY, Media, etc.)
- 6.2. Market Analysis, Insights and Forecast - by Market size (GMV) for the period of 2017-2027
- 6.3. Market Analysis, Insights and Forecast - by Application
- 6.3.1. Beauty & Personal Care
- 6.3.2. Consumer Electronics
- 6.3.3. Fashion & Apparel
- 6.3.4. Food & Beverage
- 6.3.5. Furniture & Home
- 6.3.6. Others (Toys, DIY, Media, etc.)
- 6.4. Market Analysis, Insights and Forecast - by Beauty & Personal Care
- 6.5. Market Analysis, Insights and Forecast - by Consumer Electronics
- 6.6. Market Analysis, Insights and Forecast - by Fashion & Apparel
- 6.7. Market Analysis, Insights and Forecast - by Food & Beverage
- 6.8. Market Analysis, Insights and Forecast - by Furniture & Home
- 6.9. Market Analysis, Insights and Forecast - by Others (Toys, DIY, Media, etc.)
- 6.10. Market Analysis, Insights and Forecast - by B2B E-Commerce
- 6.10.1. Market size for the period of 2017-2027
- 6.1. Market Analysis, Insights and Forecast - by B2C E-Commerce
- 7. Competitive Analysis
- 7.1. Company Profiles
- 7.1.1 Sancta Domenica d o o
- 7.1.1.1. Company Overview
- 7.1.1.2. Products
- 7.1.1.3. Company Financials
- 7.1.1.4. SWOT Analysis
- 7.1.2 Pevex hr
- 7.1.2.1. Company Overview
- 7.1.2.2. Products
- 7.1.2.3. Company Financials
- 7.1.2.4. SWOT Analysis
- 7.1.3 Fliba d o o
- 7.1.3.1. Company Overview
- 7.1.3.2. Products
- 7.1.3.3. Company Financials
- 7.1.3.4. SWOT Analysis
- 7.1.4 Notino s r o
- 7.1.4.1. Company Overview
- 7.1.4.2. Products
- 7.1.4.3. Company Financials
- 7.1.4.4. SWOT Analysis
- 7.1.5 Ekupi d o o
- 7.1.5.1. Company Overview
- 7.1.5.2. Products
- 7.1.5.3. Company Financials
- 7.1.5.4. SWOT Analysis
- 7.1.6 Sensus Grupa d o o
- 7.1.6.1. Company Overview
- 7.1.6.2. Products
- 7.1.6.3. Company Financials
- 7.1.6.4. SWOT Analysis
- 7.1.7 Emmezeta*List Not Exhaustive
- 7.1.7.1. Company Overview
- 7.1.7.2. Products
- 7.1.7.3. Company Financials
- 7.1.7.4. SWOT Analysis
- 7.1.8 Instar Informatika d o o
- 7.1.8.1. Company Overview
- 7.1.8.2. Products
- 7.1.8.3. Company Financials
- 7.1.8.4. SWOT Analysis
- 7.1.9 Bauhaus hr
- 7.1.9.1. Company Overview
- 7.1.9.2. Products
- 7.1.9.3. Company Financials
- 7.1.9.4. SWOT Analysis
- 7.1.10 Prati Me d o o
- 7.1.10.1. Company Overview
- 7.1.10.2. Products
- 7.1.10.3. Company Financials
- 7.1.10.4. SWOT Analysis
- 7.1.1 Sancta Domenica d o o
- 7.2. Market Entropy
- 7.2.1 Company's Key Areas Served
- 7.2.2 Recent Developments
- 7.3. Company Market Share Analysis 2025
- 7.3.1 Top 5 Companies Market Share Analysis
- 7.3.2 Top 3 Companies Market Share Analysis
- 7.4. List of Potential Customers
- 8. Research Methodology
List of Figures
- Figure 1: Croatia E-commerce Industry Revenue Breakdown (billion, %) by Product 2025 & 2033
- Figure 2: Croatia E-commerce Industry Share (%) by Company 2025
List of Tables
- Table 1: Croatia E-commerce Industry Revenue billion Forecast, by B2C E-Commerce 2020 & 2033
- Table 2: Croatia E-commerce Industry Revenue billion Forecast, by Market size (GMV) for the period of 2017-2027 2020 & 2033
- Table 3: Croatia E-commerce Industry Revenue billion Forecast, by Application 2020 & 2033
- Table 4: Croatia E-commerce Industry Revenue billion Forecast, by Beauty & Personal Care 2020 & 2033
- Table 5: Croatia E-commerce Industry Revenue billion Forecast, by Consumer Electronics 2020 & 2033
- Table 6: Croatia E-commerce Industry Revenue billion Forecast, by Fashion & Apparel 2020 & 2033
- Table 7: Croatia E-commerce Industry Revenue billion Forecast, by Food & Beverage 2020 & 2033
- Table 8: Croatia E-commerce Industry Revenue billion Forecast, by Furniture & Home 2020 & 2033
- Table 9: Croatia E-commerce Industry Revenue billion Forecast, by Others (Toys, DIY, Media, etc.) 2020 & 2033
- Table 10: Croatia E-commerce Industry Revenue billion Forecast, by B2B E-Commerce 2020 & 2033
- Table 11: Croatia E-commerce Industry Revenue billion Forecast, by Region 2020 & 2033
- Table 12: Croatia E-commerce Industry Revenue billion Forecast, by B2C E-Commerce 2020 & 2033
- Table 13: Croatia E-commerce Industry Revenue billion Forecast, by Market size (GMV) for the period of 2017-2027 2020 & 2033
- Table 14: Croatia E-commerce Industry Revenue billion Forecast, by Application 2020 & 2033
- Table 15: Croatia E-commerce Industry Revenue billion Forecast, by Beauty & Personal Care 2020 & 2033
- Table 16: Croatia E-commerce Industry Revenue billion Forecast, by Consumer Electronics 2020 & 2033
- Table 17: Croatia E-commerce Industry Revenue billion Forecast, by Fashion & Apparel 2020 & 2033
- Table 18: Croatia E-commerce Industry Revenue billion Forecast, by Food & Beverage 2020 & 2033
- Table 19: Croatia E-commerce Industry Revenue billion Forecast, by Furniture & Home 2020 & 2033
- Table 20: Croatia E-commerce Industry Revenue billion Forecast, by Others (Toys, DIY, Media, etc.) 2020 & 2033
- Table 21: Croatia E-commerce Industry Revenue billion Forecast, by B2B E-Commerce 2020 & 2033
- Table 22: Croatia E-commerce Industry Revenue billion Forecast, by Country 2020 & 2033
Frequently Asked Questions
1. What is the projected Compound Annual Growth Rate (CAGR) of the Croatia E-commerce Industry?
The projected CAGR is approximately 7.4%.
2. Which companies are prominent players in the Croatia E-commerce Industry?
Key companies in the market include Sancta Domenica d o o, Pevex hr, Fliba d o o, Notino s r o, Ekupi d o o, Sensus Grupa d o o, Emmezeta*List Not Exhaustive, Instar Informatika d o o, Bauhaus hr, Prati Me d o o.
3. What are the main segments of the Croatia E-commerce Industry?
The market segments include B2C E-Commerce, Market size (GMV) for the period of 2017-2027, Application, Beauty & Personal Care, Consumer Electronics, Fashion & Apparel, Food & Beverage, Furniture & Home, Others (Toys, DIY, Media, etc.), B2B E-Commerce.
4. Can you provide details about the market size?
The market size is estimated to be USD 4.96 billion as of 2022.
5. What are some drivers contributing to market growth?
Rise in trustworthiness of online stores; Croatia people appreciate local brands and support local entrepreneurs.
6. What are the notable trends driving market growth?
Smart Phones and Social Media users holds the highest share in Online Shopping.
7. Are there any restraints impacting market growth?
Low Light Sensing Capabilities Act as a Restraining Factor; Low-cost Sensors are Increasing the Threat to Scale Down the Quality.
8. Can you provide examples of recent developments in the market?
May 2022 - The Croatian KupiMe platform, which is known for being the country's first of its kind and is primarily focused on group shopping and coupon sales, has recently invested significant funds in business expansion and the development of specialised software for online shopping (e-commerce). The Croatian KupiMe platform opted to expand its business into the fast-growing e-commerce sector, leveraging its many years of experience in the coupon sales market.
9. What pricing options are available for accessing the report?
Pricing options include single-user, multi-user, and enterprise licenses priced at USD 3800, USD 4500, and USD 5800 respectively.
10. Is the market size provided in terms of value or volume?
The market size is provided in terms of value, measured in billion.
11. Are there any specific market keywords associated with the report?
Yes, the market keyword associated with the report is "Croatia E-commerce Industry," which aids in identifying and referencing the specific market segment covered.
12. How do I determine which pricing option suits my needs best?
The pricing options vary based on user requirements and access needs. Individual users may opt for single-user licenses, while businesses requiring broader access may choose multi-user or enterprise licenses for cost-effective access to the report.
13. Are there any additional resources or data provided in the Croatia E-commerce Industry report?
While the report offers comprehensive insights, it's advisable to review the specific contents or supplementary materials provided to ascertain if additional resources or data are available.
14. How can I stay updated on further developments or reports in the Croatia E-commerce Industry?
To stay informed about further developments, trends, and reports in the Croatia E-commerce Industry, consider subscribing to industry newsletters, following relevant companies and organizations, or regularly checking reputable industry news sources and publications.
Methodology
Step 1 - Identification of Relevant Samples Size from Population Database


Step 2 - Approaches for Defining Global Market Size (Value, Volume* & Price*)

Note*: In applicable scenarios
Step 3 - Data Sources
Primary Research
- Web Analytics
- Survey Reports
- Research Institute
- Latest Research Reports
- Opinion Leaders
Secondary Research
- Annual Reports
- White Paper
- Latest Press Release
- Industry Association
- Paid Database
- Investor Presentations

Step 4 - Data Triangulation
Involves using different sources of information in order to increase the validity of a study
These sources are likely to be stakeholders in a program - participants, other researchers, program staff, other community members, and so on.
Then we put all data in single framework & apply various statistical tools to find out the dynamic on the market.
During the analysis stage, feedback from the stakeholder groups would be compared to determine areas of agreement as well as areas of divergence