
Key Insights
The Global Real-World Evidence (RWE) Solutions market is experiencing robust growth, projected to reach a substantial size, driven by the increasing demand for more efficient and cost-effective drug development and regulatory processes. The market's Compound Annual Growth Rate (CAGR) of 9.40% from 2019 to 2024 indicates a strong upward trajectory. Key drivers include the rising adoption of digital health technologies, the expanding use of electronic health records (EHRs), and the growing focus on patient-centric care. The increasing prevalence of chronic diseases, coupled with the need for faster drug approvals and post-market surveillance, further fuels market expansion. The market segmentation reveals a strong contribution from oncology, immunology, and cardiology therapeutic areas, with healthcare payers and providers being major end-users. North America currently holds a significant market share due to advanced healthcare infrastructure and regulatory frameworks conducive to RWE adoption. However, rapidly developing healthcare systems in Asia-Pacific and Europe are expected to drive regional growth in the coming years. The integration of diverse data sources, such as claims data, clinical settings data, and patient-powered data, is crucial for generating meaningful insights and supporting evidence-based healthcare decisions. Competitive players in this space are continually innovating to enhance data analytics capabilities and provide comprehensive solutions.
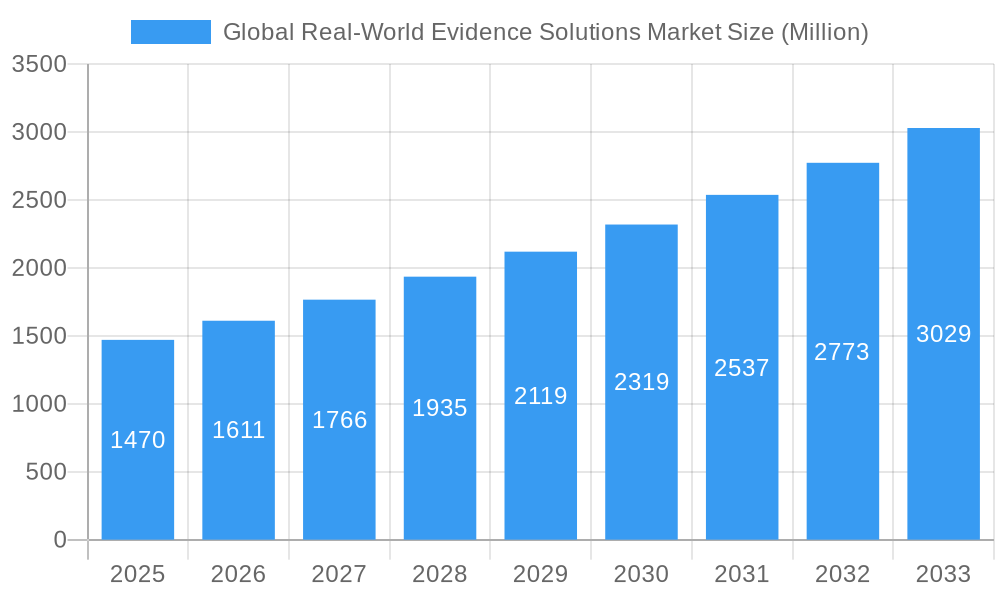
Global Real-World Evidence Solutions Market Market Size (In Billion)
The forecast period (2025-2033) suggests continued growth, potentially exceeding the initial projection if the pace of technological advancements and regulatory support remains consistent. Challenges include data privacy concerns, interoperability issues among different data sources, and the need for standardized data collection and analysis methodologies. Despite these hurdles, the long-term outlook remains positive, with the RWE market poised to play a pivotal role in shaping future healthcare strategies and accelerating the development of new therapies. The increasing collaboration between pharmaceutical companies, healthcare providers, and technology companies is expected to further accelerate market growth and improve access to timely and relevant insights. This market is likely to witness consolidation as larger players acquire smaller companies to expand their service offerings and gain access to specialized expertise.
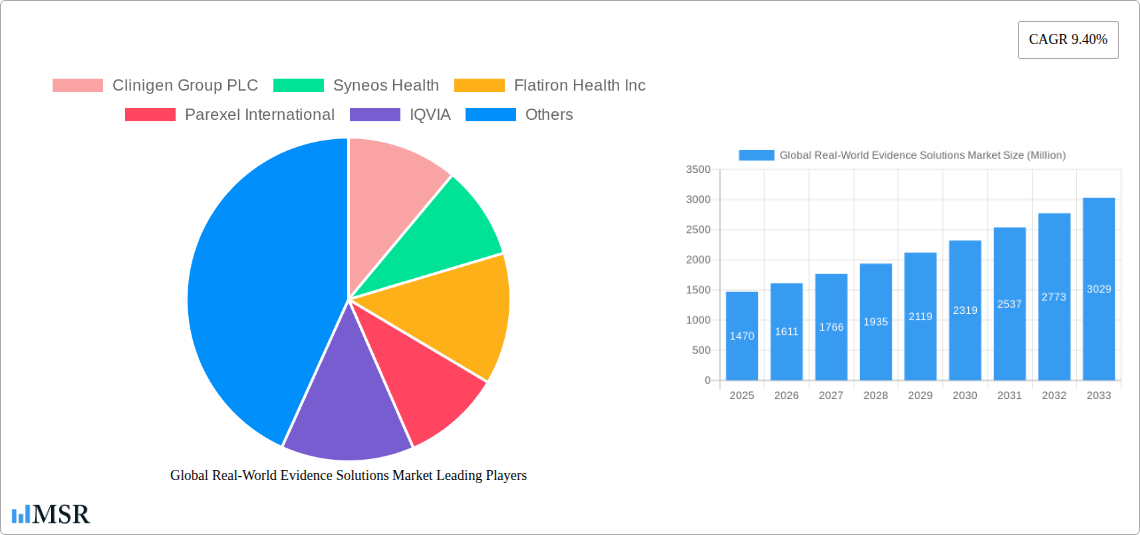
Global Real-World Evidence Solutions Market Company Market Share
Global Real-World Evidence Solutions Market: A Comprehensive Report (2019-2033)
This in-depth report provides a comprehensive analysis of the Global Real-World Evidence (RWE) Solutions Market, offering invaluable insights for stakeholders across the healthcare and pharmaceutical industries. With a study period spanning 2019-2033, a base year of 2025, and a forecast period of 2025-2033, this report meticulously examines market dynamics, key segments, leading players, and emerging opportunities. The market is projected to reach xx Million by 2033, exhibiting a CAGR of xx% during the forecast period.
Global Real-World Evidence Solutions Market Market Concentration & Dynamics
The Global Real-World Evidence Solutions Market is characterized by a moderately concentrated landscape, with key players holding significant market share. The market exhibits strong innovation, driven by advancements in data analytics, AI, and cloud computing. Regulatory frameworks, while evolving, play a crucial role in shaping market growth and data privacy. Substitute products, such as traditional clinical trials, still exist, but RWE solutions are gaining traction due to their cost-effectiveness and ability to generate real-world insights. End-user trends indicate an increasing preference for integrated RWE solutions that offer comprehensive data analysis and reporting capabilities. The market has witnessed a considerable number of M&A activities in recent years, reflecting the strategic importance of RWE solutions.
- Market Concentration: The top 5 players hold approximately xx% of the market share in 2025.
- M&A Activity: The number of M&A deals in the RWE solutions market increased by xx% between 2020 and 2024.
- Innovation Ecosystems: Strong collaborations between technology providers, pharmaceutical companies, and healthcare providers are driving innovation.
- Regulatory Frameworks: The evolving regulatory landscape focusing on data privacy and security presents both challenges and opportunities.
Global Real-World Evidence Solutions Market Industry Insights & Trends
The Global Real-World Evidence Solutions Market is experiencing robust growth, driven by several factors. The increasing adoption of RWE by pharmaceutical and medical device companies for drug development and post-market surveillance is a key driver. Technological advancements, particularly in big data analytics and artificial intelligence (AI), are enhancing the capabilities of RWE solutions, enabling more sophisticated analyses and insights. Evolving consumer behaviors, including increased patient engagement and the rise of digital health, are also fueling market growth. Furthermore, the rising prevalence of chronic diseases and the need for cost-effective healthcare solutions are contributing to the market expansion. The market size in 2025 is estimated at xx Million, projected to reach xx Million by 2033.
Key Markets & Segments Leading Global Real-World Evidence Solutions Market
The North American region currently dominates the global RWE solutions market, driven by strong regulatory support, advanced healthcare infrastructure, and high adoption rates among pharmaceutical and healthcare companies. Within the segment breakdown:
Component: Claims data is the largest component segment, owing to its wide availability and established infrastructure.
Therapeutic Area: Oncology leads in terms of RWE solution adoption due to the high cost of treatment and the need for improved treatment outcomes.
End User: Pharmaceutical & Medical Device Companies constitute the largest end-user segment, driving demand for RWE solutions to support drug development and post-market surveillance.
Drivers for North American Dominance:
- Advanced healthcare infrastructure
- Strong regulatory support for RWE
- High adoption rates by pharmaceutical and healthcare companies
- Significant investments in technology and data analytics
The European market is also showing significant growth, fueled by increasing investments in digital health initiatives and supportive regulatory frameworks. Asia-Pacific is expected to witness the fastest growth rate during the forecast period, driven by rising healthcare spending and increasing awareness of RWE's potential.
Global Real-World Evidence Solutions Market Product Developments
Recent product innovations in the RWE solutions market focus on enhancing data integration, analytical capabilities, and reporting functionalities. Advancements in AI and machine learning are enabling more sophisticated data analysis, leading to improved insights into treatment effectiveness and patient outcomes. These advancements provide competitive edges by offering more accurate predictions, personalized medicine approaches, and ultimately, better healthcare solutions.
Challenges in the Global Real-World Evidence Solutions Market Market
The RWE solutions market faces several challenges, including stringent regulatory requirements regarding data privacy and security, which can hinder market penetration. Ensuring data quality and interoperability across diverse data sources also presents a significant hurdle. Furthermore, the market is experiencing increasing competitive pressures, particularly from established players and emerging technology providers. These challenges impact overall market growth and profitability. The total impact of these challenges represents an estimated xx% reduction in market growth potential.
Forces Driving Global Real-World Evidence Solutions Market Growth
Several factors contribute to the market's growth, including the increasing demand for evidence-based medicine and the rising prevalence of chronic diseases. Technological advancements, such as AI and machine learning, are improving data analysis capabilities, providing more meaningful insights. Government initiatives promoting the use of RWE in healthcare are also driving market expansion. The growing focus on personalized medicine further fuels the need for real-world data to tailor treatment strategies.
Challenges in the Global Real-World Evidence Solutions Market Market
Long-term growth will be fueled by ongoing technological innovations, particularly in AI and machine learning, further enhancing the analytical capabilities of RWE solutions. Strategic partnerships between technology providers, pharmaceutical companies, and healthcare providers will also drive market expansion. Expansion into new geographic markets, particularly in developing countries, presents a significant opportunity for future growth.
Emerging Opportunities in Global Real-World Evidence Solutions Market
Emerging opportunities exist in areas such as predictive modeling, personalized medicine, and patient-centric outcomes research. The integration of wearable sensor data into RWE studies presents a promising avenue for generating more granular and timely insights into patient health. Expansion into new therapeutic areas, such as rare diseases and mental health, offers significant growth potential. The increasing demand for decentralized clinical trials opens up new opportunities for RWE providers.
Leading Players in the Global Real-World Evidence Solutions Market Sector
Key Milestones in Global Real-World Evidence Solutions Market Industry
- December 2021: EVERSANA signed an agreement with Janssen Research & Development LLC to drive evidence-based development of Janssen therapies, highlighting the growing importance of RWE in drug development.
- October 2021: The launch of the Real-World Evidence Registry by the Real-World Evidence Transparency Initiative promoted transparency and standardization in RWE reporting, impacting data quality and reliability.
Strategic Outlook for Global Real-World Evidence Solutions Market Market
The future of the RWE solutions market is promising, with continued growth driven by technological advancements, expanding applications, and increased adoption by stakeholders. Strategic opportunities exist for companies to develop innovative solutions that address the unmet needs of the market, focusing on improving data integration, analytical capabilities, and user-friendliness. Partnerships and collaborations will play a crucial role in driving market expansion and fostering innovation. The market's long-term growth prospects are exceptionally strong, given the growing recognition of RWE's value in improving healthcare outcomes and efficiency.
Global Real-World Evidence Solutions Market Segmentation
-
1. Component
- 1.1. Claims Data
- 1.2. Clinical Settings Data
- 1.3. Patient-Powered Data
- 1.4. Pharmacy Data
- 1.5. Other Components
-
2. Therapeutic Area
- 2.1. Oncology
- 2.2. Immunology
- 2.3. Neurology
- 2.4. Cardiovascular Disease
- 2.5. Other Therapeutic Areas
-
3. End User
- 3.1. Healthcare Payers
- 3.2. Healthcare Providers
- 3.3. Pharmaceutical & Medical Device Companies
- 3.4. Other End Users
Global Real-World Evidence Solutions Market Segmentation By Geography
-
1. North America
- 1.1. United States
- 1.2. Canada
- 1.3. Mexico
-
2. Europe
- 2.1. Germany
- 2.2. United Kingdom
- 2.3. France
- 2.4. Italy
- 2.5. Spain
- 2.6. Rest of Europe
-
3. Asia Pacific
- 3.1. China
- 3.2. Japan
- 3.3. India
- 3.4. Australia
- 3.5. South Korea
- 3.6. Rest of Asia Pacific
- 4. Middle East
-
5. GCC
- 5.1. South Africa
- 5.2. Rest of Middle East
-
6. South America
- 6.1. Brazil
- 6.2. Argentina
- 6.3. Rest of South America
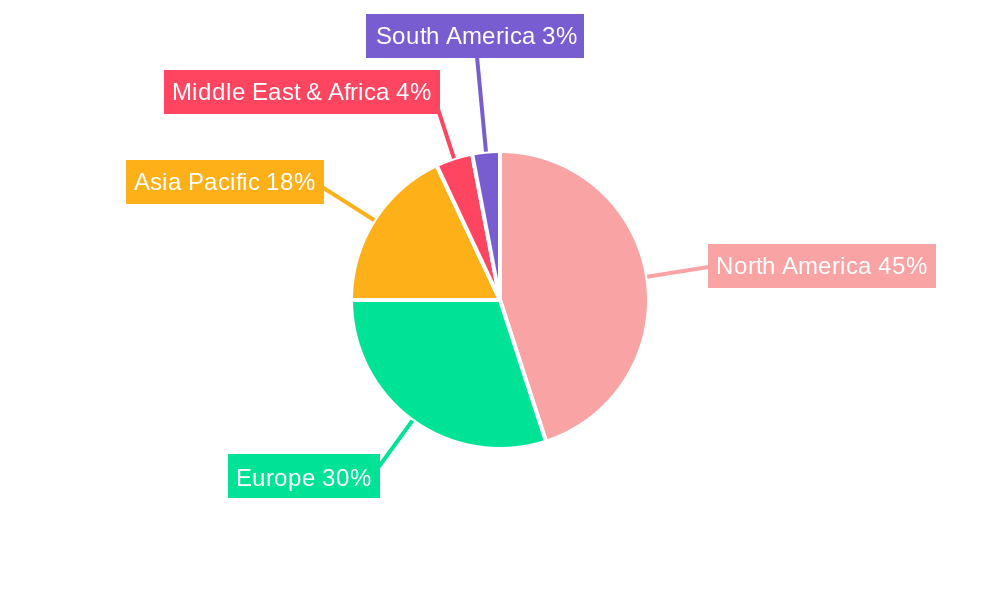
Global Real-World Evidence Solutions Market Regional Market Share
Geographic Coverage of Global Real-World Evidence Solutions Market
Global Real-World Evidence Solutions Market REPORT HIGHLIGHTS
| Aspects | Details |
|---|---|
| Study Period | 2020-2034 |
| Base Year | 2025 |
| Estimated Year | 2026 |
| Forecast Period | 2026-2034 |
| Historical Period | 2020-2025 |
| Growth Rate | CAGR of 9.40% from 2020-2034 |
| Segmentation |
|
Table of Contents
- 1. Introduction
- 1.1. Research Scope
- 1.2. Market Segmentation
- 1.3. Research Methodology
- 1.4. Definitions and Assumptions
- 2. Executive Summary
- 2.1. Introduction
- 3. Market Dynamics
- 3.1. Introduction
- 3.2. Market Drivers
- 3.2.1. Shift From Volume- to Value-based Care; Increasing Aging Population and Prevalence of Chronic Diseases
- 3.3. Market Restrains
- 3.3.1. Unwillingness to Rely on Real-world Studies; Lack of Standards
- 3.4. Market Trends
- 3.4.1. Oncology is Anticipated to be the Dominant Segment During the Forecast Period
- 4. Market Factor Analysis
- 4.1. Porters Five Forces
- 4.2. Supply/Value Chain
- 4.3. PESTEL analysis
- 4.4. Market Entropy
- 4.5. Patent/Trademark Analysis
- 5. Global Real-World Evidence Solutions Market Analysis, Insights and Forecast, 2020-2032
- 5.1. Market Analysis, Insights and Forecast - by Component
- 5.1.1. Claims Data
- 5.1.2. Clinical Settings Data
- 5.1.3. Patient-Powered Data
- 5.1.4. Pharmacy Data
- 5.1.5. Other Components
- 5.2. Market Analysis, Insights and Forecast - by Therapeutic Area
- 5.2.1. Oncology
- 5.2.2. Immunology
- 5.2.3. Neurology
- 5.2.4. Cardiovascular Disease
- 5.2.5. Other Therapeutic Areas
- 5.3. Market Analysis, Insights and Forecast - by End User
- 5.3.1. Healthcare Payers
- 5.3.2. Healthcare Providers
- 5.3.3. Pharmaceutical & Medical Device Companies
- 5.3.4. Other End Users
- 5.4. Market Analysis, Insights and Forecast - by Region
- 5.4.1. North America
- 5.4.2. Europe
- 5.4.3. Asia Pacific
- 5.4.4. Middle East
- 5.4.5. GCC
- 5.4.6. South America
- 5.1. Market Analysis, Insights and Forecast - by Component
- 6. North America Global Real-World Evidence Solutions Market Analysis, Insights and Forecast, 2020-2032
- 6.1. Market Analysis, Insights and Forecast - by Component
- 6.1.1. Claims Data
- 6.1.2. Clinical Settings Data
- 6.1.3. Patient-Powered Data
- 6.1.4. Pharmacy Data
- 6.1.5. Other Components
- 6.2. Market Analysis, Insights and Forecast - by Therapeutic Area
- 6.2.1. Oncology
- 6.2.2. Immunology
- 6.2.3. Neurology
- 6.2.4. Cardiovascular Disease
- 6.2.5. Other Therapeutic Areas
- 6.3. Market Analysis, Insights and Forecast - by End User
- 6.3.1. Healthcare Payers
- 6.3.2. Healthcare Providers
- 6.3.3. Pharmaceutical & Medical Device Companies
- 6.3.4. Other End Users
- 6.1. Market Analysis, Insights and Forecast - by Component
- 7. Europe Global Real-World Evidence Solutions Market Analysis, Insights and Forecast, 2020-2032
- 7.1. Market Analysis, Insights and Forecast - by Component
- 7.1.1. Claims Data
- 7.1.2. Clinical Settings Data
- 7.1.3. Patient-Powered Data
- 7.1.4. Pharmacy Data
- 7.1.5. Other Components
- 7.2. Market Analysis, Insights and Forecast - by Therapeutic Area
- 7.2.1. Oncology
- 7.2.2. Immunology
- 7.2.3. Neurology
- 7.2.4. Cardiovascular Disease
- 7.2.5. Other Therapeutic Areas
- 7.3. Market Analysis, Insights and Forecast - by End User
- 7.3.1. Healthcare Payers
- 7.3.2. Healthcare Providers
- 7.3.3. Pharmaceutical & Medical Device Companies
- 7.3.4. Other End Users
- 7.1. Market Analysis, Insights and Forecast - by Component
- 8. Asia Pacific Global Real-World Evidence Solutions Market Analysis, Insights and Forecast, 2020-2032
- 8.1. Market Analysis, Insights and Forecast - by Component
- 8.1.1. Claims Data
- 8.1.2. Clinical Settings Data
- 8.1.3. Patient-Powered Data
- 8.1.4. Pharmacy Data
- 8.1.5. Other Components
- 8.2. Market Analysis, Insights and Forecast - by Therapeutic Area
- 8.2.1. Oncology
- 8.2.2. Immunology
- 8.2.3. Neurology
- 8.2.4. Cardiovascular Disease
- 8.2.5. Other Therapeutic Areas
- 8.3. Market Analysis, Insights and Forecast - by End User
- 8.3.1. Healthcare Payers
- 8.3.2. Healthcare Providers
- 8.3.3. Pharmaceutical & Medical Device Companies
- 8.3.4. Other End Users
- 8.1. Market Analysis, Insights and Forecast - by Component
- 9. Middle East Global Real-World Evidence Solutions Market Analysis, Insights and Forecast, 2020-2032
- 9.1. Market Analysis, Insights and Forecast - by Component
- 9.1.1. Claims Data
- 9.1.2. Clinical Settings Data
- 9.1.3. Patient-Powered Data
- 9.1.4. Pharmacy Data
- 9.1.5. Other Components
- 9.2. Market Analysis, Insights and Forecast - by Therapeutic Area
- 9.2.1. Oncology
- 9.2.2. Immunology
- 9.2.3. Neurology
- 9.2.4. Cardiovascular Disease
- 9.2.5. Other Therapeutic Areas
- 9.3. Market Analysis, Insights and Forecast - by End User
- 9.3.1. Healthcare Payers
- 9.3.2. Healthcare Providers
- 9.3.3. Pharmaceutical & Medical Device Companies
- 9.3.4. Other End Users
- 9.1. Market Analysis, Insights and Forecast - by Component
- 10. GCC Global Real-World Evidence Solutions Market Analysis, Insights and Forecast, 2020-2032
- 10.1. Market Analysis, Insights and Forecast - by Component
- 10.1.1. Claims Data
- 10.1.2. Clinical Settings Data
- 10.1.3. Patient-Powered Data
- 10.1.4. Pharmacy Data
- 10.1.5. Other Components
- 10.2. Market Analysis, Insights and Forecast - by Therapeutic Area
- 10.2.1. Oncology
- 10.2.2. Immunology
- 10.2.3. Neurology
- 10.2.4. Cardiovascular Disease
- 10.2.5. Other Therapeutic Areas
- 10.3. Market Analysis, Insights and Forecast - by End User
- 10.3.1. Healthcare Payers
- 10.3.2. Healthcare Providers
- 10.3.3. Pharmaceutical & Medical Device Companies
- 10.3.4. Other End Users
- 10.1. Market Analysis, Insights and Forecast - by Component
- 11. South America Global Real-World Evidence Solutions Market Analysis, Insights and Forecast, 2020-2032
- 11.1. Market Analysis, Insights and Forecast - by Component
- 11.1.1. Claims Data
- 11.1.2. Clinical Settings Data
- 11.1.3. Patient-Powered Data
- 11.1.4. Pharmacy Data
- 11.1.5. Other Components
- 11.2. Market Analysis, Insights and Forecast - by Therapeutic Area
- 11.2.1. Oncology
- 11.2.2. Immunology
- 11.2.3. Neurology
- 11.2.4. Cardiovascular Disease
- 11.2.5. Other Therapeutic Areas
- 11.3. Market Analysis, Insights and Forecast - by End User
- 11.3.1. Healthcare Payers
- 11.3.2. Healthcare Providers
- 11.3.3. Pharmaceutical & Medical Device Companies
- 11.3.4. Other End Users
- 11.1. Market Analysis, Insights and Forecast - by Component
- 12. North America Global Real-World Evidence Solutions Market Analysis, Insights and Forecast, 2020-2032
- 12.1. Market Analysis, Insights and Forecast - By Country/Sub-region
- 12.1.1 United States
- 12.1.2 Canada
- 12.1.3 Mexico
- 13. Europe Global Real-World Evidence Solutions Market Analysis, Insights and Forecast, 2020-2032
- 13.1. Market Analysis, Insights and Forecast - By Country/Sub-region
- 13.1.1 Germany
- 13.1.2 United Kingdom
- 13.1.3 France
- 13.1.4 Italy
- 13.1.5 Spain
- 13.1.6 Rest of Europe
- 14. Asia Pacific Global Real-World Evidence Solutions Market Analysis, Insights and Forecast, 2020-2032
- 14.1. Market Analysis, Insights and Forecast - By Country/Sub-region
- 14.1.1 China
- 14.1.2 Japan
- 14.1.3 India
- 14.1.4 Australia
- 14.1.5 South Korea
- 14.1.6 Rest of Asia Pacific
- 15. Middle East Global Real-World Evidence Solutions Market Analysis, Insights and Forecast, 2020-2032
- 15.1. Market Analysis, Insights and Forecast - By Country/Sub-region
- 15.1.1.
- 16. GCC Global Real-World Evidence Solutions Market Analysis, Insights and Forecast, 2020-2032
- 16.1. Market Analysis, Insights and Forecast - By Country/Sub-region
- 16.1.1 South Africa
- 16.1.2 Rest of Middle East
- 17. South America Global Real-World Evidence Solutions Market Analysis, Insights and Forecast, 2020-2032
- 17.1. Market Analysis, Insights and Forecast - By Country/Sub-region
- 17.1.1 Brazil
- 17.1.2 Argentina
- 17.1.3 Rest of South America
- 18. Competitive Analysis
- 18.1. Market Share Analysis 2025
- 18.2. Company Profiles
- 18.2.1 Clinigen Group PLC
- 18.2.1.1. Overview
- 18.2.1.2. Products
- 18.2.1.3. SWOT Analysis
- 18.2.1.4. Recent Developments
- 18.2.1.5. Financials (Based on Availability)
- 18.2.2 Syneos Health
- 18.2.2.1. Overview
- 18.2.2.2. Products
- 18.2.2.3. SWOT Analysis
- 18.2.2.4. Recent Developments
- 18.2.2.5. Financials (Based on Availability)
- 18.2.3 Flatiron Health Inc
- 18.2.3.1. Overview
- 18.2.3.2. Products
- 18.2.3.3. SWOT Analysis
- 18.2.3.4. Recent Developments
- 18.2.3.5. Financials (Based on Availability)
- 18.2.4 Parexel International
- 18.2.4.1. Overview
- 18.2.4.2. Products
- 18.2.4.3. SWOT Analysis
- 18.2.4.4. Recent Developments
- 18.2.4.5. Financials (Based on Availability)
- 18.2.5 IQVIA
- 18.2.5.1. Overview
- 18.2.5.2. Products
- 18.2.5.3. SWOT Analysis
- 18.2.5.4. Recent Developments
- 18.2.5.5. Financials (Based on Availability)
- 18.2.6 SAS Institute
- 18.2.6.1. Overview
- 18.2.6.2. Products
- 18.2.6.3. SWOT Analysis
- 18.2.6.4. Recent Developments
- 18.2.6.5. Financials (Based on Availability)
- 18.2.7 Pharmaceutical Product Development (PPD Inc )
- 18.2.7.1. Overview
- 18.2.7.2. Products
- 18.2.7.3. SWOT Analysis
- 18.2.7.4. Recent Developments
- 18.2.7.5. Financials (Based on Availability)
- 18.2.8 Oracle Corporation
- 18.2.8.1. Overview
- 18.2.8.2. Products
- 18.2.8.3. SWOT Analysis
- 18.2.8.4. Recent Developments
- 18.2.8.5. Financials (Based on Availability)
- 18.2.9 PerkinElmer Inc
- 18.2.9.1. Overview
- 18.2.9.2. Products
- 18.2.9.3. SWOT Analysis
- 18.2.9.4. Recent Developments
- 18.2.9.5. Financials (Based on Availability)
- 18.2.10 IBM
- 18.2.10.1. Overview
- 18.2.10.2. Products
- 18.2.10.3. SWOT Analysis
- 18.2.10.4. Recent Developments
- 18.2.10.5. Financials (Based on Availability)
- 18.2.11 Icon PLC
- 18.2.11.1. Overview
- 18.2.11.2. Products
- 18.2.11.3. SWOT Analysis
- 18.2.11.4. Recent Developments
- 18.2.11.5. Financials (Based on Availability)
- 18.2.1 Clinigen Group PLC
List of Figures
- Figure 1: Global Global Real-World Evidence Solutions Market Revenue Breakdown (Million, %) by Region 2025 & 2033
- Figure 2: North America Global Real-World Evidence Solutions Market Revenue (Million), by Country 2025 & 2033
- Figure 3: North America Global Real-World Evidence Solutions Market Revenue Share (%), by Country 2025 & 2033
- Figure 4: Europe Global Real-World Evidence Solutions Market Revenue (Million), by Country 2025 & 2033
- Figure 5: Europe Global Real-World Evidence Solutions Market Revenue Share (%), by Country 2025 & 2033
- Figure 6: Asia Pacific Global Real-World Evidence Solutions Market Revenue (Million), by Country 2025 & 2033
- Figure 7: Asia Pacific Global Real-World Evidence Solutions Market Revenue Share (%), by Country 2025 & 2033
- Figure 8: Middle East Global Real-World Evidence Solutions Market Revenue (Million), by Country 2025 & 2033
- Figure 9: Middle East Global Real-World Evidence Solutions Market Revenue Share (%), by Country 2025 & 2033
- Figure 10: GCC Global Real-World Evidence Solutions Market Revenue (Million), by Country 2025 & 2033
- Figure 11: GCC Global Real-World Evidence Solutions Market Revenue Share (%), by Country 2025 & 2033
- Figure 12: South America Global Real-World Evidence Solutions Market Revenue (Million), by Country 2025 & 2033
- Figure 13: South America Global Real-World Evidence Solutions Market Revenue Share (%), by Country 2025 & 2033
- Figure 14: North America Global Real-World Evidence Solutions Market Revenue (Million), by Component 2025 & 2033
- Figure 15: North America Global Real-World Evidence Solutions Market Revenue Share (%), by Component 2025 & 2033
- Figure 16: North America Global Real-World Evidence Solutions Market Revenue (Million), by Therapeutic Area 2025 & 2033
- Figure 17: North America Global Real-World Evidence Solutions Market Revenue Share (%), by Therapeutic Area 2025 & 2033
- Figure 18: North America Global Real-World Evidence Solutions Market Revenue (Million), by End User 2025 & 2033
- Figure 19: North America Global Real-World Evidence Solutions Market Revenue Share (%), by End User 2025 & 2033
- Figure 20: North America Global Real-World Evidence Solutions Market Revenue (Million), by Country 2025 & 2033
- Figure 21: North America Global Real-World Evidence Solutions Market Revenue Share (%), by Country 2025 & 2033
- Figure 22: Europe Global Real-World Evidence Solutions Market Revenue (Million), by Component 2025 & 2033
- Figure 23: Europe Global Real-World Evidence Solutions Market Revenue Share (%), by Component 2025 & 2033
- Figure 24: Europe Global Real-World Evidence Solutions Market Revenue (Million), by Therapeutic Area 2025 & 2033
- Figure 25: Europe Global Real-World Evidence Solutions Market Revenue Share (%), by Therapeutic Area 2025 & 2033
- Figure 26: Europe Global Real-World Evidence Solutions Market Revenue (Million), by End User 2025 & 2033
- Figure 27: Europe Global Real-World Evidence Solutions Market Revenue Share (%), by End User 2025 & 2033
- Figure 28: Europe Global Real-World Evidence Solutions Market Revenue (Million), by Country 2025 & 2033
- Figure 29: Europe Global Real-World Evidence Solutions Market Revenue Share (%), by Country 2025 & 2033
- Figure 30: Asia Pacific Global Real-World Evidence Solutions Market Revenue (Million), by Component 2025 & 2033
- Figure 31: Asia Pacific Global Real-World Evidence Solutions Market Revenue Share (%), by Component 2025 & 2033
- Figure 32: Asia Pacific Global Real-World Evidence Solutions Market Revenue (Million), by Therapeutic Area 2025 & 2033
- Figure 33: Asia Pacific Global Real-World Evidence Solutions Market Revenue Share (%), by Therapeutic Area 2025 & 2033
- Figure 34: Asia Pacific Global Real-World Evidence Solutions Market Revenue (Million), by End User 2025 & 2033
- Figure 35: Asia Pacific Global Real-World Evidence Solutions Market Revenue Share (%), by End User 2025 & 2033
- Figure 36: Asia Pacific Global Real-World Evidence Solutions Market Revenue (Million), by Country 2025 & 2033
- Figure 37: Asia Pacific Global Real-World Evidence Solutions Market Revenue Share (%), by Country 2025 & 2033
- Figure 38: Middle East Global Real-World Evidence Solutions Market Revenue (Million), by Component 2025 & 2033
- Figure 39: Middle East Global Real-World Evidence Solutions Market Revenue Share (%), by Component 2025 & 2033
- Figure 40: Middle East Global Real-World Evidence Solutions Market Revenue (Million), by Therapeutic Area 2025 & 2033
- Figure 41: Middle East Global Real-World Evidence Solutions Market Revenue Share (%), by Therapeutic Area 2025 & 2033
- Figure 42: Middle East Global Real-World Evidence Solutions Market Revenue (Million), by End User 2025 & 2033
- Figure 43: Middle East Global Real-World Evidence Solutions Market Revenue Share (%), by End User 2025 & 2033
- Figure 44: Middle East Global Real-World Evidence Solutions Market Revenue (Million), by Country 2025 & 2033
- Figure 45: Middle East Global Real-World Evidence Solutions Market Revenue Share (%), by Country 2025 & 2033
- Figure 46: GCC Global Real-World Evidence Solutions Market Revenue (Million), by Component 2025 & 2033
- Figure 47: GCC Global Real-World Evidence Solutions Market Revenue Share (%), by Component 2025 & 2033
- Figure 48: GCC Global Real-World Evidence Solutions Market Revenue (Million), by Therapeutic Area 2025 & 2033
- Figure 49: GCC Global Real-World Evidence Solutions Market Revenue Share (%), by Therapeutic Area 2025 & 2033
- Figure 50: GCC Global Real-World Evidence Solutions Market Revenue (Million), by End User 2025 & 2033
- Figure 51: GCC Global Real-World Evidence Solutions Market Revenue Share (%), by End User 2025 & 2033
- Figure 52: GCC Global Real-World Evidence Solutions Market Revenue (Million), by Country 2025 & 2033
- Figure 53: GCC Global Real-World Evidence Solutions Market Revenue Share (%), by Country 2025 & 2033
- Figure 54: South America Global Real-World Evidence Solutions Market Revenue (Million), by Component 2025 & 2033
- Figure 55: South America Global Real-World Evidence Solutions Market Revenue Share (%), by Component 2025 & 2033
- Figure 56: South America Global Real-World Evidence Solutions Market Revenue (Million), by Therapeutic Area 2025 & 2033
- Figure 57: South America Global Real-World Evidence Solutions Market Revenue Share (%), by Therapeutic Area 2025 & 2033
- Figure 58: South America Global Real-World Evidence Solutions Market Revenue (Million), by End User 2025 & 2033
- Figure 59: South America Global Real-World Evidence Solutions Market Revenue Share (%), by End User 2025 & 2033
- Figure 60: South America Global Real-World Evidence Solutions Market Revenue (Million), by Country 2025 & 2033
- Figure 61: South America Global Real-World Evidence Solutions Market Revenue Share (%), by Country 2025 & 2033
List of Tables
- Table 1: Global Real-World Evidence Solutions Market Revenue Million Forecast, by Region 2020 & 2033
- Table 2: Global Real-World Evidence Solutions Market Revenue Million Forecast, by Component 2020 & 2033
- Table 3: Global Real-World Evidence Solutions Market Revenue Million Forecast, by Therapeutic Area 2020 & 2033
- Table 4: Global Real-World Evidence Solutions Market Revenue Million Forecast, by End User 2020 & 2033
- Table 5: Global Real-World Evidence Solutions Market Revenue Million Forecast, by Region 2020 & 2033
- Table 6: Global Real-World Evidence Solutions Market Revenue Million Forecast, by Country 2020 & 2033
- Table 7: United States Global Real-World Evidence Solutions Market Revenue (Million) Forecast, by Application 2020 & 2033
- Table 8: Canada Global Real-World Evidence Solutions Market Revenue (Million) Forecast, by Application 2020 & 2033
- Table 9: Mexico Global Real-World Evidence Solutions Market Revenue (Million) Forecast, by Application 2020 & 2033
- Table 10: Global Real-World Evidence Solutions Market Revenue Million Forecast, by Country 2020 & 2033
- Table 11: Germany Global Real-World Evidence Solutions Market Revenue (Million) Forecast, by Application 2020 & 2033
- Table 12: United Kingdom Global Real-World Evidence Solutions Market Revenue (Million) Forecast, by Application 2020 & 2033
- Table 13: France Global Real-World Evidence Solutions Market Revenue (Million) Forecast, by Application 2020 & 2033
- Table 14: Italy Global Real-World Evidence Solutions Market Revenue (Million) Forecast, by Application 2020 & 2033
- Table 15: Spain Global Real-World Evidence Solutions Market Revenue (Million) Forecast, by Application 2020 & 2033
- Table 16: Rest of Europe Global Real-World Evidence Solutions Market Revenue (Million) Forecast, by Application 2020 & 2033
- Table 17: Global Real-World Evidence Solutions Market Revenue Million Forecast, by Country 2020 & 2033
- Table 18: China Global Real-World Evidence Solutions Market Revenue (Million) Forecast, by Application 2020 & 2033
- Table 19: Japan Global Real-World Evidence Solutions Market Revenue (Million) Forecast, by Application 2020 & 2033
- Table 20: India Global Real-World Evidence Solutions Market Revenue (Million) Forecast, by Application 2020 & 2033
- Table 21: Australia Global Real-World Evidence Solutions Market Revenue (Million) Forecast, by Application 2020 & 2033
- Table 22: South Korea Global Real-World Evidence Solutions Market Revenue (Million) Forecast, by Application 2020 & 2033
- Table 23: Rest of Asia Pacific Global Real-World Evidence Solutions Market Revenue (Million) Forecast, by Application 2020 & 2033
- Table 24: Global Real-World Evidence Solutions Market Revenue Million Forecast, by Country 2020 & 2033
- Table 25: Global Real-World Evidence Solutions Market Revenue (Million) Forecast, by Application 2020 & 2033
- Table 26: Global Real-World Evidence Solutions Market Revenue Million Forecast, by Country 2020 & 2033
- Table 27: South Africa Global Real-World Evidence Solutions Market Revenue (Million) Forecast, by Application 2020 & 2033
- Table 28: Rest of Middle East Global Real-World Evidence Solutions Market Revenue (Million) Forecast, by Application 2020 & 2033
- Table 29: Global Real-World Evidence Solutions Market Revenue Million Forecast, by Country 2020 & 2033
- Table 30: Brazil Global Real-World Evidence Solutions Market Revenue (Million) Forecast, by Application 2020 & 2033
- Table 31: Argentina Global Real-World Evidence Solutions Market Revenue (Million) Forecast, by Application 2020 & 2033
- Table 32: Rest of South America Global Real-World Evidence Solutions Market Revenue (Million) Forecast, by Application 2020 & 2033
- Table 33: Global Real-World Evidence Solutions Market Revenue Million Forecast, by Component 2020 & 2033
- Table 34: Global Real-World Evidence Solutions Market Revenue Million Forecast, by Therapeutic Area 2020 & 2033
- Table 35: Global Real-World Evidence Solutions Market Revenue Million Forecast, by End User 2020 & 2033
- Table 36: Global Real-World Evidence Solutions Market Revenue Million Forecast, by Country 2020 & 2033
- Table 37: United States Global Real-World Evidence Solutions Market Revenue (Million) Forecast, by Application 2020 & 2033
- Table 38: Canada Global Real-World Evidence Solutions Market Revenue (Million) Forecast, by Application 2020 & 2033
- Table 39: Mexico Global Real-World Evidence Solutions Market Revenue (Million) Forecast, by Application 2020 & 2033
- Table 40: Global Real-World Evidence Solutions Market Revenue Million Forecast, by Component 2020 & 2033
- Table 41: Global Real-World Evidence Solutions Market Revenue Million Forecast, by Therapeutic Area 2020 & 2033
- Table 42: Global Real-World Evidence Solutions Market Revenue Million Forecast, by End User 2020 & 2033
- Table 43: Global Real-World Evidence Solutions Market Revenue Million Forecast, by Country 2020 & 2033
- Table 44: Germany Global Real-World Evidence Solutions Market Revenue (Million) Forecast, by Application 2020 & 2033
- Table 45: United Kingdom Global Real-World Evidence Solutions Market Revenue (Million) Forecast, by Application 2020 & 2033
- Table 46: France Global Real-World Evidence Solutions Market Revenue (Million) Forecast, by Application 2020 & 2033
- Table 47: Italy Global Real-World Evidence Solutions Market Revenue (Million) Forecast, by Application 2020 & 2033
- Table 48: Spain Global Real-World Evidence Solutions Market Revenue (Million) Forecast, by Application 2020 & 2033
- Table 49: Rest of Europe Global Real-World Evidence Solutions Market Revenue (Million) Forecast, by Application 2020 & 2033
- Table 50: Global Real-World Evidence Solutions Market Revenue Million Forecast, by Component 2020 & 2033
- Table 51: Global Real-World Evidence Solutions Market Revenue Million Forecast, by Therapeutic Area 2020 & 2033
- Table 52: Global Real-World Evidence Solutions Market Revenue Million Forecast, by End User 2020 & 2033
- Table 53: Global Real-World Evidence Solutions Market Revenue Million Forecast, by Country 2020 & 2033
- Table 54: China Global Real-World Evidence Solutions Market Revenue (Million) Forecast, by Application 2020 & 2033
- Table 55: Japan Global Real-World Evidence Solutions Market Revenue (Million) Forecast, by Application 2020 & 2033
- Table 56: India Global Real-World Evidence Solutions Market Revenue (Million) Forecast, by Application 2020 & 2033
- Table 57: Australia Global Real-World Evidence Solutions Market Revenue (Million) Forecast, by Application 2020 & 2033
- Table 58: South Korea Global Real-World Evidence Solutions Market Revenue (Million) Forecast, by Application 2020 & 2033
- Table 59: Rest of Asia Pacific Global Real-World Evidence Solutions Market Revenue (Million) Forecast, by Application 2020 & 2033
- Table 60: Global Real-World Evidence Solutions Market Revenue Million Forecast, by Component 2020 & 2033
- Table 61: Global Real-World Evidence Solutions Market Revenue Million Forecast, by Therapeutic Area 2020 & 2033
- Table 62: Global Real-World Evidence Solutions Market Revenue Million Forecast, by End User 2020 & 2033
- Table 63: Global Real-World Evidence Solutions Market Revenue Million Forecast, by Country 2020 & 2033
- Table 64: Global Real-World Evidence Solutions Market Revenue Million Forecast, by Component 2020 & 2033
- Table 65: Global Real-World Evidence Solutions Market Revenue Million Forecast, by Therapeutic Area 2020 & 2033
- Table 66: Global Real-World Evidence Solutions Market Revenue Million Forecast, by End User 2020 & 2033
- Table 67: Global Real-World Evidence Solutions Market Revenue Million Forecast, by Country 2020 & 2033
- Table 68: South Africa Global Real-World Evidence Solutions Market Revenue (Million) Forecast, by Application 2020 & 2033
- Table 69: Rest of Middle East Global Real-World Evidence Solutions Market Revenue (Million) Forecast, by Application 2020 & 2033
- Table 70: Global Real-World Evidence Solutions Market Revenue Million Forecast, by Component 2020 & 2033
- Table 71: Global Real-World Evidence Solutions Market Revenue Million Forecast, by Therapeutic Area 2020 & 2033
- Table 72: Global Real-World Evidence Solutions Market Revenue Million Forecast, by End User 2020 & 2033
- Table 73: Global Real-World Evidence Solutions Market Revenue Million Forecast, by Country 2020 & 2033
- Table 74: Brazil Global Real-World Evidence Solutions Market Revenue (Million) Forecast, by Application 2020 & 2033
- Table 75: Argentina Global Real-World Evidence Solutions Market Revenue (Million) Forecast, by Application 2020 & 2033
- Table 76: Rest of South America Global Real-World Evidence Solutions Market Revenue (Million) Forecast, by Application 2020 & 2033
Frequently Asked Questions
1. What is the projected Compound Annual Growth Rate (CAGR) of the Global Real-World Evidence Solutions Market?
The projected CAGR is approximately 9.40%.
2. Which companies are prominent players in the Global Real-World Evidence Solutions Market?
Key companies in the market include Clinigen Group PLC, Syneos Health, Flatiron Health Inc, Parexel International, IQVIA, SAS Institute, Pharmaceutical Product Development (PPD Inc ), Oracle Corporation, PerkinElmer Inc, IBM, Icon PLC.
3. What are the main segments of the Global Real-World Evidence Solutions Market?
The market segments include Component, Therapeutic Area, End User.
4. Can you provide details about the market size?
The market size is estimated to be USD 1.47 Million as of 2022.
5. What are some drivers contributing to market growth?
Shift From Volume- to Value-based Care; Increasing Aging Population and Prevalence of Chronic Diseases.
6. What are the notable trends driving market growth?
Oncology is Anticipated to be the Dominant Segment During the Forecast Period.
7. Are there any restraints impacting market growth?
Unwillingness to Rely on Real-world Studies; Lack of Standards.
8. Can you provide examples of recent developments in the market?
In December 2021, EVERSANA signed an agreement with Janssen Research & Development LLC (Janssen) to drive evidence-based development of Janssen therapies, treatments, and patient support models.
9. What pricing options are available for accessing the report?
Pricing options include single-user, multi-user, and enterprise licenses priced at USD 4750, USD 5250, and USD 8750 respectively.
10. Is the market size provided in terms of value or volume?
The market size is provided in terms of value, measured in Million.
11. Are there any specific market keywords associated with the report?
Yes, the market keyword associated with the report is "Global Real-World Evidence Solutions Market," which aids in identifying and referencing the specific market segment covered.
12. How do I determine which pricing option suits my needs best?
The pricing options vary based on user requirements and access needs. Individual users may opt for single-user licenses, while businesses requiring broader access may choose multi-user or enterprise licenses for cost-effective access to the report.
13. Are there any additional resources or data provided in the Global Real-World Evidence Solutions Market report?
While the report offers comprehensive insights, it's advisable to review the specific contents or supplementary materials provided to ascertain if additional resources or data are available.
14. How can I stay updated on further developments or reports in the Global Real-World Evidence Solutions Market?
To stay informed about further developments, trends, and reports in the Global Real-World Evidence Solutions Market, consider subscribing to industry newsletters, following relevant companies and organizations, or regularly checking reputable industry news sources and publications.
Methodology
Step 1 - Identification of Relevant Samples Size from Population Database


Step 2 - Approaches for Defining Global Market Size (Value, Volume* & Price*)

Note*: In applicable scenarios
Step 3 - Data Sources
Primary Research
- Web Analytics
- Survey Reports
- Research Institute
- Latest Research Reports
- Opinion Leaders
Secondary Research
- Annual Reports
- White Paper
- Latest Press Release
- Industry Association
- Paid Database
- Investor Presentations

Step 4 - Data Triangulation
Involves using different sources of information in order to increase the validity of a study
These sources are likely to be stakeholders in a program - participants, other researchers, program staff, other community members, and so on.
Then we put all data in single framework & apply various statistical tools to find out the dynamic on the market.
During the analysis stage, feedback from the stakeholder groups would be compared to determine areas of agreement as well as areas of divergence
