

Key Insights
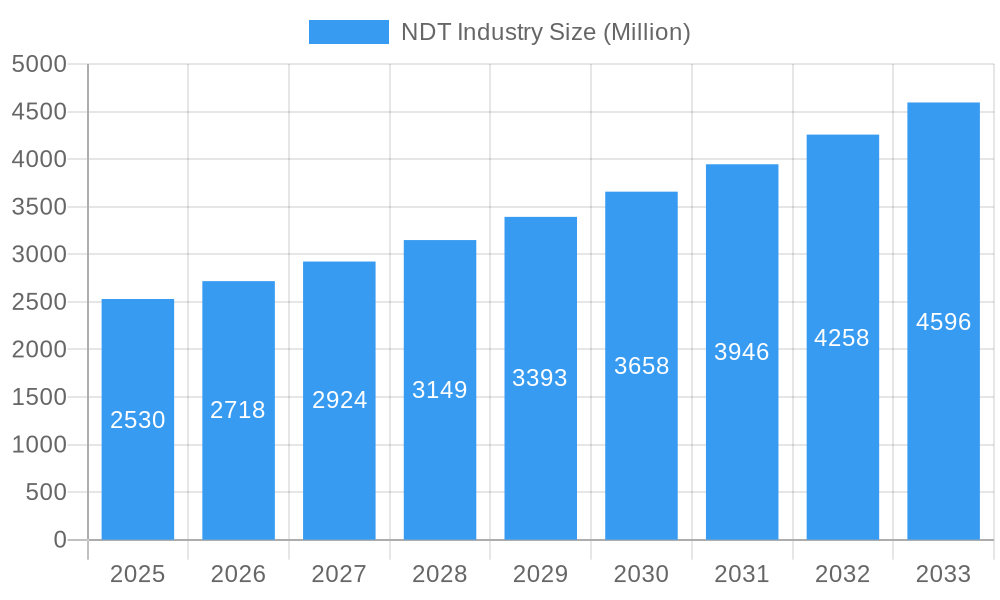
The Non-Destructive Testing (NDT) market, valued at $2.53 billion in 2025, is experiencing robust growth, projected to expand at a CAGR of 7.35% from 2025 to 2033. This growth is fueled by several key factors. Increasing infrastructure development globally, particularly in emerging economies, necessitates rigorous quality control and safety checks, driving demand for NDT services and equipment. The energy sector, encompassing oil & gas and power generation, remains a major driver, with stringent regulatory requirements and the need for preventative maintenance boosting adoption. Furthermore, advancements in testing technologies, such as the development of more portable and efficient ultrasonic and radiographic systems, are enhancing the capabilities and accessibility of NDT. The automotive and aerospace industries also contribute significantly to market growth, driven by the need for defect detection in complex components and the demand for higher safety standards. The market is segmented by testing technology (radiography, ultrasonic, magnetic particle, liquid penetrant, visual inspection, eddy current, and others), end-user industry (oil & gas, power & energy, construction, automotive & transportation, aerospace & defense, and others), and type (services and equipment). Growth is expected across all segments, with services potentially outpacing equipment sales due to the increasing outsourcing of NDT inspections.
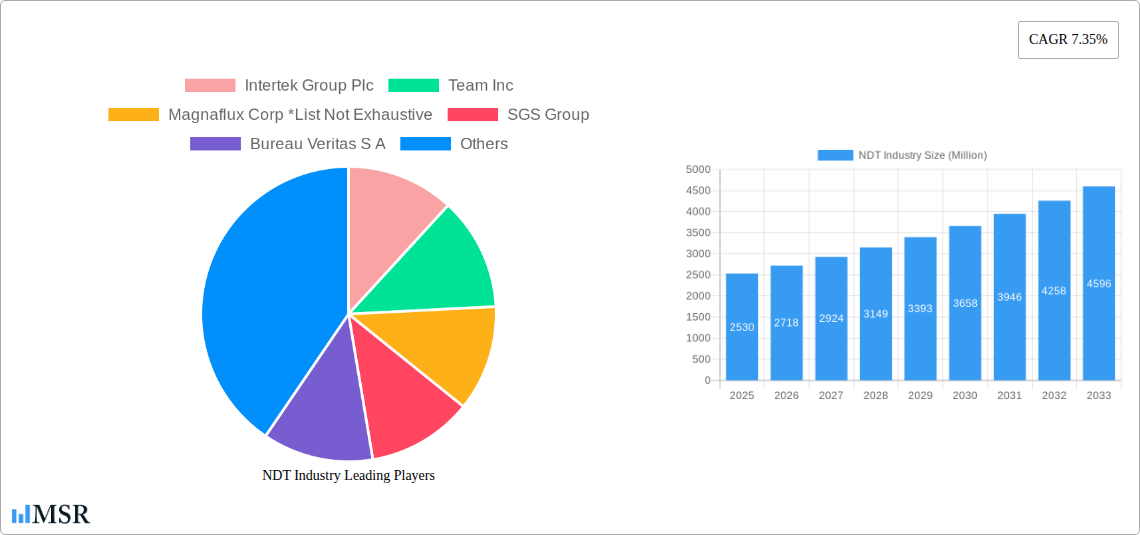
NDT Industry Market Size (In Billion)
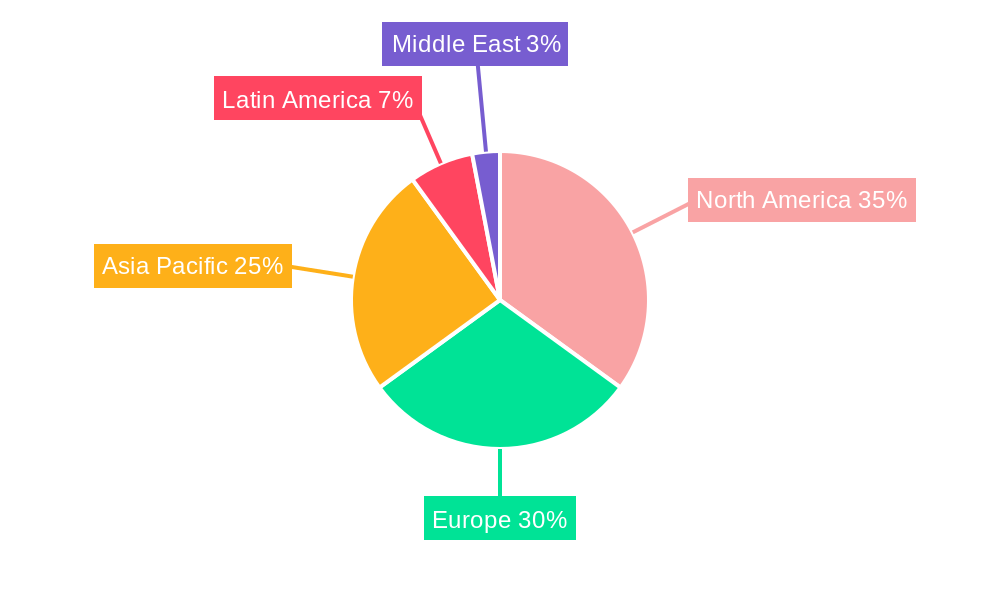
The competitive landscape is characterized by a mix of large multinational corporations and specialized NDT providers. Companies like Intertek, SGS, Bureau Veritas, and TÜV Rheinland are key players, offering a comprehensive range of services and equipment. However, the market is also witnessing the emergence of smaller, specialized firms focusing on niche applications or advanced technologies. Geographic growth is anticipated across all regions, with North America and Europe maintaining a substantial market share due to established infrastructure and stringent regulatory frameworks. However, rapid industrialization and infrastructure development in Asia-Pacific, particularly in China and India, are expected to fuel significant growth in these regions over the forecast period. Challenges such as the high initial investment costs associated with certain NDT equipment and the need for skilled personnel may present some restraints to market expansion. However, the overall outlook remains positive, driven by sustained demand from key industries and ongoing technological advancements within the NDT sector.
NDT Industry Company Market Share
NDT Industry Market Report: A Comprehensive Analysis 2019-2033
This in-depth report provides a comprehensive analysis of the Non-Destructive Testing (NDT) industry, projecting a market value exceeding $XX Million by 2033. The study covers the period 2019-2033, with 2025 as the base and estimated year. Key players like Intertek Group Plc, Team Inc, Magnaflux Corp, SGS Group, Bureau Veritas S A, and others are analyzed, offering invaluable insights for stakeholders. The report segments the market by testing technology (Radiography, Ultrasonic, Magnetic Particle, Liquid Penetrant, Visual Inspection, Eddy Current, and Others), end-user industry (Oil & Gas, Power & Energy, Construction, Automotive & Transportation, Aerospace, Defense, and Others), and type (Services and Equipment).
NDT Industry Market Concentration & Dynamics
The NDT market exhibits a moderately consolidated structure, with a handful of multinational corporations holding significant market share. Intertek, SGS, and Bureau Veritas collectively account for an estimated xx% of the global market in 2025. However, the presence of numerous specialized firms and regional players contributes to competitive dynamism.
- Market Concentration: The Herfindahl-Hirschman Index (HHI) is estimated at xx in 2025, indicating a moderately concentrated market.
- Innovation Ecosystems: Significant R&D investments drive innovation in advanced testing technologies, particularly in areas like automated inspection systems and AI-powered data analysis.
- Regulatory Frameworks: Stringent safety and quality regulations across various industries, particularly in aerospace and defense, create a robust demand for NDT services and equipment. Compliance with standards like ASME, ASTM, and ISO is a key driver.
- Substitute Products: Limited readily available substitutes exist for NDT methods. However, advancements in other technologies might offer partial alternatives in specific applications.
- End-User Trends: Increasing focus on predictive maintenance and digitalization across industries fuels growth in the NDT market. The demand for real-time data analysis and remote inspection capabilities is rising.
- M&A Activities: The past five years have witnessed xx M&A deals in the NDT sector, primarily driven by consolidation and expansion into new technologies and markets.
NDT Industry Insights & Trends
The global NDT market is projected to experience robust growth, with a Compound Annual Growth Rate (CAGR) of xx% during the forecast period (2025-2033), reaching a value exceeding $XX Million by 2033. This growth is primarily fueled by the rising demand for NDT services across various end-user industries.
The increasing complexity of modern infrastructure, stringent safety regulations, and the growing adoption of predictive maintenance strategies are key drivers. Technological advancements, such as the integration of artificial intelligence (AI) and machine learning (ML) in NDT systems, are further accelerating market expansion. The rising adoption of automation and the development of portable and user-friendly NDT equipment are also contributing to market growth. Furthermore, the increasing emphasis on minimizing downtime and enhancing operational efficiency across various industries is significantly impacting the growth of this market. The expansion of the global infrastructure development market and the growing adoption of advanced materials in critical applications are additional factors shaping the market trajectory.
Key Markets & Segments Leading NDT Industry
Dominant Region: North America currently holds the largest market share, followed by Europe and Asia-Pacific. However, the Asia-Pacific region is expected to witness the highest growth rate during the forecast period, driven by rapid industrialization and infrastructure development.
Dominant Segment (By Testing Technology): Ultrasonic Testing and Radiography Testing currently dominate the market due to their versatility and wide applicability.
Dominant Segment (By End-user Industry): The Oil & Gas and Power & Energy sectors are major consumers of NDT services and equipment due to the critical nature of their operations.
Dominant Segment (By Type): The services segment holds a larger share currently, but the equipment segment is anticipated to grow significantly due to technological advancements and increasing demand for advanced NDT tools.
Growth Drivers:
- Economic Growth: Investment in infrastructure and industrial projects drives demand.
- Stringent Regulations: Compliance mandates drive NDT adoption across various sectors.
- Technological Advancements: Innovation in testing technologies fuels market expansion.
- Rising Adoption of Predictive Maintenance: Proactive inspection reduces downtime and improves operational efficiency.
NDT Industry Product Developments
Recent product innovations include advanced ultrasonic testing systems with improved image processing capabilities, portable and user-friendly eddy current testing devices, and automated radiography systems with AI-powered defect recognition. These advancements enhance inspection efficiency, accuracy, and data analysis, providing a significant competitive edge. The development of phased array ultrasonic testing (PAUT) systems and the integration of robotics in NDT processes are particularly noteworthy.
Challenges in the NDT Industry Market
The NDT industry faces challenges such as the high initial investment cost associated with acquiring advanced testing equipment, the need for skilled technicians and inspectors, and intense competition among numerous players. Supply chain disruptions and fluctuations in raw material prices also pose a significant challenge. Additionally, stringent regulatory requirements and evolving industry standards can necessitate considerable investment in compliance. These factors can impact profitability and potentially limit market growth.
Forces Driving NDT Industry Growth
Key growth drivers include increasing adoption of predictive maintenance strategies across various industries, stringent safety and quality regulations in sectors like aerospace and energy, and advancements in NDT technologies such as AI and automation. The continuous need for infrastructure development worldwide, particularly in developing economies, fuels demand for NDT services. Growing adoption of advanced materials and complex manufacturing processes also drives the need for more sophisticated NDT techniques.
Long-Term Growth Catalysts
Long-term growth catalysts for the NDT industry include the ongoing development of more precise, portable, and automated inspection systems. Strategic partnerships between NDT providers and end-users can facilitate the adoption of cutting-edge technologies and improve inspection efficiency. Expansion into emerging markets and the development of new applications in areas like renewable energy and medical devices further drive long-term growth.
Emerging Opportunities in NDT Industry
Emerging opportunities lie in the adoption of AI-powered data analytics for improved defect detection and predictive maintenance, and the integration of drone technology for remote inspection. Growth potential exists in specialized NDT applications for emerging materials and industries like additive manufacturing and nanotechnology. Increased demand for real-time inspection and remote monitoring of critical infrastructure offers new avenues for market expansion.
Leading Players in the NDT Industry Sector
- Intertek Group Plc
- Team Inc
- Magnaflux Corp
- SGS Group
- Bureau Veritas S A
- Nikon Metrology NV
- Fujifilm Corporation
- TÜV Rheinland AG
- Mistras Group Inc
- Yxlon International Gmbh (Comet Holding Ag)
- Applus Services
- Olympus Corporation
- GE Measurement & Control Solutions
Key Milestones in NDT Industry Industry
- 2020: Increased adoption of remote NDT inspection methods due to the pandemic.
- 2021: Several key players invested heavily in AI-powered NDT solutions.
- 2022: Significant advancements in phased array ultrasonic testing (PAUT) technology.
- 2023: Several mergers and acquisitions among NDT equipment manufacturers.
- 2024: Increased regulatory scrutiny and stricter compliance standards across various sectors.
Strategic Outlook for NDT Industry Market
The NDT market is poised for significant growth, driven by technological advancements, increasing regulatory pressures, and rising demand from key end-user industries. Strategic investments in R&D, strategic partnerships, and expansion into new markets are crucial for achieving long-term success. The focus on developing sustainable and environmentally friendly NDT solutions will further contribute to the market's growth trajectory. Companies that can effectively leverage AI and data analytics for improved inspection efficiency and predictive maintenance will gain a significant competitive advantage.
NDT Industry Segmentation
-
1. Type
- 1.1. Equipment
- 1.2. Services
-
2. Testing Technology
- 2.1. Radiography Testing
- 2.2. Ultrasonic Testing
- 2.3. Magnetic Particle Testing
- 2.4. Liquid Penetrant Testing
- 2.5. Visual Inspection Testing
- 2.6. Eddy Current Testing
- 2.7. Other Testing Technologies
-
3. End-user Industry
- 3.1. Oil and Gas
- 3.2. Power and Energy
- 3.3. Construction
- 3.4. Automotive and Transportation
- 3.5. Aerospace
- 3.6. Defense
- 3.7. Other End User Industries
NDT Industry Segmentation By Geography
-
1. North America
- 1.1. United States
- 1.2. Canada
-
2. Europe
- 2.1. Germany
- 2.2. United Kingdom
- 2.3. France
-
3. Asia
- 3.1. China
- 3.2. Japan
- 3.3. India
- 4. Australia and New Zealand
-
5. Latin America
- 5.1. Brazil
- 5.2. Argentina
- 5.3. Mexico
-
6. Middle East and Africa
- 6.1. United Arab Emirates
- 6.2. Saudi Arabia
- 6.3. South Africa
NDT Industry Regional Market Share
Geographic Coverage of NDT Industry
NDT Industry REPORT HIGHLIGHTS
| Aspects | Details |
|---|---|
| Study Period | 2020-2034 |
| Base Year | 2025 |
| Estimated Year | 2026 |
| Forecast Period | 2026-2034 |
| Historical Period | 2020-2025 |
| Growth Rate | CAGR of 7.35% from 2020-2034 |
| Segmentation |
|
Table of Contents
- 1. Introduction
- 1.1. Research Scope
- 1.2. Market Segmentation
- 1.3. Research Objective
- 1.4. Definitions and Assumptions
- 2. Executive Summary
- 2.1. Market Snapshot
- 3. Market Dynamics
- 3.1. Market Drivers
- 3.2. Market Restrains
- 3.3. Market Trends
- 3.4. Market Opportunities
- 4. Market Factor Analysis
- 4.1. Porters Five Forces
- 4.1.1. Bargaining Power of Suppliers
- 4.1.2. Bargaining Power of Buyers
- 4.1.3. Threat of New Entrants
- 4.1.4. Threat of Substitutes
- 4.1.5. Competitive Rivalry
- 4.2. PESTEL analysis
- 4.3. BCG Analysis
- 4.3.1. Stars (High Growth, High Market Share)
- 4.3.2. Cash Cows (Low Growth, High Market Share)
- 4.3.3. Question Mark (High Growth, Low Market Share)
- 4.3.4. Dogs (Low Growth, Low Market Share)
- 4.4. Ansoff Matrix Analysis
- 4.5. Supply Chain Analysis
- 4.6. Regulatory Landscape
- 4.7. Current Market Potential and Opportunity Assessment (TAM–SAM–SOM Framework)
- 4.8. MSR Analyst Note
- 4.1. Porters Five Forces
- 5. Market Analysis, Insights and Forecast 2021-2033
- 5.1. Market Analysis, Insights and Forecast - by Type
- 5.1.1. Equipment
- 5.1.2. Services
- 5.2. Market Analysis, Insights and Forecast - by Testing Technology
- 5.2.1. Radiography Testing
- 5.2.2. Ultrasonic Testing
- 5.2.3. Magnetic Particle Testing
- 5.2.4. Liquid Penetrant Testing
- 5.2.5. Visual Inspection Testing
- 5.2.6. Eddy Current Testing
- 5.2.7. Other Testing Technologies
- 5.3. Market Analysis, Insights and Forecast - by End-user Industry
- 5.3.1. Oil and Gas
- 5.3.2. Power and Energy
- 5.3.3. Construction
- 5.3.4. Automotive and Transportation
- 5.3.5. Aerospace
- 5.3.6. Defense
- 5.3.7. Other End User Industries
- 5.4. Market Analysis, Insights and Forecast - by Region
- 5.4.1. North America
- 5.4.2. Europe
- 5.4.3. Asia
- 5.4.4. Australia and New Zealand
- 5.4.5. Latin America
- 5.4.6. Middle East and Africa
- 5.1. Market Analysis, Insights and Forecast - by Type
- 6. Global NDT Industry Analysis, Insights and Forecast, 2021-2033
- 6.1. Market Analysis, Insights and Forecast - by Type
- 6.1.1. Equipment
- 6.1.2. Services
- 6.2. Market Analysis, Insights and Forecast - by Testing Technology
- 6.2.1. Radiography Testing
- 6.2.2. Ultrasonic Testing
- 6.2.3. Magnetic Particle Testing
- 6.2.4. Liquid Penetrant Testing
- 6.2.5. Visual Inspection Testing
- 6.2.6. Eddy Current Testing
- 6.2.7. Other Testing Technologies
- 6.3. Market Analysis, Insights and Forecast - by End-user Industry
- 6.3.1. Oil and Gas
- 6.3.2. Power and Energy
- 6.3.3. Construction
- 6.3.4. Automotive and Transportation
- 6.3.5. Aerospace
- 6.3.6. Defense
- 6.3.7. Other End User Industries
- 6.1. Market Analysis, Insights and Forecast - by Type
- 7. North America NDT Industry Analysis, Insights and Forecast, 2020-2032
- 7.1. Market Analysis, Insights and Forecast - by Type
- 7.1.1. Equipment
- 7.1.2. Services
- 7.2. Market Analysis, Insights and Forecast - by Testing Technology
- 7.2.1. Radiography Testing
- 7.2.2. Ultrasonic Testing
- 7.2.3. Magnetic Particle Testing
- 7.2.4. Liquid Penetrant Testing
- 7.2.5. Visual Inspection Testing
- 7.2.6. Eddy Current Testing
- 7.2.7. Other Testing Technologies
- 7.3. Market Analysis, Insights and Forecast - by End-user Industry
- 7.3.1. Oil and Gas
- 7.3.2. Power and Energy
- 7.3.3. Construction
- 7.3.4. Automotive and Transportation
- 7.3.5. Aerospace
- 7.3.6. Defense
- 7.3.7. Other End User Industries
- 7.1. Market Analysis, Insights and Forecast - by Type
- 8. Europe NDT Industry Analysis, Insights and Forecast, 2020-2032
- 8.1. Market Analysis, Insights and Forecast - by Type
- 8.1.1. Equipment
- 8.1.2. Services
- 8.2. Market Analysis, Insights and Forecast - by Testing Technology
- 8.2.1. Radiography Testing
- 8.2.2. Ultrasonic Testing
- 8.2.3. Magnetic Particle Testing
- 8.2.4. Liquid Penetrant Testing
- 8.2.5. Visual Inspection Testing
- 8.2.6. Eddy Current Testing
- 8.2.7. Other Testing Technologies
- 8.3. Market Analysis, Insights and Forecast - by End-user Industry
- 8.3.1. Oil and Gas
- 8.3.2. Power and Energy
- 8.3.3. Construction
- 8.3.4. Automotive and Transportation
- 8.3.5. Aerospace
- 8.3.6. Defense
- 8.3.7. Other End User Industries
- 8.1. Market Analysis, Insights and Forecast - by Type
- 9. Asia NDT Industry Analysis, Insights and Forecast, 2020-2032
- 9.1. Market Analysis, Insights and Forecast - by Type
- 9.1.1. Equipment
- 9.1.2. Services
- 9.2. Market Analysis, Insights and Forecast - by Testing Technology
- 9.2.1. Radiography Testing
- 9.2.2. Ultrasonic Testing
- 9.2.3. Magnetic Particle Testing
- 9.2.4. Liquid Penetrant Testing
- 9.2.5. Visual Inspection Testing
- 9.2.6. Eddy Current Testing
- 9.2.7. Other Testing Technologies
- 9.3. Market Analysis, Insights and Forecast - by End-user Industry
- 9.3.1. Oil and Gas
- 9.3.2. Power and Energy
- 9.3.3. Construction
- 9.3.4. Automotive and Transportation
- 9.3.5. Aerospace
- 9.3.6. Defense
- 9.3.7. Other End User Industries
- 9.1. Market Analysis, Insights and Forecast - by Type
- 10. Australia and New Zealand NDT Industry Analysis, Insights and Forecast, 2020-2032
- 10.1. Market Analysis, Insights and Forecast - by Type
- 10.1.1. Equipment
- 10.1.2. Services
- 10.2. Market Analysis, Insights and Forecast - by Testing Technology
- 10.2.1. Radiography Testing
- 10.2.2. Ultrasonic Testing
- 10.2.3. Magnetic Particle Testing
- 10.2.4. Liquid Penetrant Testing
- 10.2.5. Visual Inspection Testing
- 10.2.6. Eddy Current Testing
- 10.2.7. Other Testing Technologies
- 10.3. Market Analysis, Insights and Forecast - by End-user Industry
- 10.3.1. Oil and Gas
- 10.3.2. Power and Energy
- 10.3.3. Construction
- 10.3.4. Automotive and Transportation
- 10.3.5. Aerospace
- 10.3.6. Defense
- 10.3.7. Other End User Industries
- 10.1. Market Analysis, Insights and Forecast - by Type
- 11. Latin America NDT Industry Analysis, Insights and Forecast, 2020-2032
- 11.1. Market Analysis, Insights and Forecast - by Type
- 11.1.1. Equipment
- 11.1.2. Services
- 11.2. Market Analysis, Insights and Forecast - by Testing Technology
- 11.2.1. Radiography Testing
- 11.2.2. Ultrasonic Testing
- 11.2.3. Magnetic Particle Testing
- 11.2.4. Liquid Penetrant Testing
- 11.2.5. Visual Inspection Testing
- 11.2.6. Eddy Current Testing
- 11.2.7. Other Testing Technologies
- 11.3. Market Analysis, Insights and Forecast - by End-user Industry
- 11.3.1. Oil and Gas
- 11.3.2. Power and Energy
- 11.3.3. Construction
- 11.3.4. Automotive and Transportation
- 11.3.5. Aerospace
- 11.3.6. Defense
- 11.3.7. Other End User Industries
- 11.1. Market Analysis, Insights and Forecast - by Type
- 12. Middle East and Africa NDT Industry Analysis, Insights and Forecast, 2020-2032
- 12.1. Market Analysis, Insights and Forecast - by Type
- 12.1.1. Equipment
- 12.1.2. Services
- 12.2. Market Analysis, Insights and Forecast - by Testing Technology
- 12.2.1. Radiography Testing
- 12.2.2. Ultrasonic Testing
- 12.2.3. Magnetic Particle Testing
- 12.2.4. Liquid Penetrant Testing
- 12.2.5. Visual Inspection Testing
- 12.2.6. Eddy Current Testing
- 12.2.7. Other Testing Technologies
- 12.3. Market Analysis, Insights and Forecast - by End-user Industry
- 12.3.1. Oil and Gas
- 12.3.2. Power and Energy
- 12.3.3. Construction
- 12.3.4. Automotive and Transportation
- 12.3.5. Aerospace
- 12.3.6. Defense
- 12.3.7. Other End User Industries
- 12.1. Market Analysis, Insights and Forecast - by Type
- 13. Competitive Analysis
- 13.1. Company Profiles
- 13.1.1 Intertek Group Plc
- 13.1.1.1. Company Overview
- 13.1.1.2. Products
- 13.1.1.3. Company Financials
- 13.1.1.4. SWOT Analysis
- 13.1.2 Team Inc
- 13.1.2.1. Company Overview
- 13.1.2.2. Products
- 13.1.2.3. Company Financials
- 13.1.2.4. SWOT Analysis
- 13.1.3 Magnaflux Corp *List Not Exhaustive
- 13.1.3.1. Company Overview
- 13.1.3.2. Products
- 13.1.3.3. Company Financials
- 13.1.3.4. SWOT Analysis
- 13.1.4 SGS Group
- 13.1.4.1. Company Overview
- 13.1.4.2. Products
- 13.1.4.3. Company Financials
- 13.1.4.4. SWOT Analysis
- 13.1.5 Bureau Veritas S A
- 13.1.5.1. Company Overview
- 13.1.5.2. Products
- 13.1.5.3. Company Financials
- 13.1.5.4. SWOT Analysis
- 13.1.6 Nikon Metrology NV
- 13.1.6.1. Company Overview
- 13.1.6.2. Products
- 13.1.6.3. Company Financials
- 13.1.6.4. SWOT Analysis
- 13.1.7 Fujifilm Corporation
- 13.1.7.1. Company Overview
- 13.1.7.2. Products
- 13.1.7.3. Company Financials
- 13.1.7.4. SWOT Analysis
- 13.1.8 TÜV Rheinland AG
- 13.1.8.1. Company Overview
- 13.1.8.2. Products
- 13.1.8.3. Company Financials
- 13.1.8.4. SWOT Analysis
- 13.1.9 Mistras Group Inc
- 13.1.9.1. Company Overview
- 13.1.9.2. Products
- 13.1.9.3. Company Financials
- 13.1.9.4. SWOT Analysis
- 13.1.10 Yxlon International Gmbh (Comet Holding Ag)
- 13.1.10.1. Company Overview
- 13.1.10.2. Products
- 13.1.10.3. Company Financials
- 13.1.10.4. SWOT Analysis
- 13.1.11 Applus Services
- 13.1.11.1. Company Overview
- 13.1.11.2. Products
- 13.1.11.3. Company Financials
- 13.1.11.4. SWOT Analysis
- 13.1.12 Olympus Corporation
- 13.1.12.1. Company Overview
- 13.1.12.2. Products
- 13.1.12.3. Company Financials
- 13.1.12.4. SWOT Analysis
- 13.1.13 GE Measurement & Control Solutions
- 13.1.13.1. Company Overview
- 13.1.13.2. Products
- 13.1.13.3. Company Financials
- 13.1.13.4. SWOT Analysis
- 13.1.1 Intertek Group Plc
- 13.2. Market Entropy
- 13.2.1 Company's Key Areas Served
- 13.2.2 Recent Developments
- 13.3. Company Market Share Analysis 2025
- 13.3.1 Top 5 Companies Market Share Analysis
- 13.3.2 Top 3 Companies Market Share Analysis
- 13.4. List of Potential Customers
- 14. Research Methodology
List of Figures
- Figure 1: Global NDT Industry Revenue Breakdown (Million, %) by Region 2025 & 2033
- Figure 2: North America NDT Industry Revenue (Million), by Type 2025 & 2033
- Figure 3: North America NDT Industry Revenue Share (%), by Type 2025 & 2033
- Figure 4: North America NDT Industry Revenue (Million), by Testing Technology 2025 & 2033
- Figure 5: North America NDT Industry Revenue Share (%), by Testing Technology 2025 & 2033
- Figure 6: North America NDT Industry Revenue (Million), by End-user Industry 2025 & 2033
- Figure 7: North America NDT Industry Revenue Share (%), by End-user Industry 2025 & 2033
- Figure 8: North America NDT Industry Revenue (Million), by Country 2025 & 2033
- Figure 9: North America NDT Industry Revenue Share (%), by Country 2025 & 2033
- Figure 10: Europe NDT Industry Revenue (Million), by Type 2025 & 2033
- Figure 11: Europe NDT Industry Revenue Share (%), by Type 2025 & 2033
- Figure 12: Europe NDT Industry Revenue (Million), by Testing Technology 2025 & 2033
- Figure 13: Europe NDT Industry Revenue Share (%), by Testing Technology 2025 & 2033
- Figure 14: Europe NDT Industry Revenue (Million), by End-user Industry 2025 & 2033
- Figure 15: Europe NDT Industry Revenue Share (%), by End-user Industry 2025 & 2033
- Figure 16: Europe NDT Industry Revenue (Million), by Country 2025 & 2033
- Figure 17: Europe NDT Industry Revenue Share (%), by Country 2025 & 2033
- Figure 18: Asia NDT Industry Revenue (Million), by Type 2025 & 2033
- Figure 19: Asia NDT Industry Revenue Share (%), by Type 2025 & 2033
- Figure 20: Asia NDT Industry Revenue (Million), by Testing Technology 2025 & 2033
- Figure 21: Asia NDT Industry Revenue Share (%), by Testing Technology 2025 & 2033
- Figure 22: Asia NDT Industry Revenue (Million), by End-user Industry 2025 & 2033
- Figure 23: Asia NDT Industry Revenue Share (%), by End-user Industry 2025 & 2033
- Figure 24: Asia NDT Industry Revenue (Million), by Country 2025 & 2033
- Figure 25: Asia NDT Industry Revenue Share (%), by Country 2025 & 2033
- Figure 26: Australia and New Zealand NDT Industry Revenue (Million), by Type 2025 & 2033
- Figure 27: Australia and New Zealand NDT Industry Revenue Share (%), by Type 2025 & 2033
- Figure 28: Australia and New Zealand NDT Industry Revenue (Million), by Testing Technology 2025 & 2033
- Figure 29: Australia and New Zealand NDT Industry Revenue Share (%), by Testing Technology 2025 & 2033
- Figure 30: Australia and New Zealand NDT Industry Revenue (Million), by End-user Industry 2025 & 2033
- Figure 31: Australia and New Zealand NDT Industry Revenue Share (%), by End-user Industry 2025 & 2033
- Figure 32: Australia and New Zealand NDT Industry Revenue (Million), by Country 2025 & 2033
- Figure 33: Australia and New Zealand NDT Industry Revenue Share (%), by Country 2025 & 2033
- Figure 34: Latin America NDT Industry Revenue (Million), by Type 2025 & 2033
- Figure 35: Latin America NDT Industry Revenue Share (%), by Type 2025 & 2033
- Figure 36: Latin America NDT Industry Revenue (Million), by Testing Technology 2025 & 2033
- Figure 37: Latin America NDT Industry Revenue Share (%), by Testing Technology 2025 & 2033
- Figure 38: Latin America NDT Industry Revenue (Million), by End-user Industry 2025 & 2033
- Figure 39: Latin America NDT Industry Revenue Share (%), by End-user Industry 2025 & 2033
- Figure 40: Latin America NDT Industry Revenue (Million), by Country 2025 & 2033
- Figure 41: Latin America NDT Industry Revenue Share (%), by Country 2025 & 2033
- Figure 42: Middle East and Africa NDT Industry Revenue (Million), by Type 2025 & 2033
- Figure 43: Middle East and Africa NDT Industry Revenue Share (%), by Type 2025 & 2033
- Figure 44: Middle East and Africa NDT Industry Revenue (Million), by Testing Technology 2025 & 2033
- Figure 45: Middle East and Africa NDT Industry Revenue Share (%), by Testing Technology 2025 & 2033
- Figure 46: Middle East and Africa NDT Industry Revenue (Million), by End-user Industry 2025 & 2033
- Figure 47: Middle East and Africa NDT Industry Revenue Share (%), by End-user Industry 2025 & 2033
- Figure 48: Middle East and Africa NDT Industry Revenue (Million), by Country 2025 & 2033
- Figure 49: Middle East and Africa NDT Industry Revenue Share (%), by Country 2025 & 2033
List of Tables
- Table 1: Global NDT Industry Revenue Million Forecast, by Type 2020 & 2033
- Table 2: Global NDT Industry Revenue Million Forecast, by Testing Technology 2020 & 2033
- Table 3: Global NDT Industry Revenue Million Forecast, by End-user Industry 2020 & 2033
- Table 4: Global NDT Industry Revenue Million Forecast, by Region 2020 & 2033
- Table 5: Global NDT Industry Revenue Million Forecast, by Type 2020 & 2033
- Table 6: Global NDT Industry Revenue Million Forecast, by Testing Technology 2020 & 2033
- Table 7: Global NDT Industry Revenue Million Forecast, by End-user Industry 2020 & 2033
- Table 8: Global NDT Industry Revenue Million Forecast, by Country 2020 & 2033
- Table 9: United States NDT Industry Revenue (Million) Forecast, by Application 2020 & 2033
- Table 10: Canada NDT Industry Revenue (Million) Forecast, by Application 2020 & 2033
- Table 11: Global NDT Industry Revenue Million Forecast, by Type 2020 & 2033
- Table 12: Global NDT Industry Revenue Million Forecast, by Testing Technology 2020 & 2033
- Table 13: Global NDT Industry Revenue Million Forecast, by End-user Industry 2020 & 2033
- Table 14: Global NDT Industry Revenue Million Forecast, by Country 2020 & 2033
- Table 15: Germany NDT Industry Revenue (Million) Forecast, by Application 2020 & 2033
- Table 16: United Kingdom NDT Industry Revenue (Million) Forecast, by Application 2020 & 2033
- Table 17: France NDT Industry Revenue (Million) Forecast, by Application 2020 & 2033
- Table 18: Global NDT Industry Revenue Million Forecast, by Type 2020 & 2033
- Table 19: Global NDT Industry Revenue Million Forecast, by Testing Technology 2020 & 2033
- Table 20: Global NDT Industry Revenue Million Forecast, by End-user Industry 2020 & 2033
- Table 21: Global NDT Industry Revenue Million Forecast, by Country 2020 & 2033
- Table 22: China NDT Industry Revenue (Million) Forecast, by Application 2020 & 2033
- Table 23: Japan NDT Industry Revenue (Million) Forecast, by Application 2020 & 2033
- Table 24: India NDT Industry Revenue (Million) Forecast, by Application 2020 & 2033
- Table 25: Global NDT Industry Revenue Million Forecast, by Type 2020 & 2033
- Table 26: Global NDT Industry Revenue Million Forecast, by Testing Technology 2020 & 2033
- Table 27: Global NDT Industry Revenue Million Forecast, by End-user Industry 2020 & 2033
- Table 28: Global NDT Industry Revenue Million Forecast, by Country 2020 & 2033
- Table 29: Global NDT Industry Revenue Million Forecast, by Type 2020 & 2033
- Table 30: Global NDT Industry Revenue Million Forecast, by Testing Technology 2020 & 2033
- Table 31: Global NDT Industry Revenue Million Forecast, by End-user Industry 2020 & 2033
- Table 32: Global NDT Industry Revenue Million Forecast, by Country 2020 & 2033
- Table 33: Brazil NDT Industry Revenue (Million) Forecast, by Application 2020 & 2033
- Table 34: Argentina NDT Industry Revenue (Million) Forecast, by Application 2020 & 2033
- Table 35: Mexico NDT Industry Revenue (Million) Forecast, by Application 2020 & 2033
- Table 36: Global NDT Industry Revenue Million Forecast, by Type 2020 & 2033
- Table 37: Global NDT Industry Revenue Million Forecast, by Testing Technology 2020 & 2033
- Table 38: Global NDT Industry Revenue Million Forecast, by End-user Industry 2020 & 2033
- Table 39: Global NDT Industry Revenue Million Forecast, by Country 2020 & 2033
- Table 40: United Arab Emirates NDT Industry Revenue (Million) Forecast, by Application 2020 & 2033
- Table 41: Saudi Arabia NDT Industry Revenue (Million) Forecast, by Application 2020 & 2033
- Table 42: South Africa NDT Industry Revenue (Million) Forecast, by Application 2020 & 2033
Frequently Asked Questions
1. What is the projected Compound Annual Growth Rate (CAGR) of the NDT Industry?
The projected CAGR is approximately 7.35%.
2. Which companies are prominent players in the NDT Industry?
Key companies in the market include Intertek Group Plc, Team Inc, Magnaflux Corp *List Not Exhaustive, SGS Group, Bureau Veritas S A, Nikon Metrology NV, Fujifilm Corporation, TÜV Rheinland AG, Mistras Group Inc, Yxlon International Gmbh (Comet Holding Ag), Applus Services, Olympus Corporation, GE Measurement & Control Solutions.
3. What are the main segments of the NDT Industry?
The market segments include Type, Testing Technology, End-user Industry.
4. Can you provide details about the market size?
The market size is estimated to be USD 2.53 Million as of 2022.
5. What are some drivers contributing to market growth?
; Stringent Regulations Mandating Safety Standards; Increase in Demand for Flaw Detection to Reduce Repair Cost.
6. What are the notable trends driving market growth?
Power and Energy Sector Offers Potential Growth.
7. Are there any restraints impacting market growth?
; Lack of Skilled Workforce and Training Regulations.
8. Can you provide examples of recent developments in the market?
N/A
9. What pricing options are available for accessing the report?
Pricing options include single-user, multi-user, and enterprise licenses priced at USD 4750, USD 5250, and USD 8750 respectively.
10. Is the market size provided in terms of value or volume?
The market size is provided in terms of value, measured in Million.
11. Are there any specific market keywords associated with the report?
Yes, the market keyword associated with the report is "NDT Industry," which aids in identifying and referencing the specific market segment covered.
12. How do I determine which pricing option suits my needs best?
The pricing options vary based on user requirements and access needs. Individual users may opt for single-user licenses, while businesses requiring broader access may choose multi-user or enterprise licenses for cost-effective access to the report.
13. Are there any additional resources or data provided in the NDT Industry report?
While the report offers comprehensive insights, it's advisable to review the specific contents or supplementary materials provided to ascertain if additional resources or data are available.
14. How can I stay updated on further developments or reports in the NDT Industry?
To stay informed about further developments, trends, and reports in the NDT Industry, consider subscribing to industry newsletters, following relevant companies and organizations, or regularly checking reputable industry news sources and publications.
Methodology
Step 1 - Identification of Relevant Samples Size from Population Database


Step 2 - Approaches for Defining Global Market Size (Value, Volume* & Price*)

Note*: In applicable scenarios
Step 3 - Data Sources
Primary Research
- Web Analytics
- Survey Reports
- Research Institute
- Latest Research Reports
- Opinion Leaders
Secondary Research
- Annual Reports
- White Paper
- Latest Press Release
- Industry Association
- Paid Database
- Investor Presentations

Step 4 - Data Triangulation
Involves using different sources of information in order to increase the validity of a study
These sources are likely to be stakeholders in a program - participants, other researchers, program staff, other community members, and so on.
Then we put all data in single framework & apply various statistical tools to find out the dynamic on the market.
During the analysis stage, feedback from the stakeholder groups would be compared to determine areas of agreement as well as areas of divergence