

Key Insights
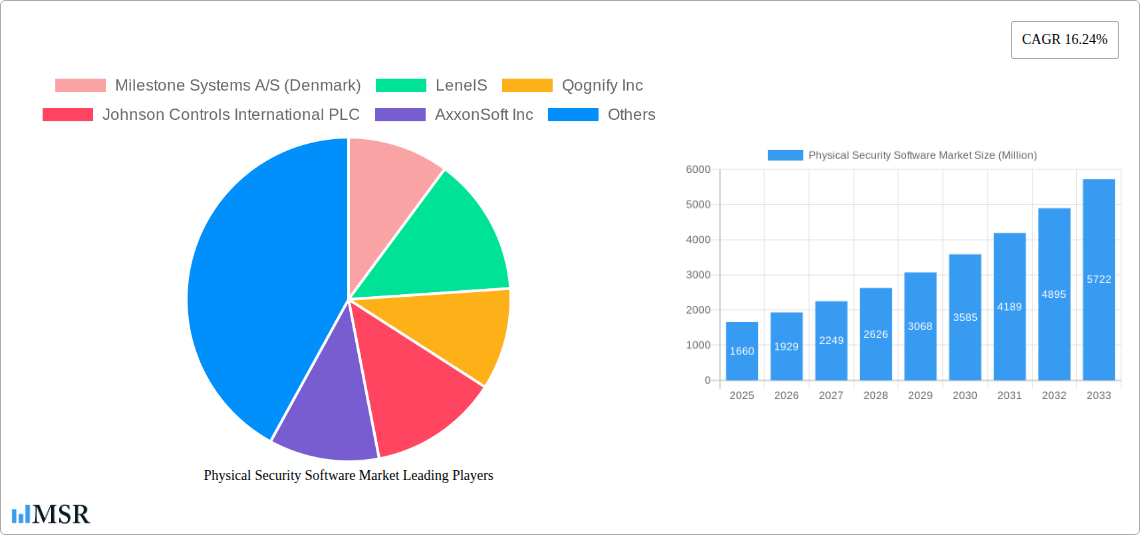
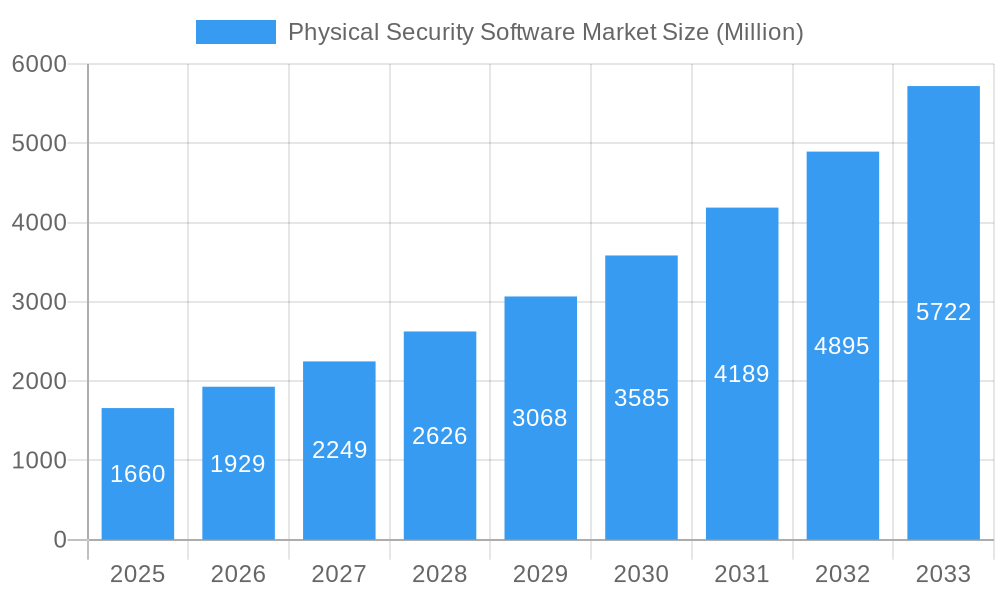
The Physical Security Software market is experiencing robust growth, projected to reach a value of $1.66 billion in 2025 and maintain a Compound Annual Growth Rate (CAGR) of 16.24% from 2025 to 2033. This expansion is driven by several key factors. The increasing adoption of cloud-based solutions offers scalability and cost-effectiveness, appealing to businesses of all sizes. Furthermore, the rising need for enhanced security in critical infrastructure sectors like BFSI (Banking, Financial Services, and Insurance), Transportation and Logistics, and Government and Defense is fueling demand. The integration of advanced technologies like AI and machine learning within physical security software is enhancing capabilities, leading to improved threat detection and response times. Growth is also propelled by the growing adoption of smart city initiatives globally, demanding sophisticated security management solutions. While data privacy concerns and the complexity of integrating diverse security systems present some challenges, the overall market outlook remains exceptionally positive.
Physical Security Software Market Market Size (In Billion)
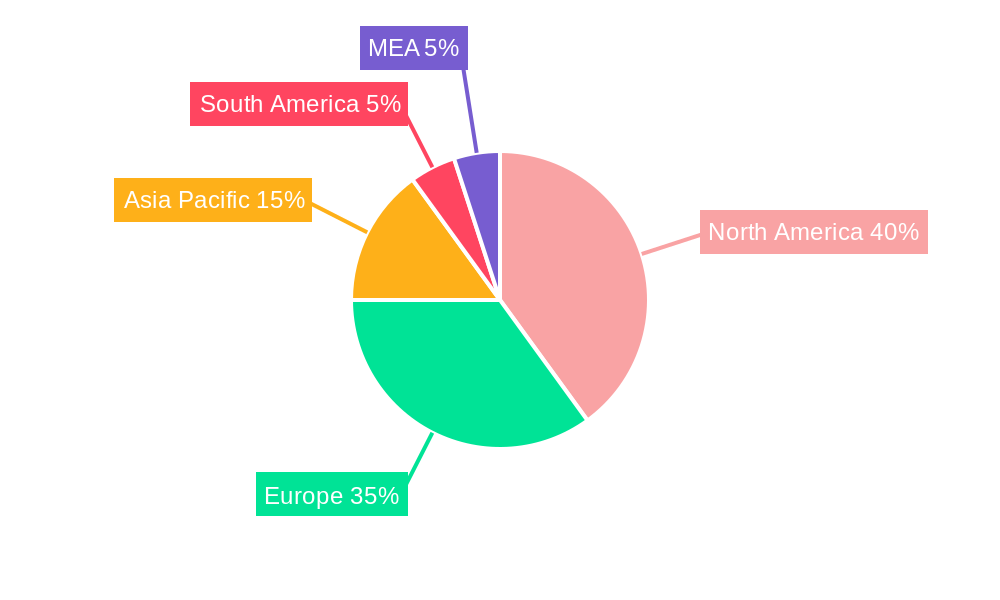
The market segmentation reveals a diversified landscape. The solution segment likely holds a significant share, with services providing essential support and maintenance. Cloud deployment is anticipated to witness accelerated growth due to its inherent advantages. Geographically, North America and Europe are currently leading the market, but the Asia-Pacific region is poised for substantial expansion, driven by rapid urbanization and increasing investments in security infrastructure. Key players like Milestone Systems, LenelS, and Qognify are actively innovating and expanding their market presence through strategic partnerships and acquisitions. The competitive landscape is dynamic, with ongoing efforts to develop more intelligent, integrated, and user-friendly solutions. The long-term forecast suggests continued robust growth, driven by technological advancements and increasing security demands across various industries and geographic regions.
Physical Security Software Market Company Market Share
Physical Security Software Market: A Comprehensive Report (2019-2033)
This in-depth report provides a comprehensive analysis of the Physical Security Software Market, encompassing market size, growth drivers, key players, and future trends. The study period covers 2019-2033, with 2025 as the base and estimated year. This report is crucial for industry stakeholders, investors, and anyone seeking actionable insights into this rapidly evolving market. The global market is projected to reach xx Million by 2033, exhibiting a CAGR of xx% during the forecast period (2025-2033).
Physical Security Software Market Concentration & Dynamics
The Physical Security Software market exhibits a moderately concentrated landscape, with a few dominant players holding significant market share. Milestone Systems A/S (Denmark), LenelS, Qognify Inc, and Johnson Controls International PLC are among the key players shaping market dynamics. The market concentration ratio (CR4) is estimated at xx%, indicating moderate dominance.
Market Dynamics:
- Innovation Ecosystems: Continuous innovation in areas like AI-powered video analytics, cloud-based solutions, and integrated security platforms is driving market growth.
- Regulatory Frameworks: Government regulations related to data privacy and cybersecurity are influencing the adoption of advanced security solutions, impacting market growth and technological innovation.
- Substitute Products: While traditional security systems remain prevalent, the increasing demand for efficient and cost-effective solutions is driving the adoption of physical security software.
- End-User Trends: The growing need for enhanced security across various sectors, including BFSI, transportation, and government, is fueling market growth.
- M&A Activities: The market has witnessed a moderate number of mergers and acquisitions (M&A) deals in recent years, with approximately xx deals recorded between 2019 and 2024, mainly focused on consolidating market share and expanding product portfolios.
Physical Security Software Market Industry Insights & Trends
The Physical Security Software market is experiencing robust growth, driven by increasing concerns about security threats and the rising adoption of advanced technologies. The market size reached xx Million in 2024 and is projected to reach xx Million by 2033, exhibiting a significant CAGR of xx%.
Several factors contribute to this growth:
- Technological advancements: AI, machine learning, and IoT integration are enhancing the capabilities of physical security software, enabling predictive analytics and proactive threat detection.
- Growing demand for cloud-based solutions: Cloud-based solutions offer scalability, cost-effectiveness, and remote accessibility, which are driving their adoption across various sectors.
- Rising cybersecurity concerns: The increasing number of cyberattacks targeting physical security systems is driving the demand for robust and secure solutions.
- Increased government spending on security infrastructure: Government initiatives to improve national security and critical infrastructure protection are boosting market growth.
Key Markets & Segments Leading Physical Security Software Market
Dominant Regions/Segments:
The North American region currently holds the largest market share, followed by Europe. Within the segments:
By End-user Industry: The Government and Defense sector dominates due to significant investment in security infrastructure and stringent security regulations. The BFSI sector is also a major contributor, driven by the need to protect financial assets and sensitive data. Transportation and Logistics is emerging as a rapidly growing segment.
By Type: The solution segment holds the largest market share due to the increasing demand for comprehensive security platforms.
By Deployment: Cloud-based deployments are gaining traction due to their scalability, flexibility, and cost-effectiveness. However, on-premise deployments still hold a significant market share, particularly in sectors with stringent data security requirements.
Growth Drivers by Segment:
- BFSI: Stringent regulatory compliance and the need to protect financial assets.
- Transportation and Logistics: Growing demand for enhanced security in supply chains and transportation networks.
- Government and Defense: Increased government spending on security infrastructure and national security initiatives.
- Retail: Rising concerns about shoplifting and retail fraud.
- Energy and Utilities: Protecting critical infrastructure from cyberattacks and physical threats.
Physical Security Software Market Product Developments
Recent product innovations focus on enhancing functionalities through AI-powered video analytics, improved integration with other security systems (like access control), and the adoption of cloud-based architectures. These advancements provide businesses with advanced threat detection capabilities, real-time monitoring, and improved response times, giving them a significant competitive edge.
Challenges in the Physical Security Software Market Market
The market faces challenges such as high initial investment costs for advanced solutions, integration complexities with existing infrastructure, and data security concerns. The increasing competition among vendors further intensifies these challenges. Supply chain disruptions also caused a xx% decrease in overall market growth in 2022.
Forces Driving Physical Security Software Market Growth
Key growth drivers include increasing adoption of cloud-based solutions, the integration of AI and machine learning, and stringent government regulations mandating enhanced security measures. These factors, coupled with rising cybersecurity threats across various industries, are propelling market expansion.
Long-Term Growth Catalysts in Physical Security Software Market
Long-term growth will be fueled by strategic partnerships between software providers and hardware manufacturers, continuous innovation in AI-powered analytics and automation, and expansion into emerging markets with developing security infrastructures. The focus on proactive security measures and predictive analytics will be crucial for sustained growth.
Emerging Opportunities in Physical Security Software Market
Emerging opportunities exist in the development of specialized solutions for specific industry verticals, the integration of biometric authentication, and the expansion into developing economies. The rising adoption of edge computing for real-time processing and improved response times presents significant potential.
Leading Players in the Physical Security Software Market Sector
- Milestone Systems A/S (Denmark)
- LenelS
- Qognify Inc
- Johnson Controls International PLC
- AxxonSoft Inc
- Advancis Software & Services GmbH
- Prysm Software
- Hexagon AB
- Vidsys Inc
- Genetec Inc
- Everbridge Inc
- Verint Systems Inc
- Ela-Soft GmbH
- Easypsim AG
- F A S T Systems Inc
- Octopus System
- VIDEONEXT Network Solutions
Key Milestones in Physical Security Software Market Industry
- May 2022: SureView Systems and ShotSpotter announced integration, enhancing law enforcement response times.
- September 2021: Hexagon AB launched a Physical Security & Surveillance Management portfolio for railways, integrating 3D surveillance systems.
Strategic Outlook for Physical Security Software Market Market
The Physical Security Software market holds significant potential for growth, driven by technological advancements and increasing security concerns. Strategic partnerships, targeted product development, and expansion into new markets will be crucial for companies to capitalize on future opportunities. The market is poised for substantial growth in the coming years, presenting lucrative prospects for industry players.
Physical Security Software Market Segmentation
-
1. Type
- 1.1. Solution
- 1.2. Services
-
2. Deployment
- 2.1. On-premise
- 2.2. Cloud
-
3. End-user Industry
- 3.1. BFSI
- 3.2. Transportation and Logistics
- 3.3. Government and Defense
- 3.4. Retail
- 3.5. Energy and Utilities
- 3.6. Other End-user Industries
Physical Security Software Market Segmentation By Geography
-
1. North America
- 1.1. Unites States
- 1.2. Canada
-
2. Europe
- 2.1. Germany
- 2.2. United Kingdom
- 2.3. France
- 2.4. Rest of Europe
-
3. Asia Pacific
- 3.1. India
- 3.2. China
- 3.3. Japan
- 3.4. Rest of Asia Pacific
- 4. Latin America
- 5. Middle East and Africa
Physical Security Software Market Regional Market Share
Geographic Coverage of Physical Security Software Market
Physical Security Software Market REPORT HIGHLIGHTS
| Aspects | Details |
|---|---|
| Study Period | 2020-2034 |
| Base Year | 2025 |
| Estimated Year | 2026 |
| Forecast Period | 2026-2034 |
| Historical Period | 2020-2025 |
| Growth Rate | CAGR of 16.24% from 2020-2034 |
| Segmentation |
|
Table of Contents
- 1. Introduction
- 1.1. Research Scope
- 1.2. Market Segmentation
- 1.3. Research Objective
- 1.4. Definitions and Assumptions
- 2. Executive Summary
- 2.1. Market Snapshot
- 3. Market Dynamics
- 3.1. Market Drivers
- 3.2. Market Restrains
- 3.3. Market Trends
- 3.4. Market Opportunities
- 4. Market Factor Analysis
- 4.1. Porters Five Forces
- 4.1.1. Bargaining Power of Suppliers
- 4.1.2. Bargaining Power of Buyers
- 4.1.3. Threat of New Entrants
- 4.1.4. Threat of Substitutes
- 4.1.5. Competitive Rivalry
- 4.2. PESTEL analysis
- 4.3. BCG Analysis
- 4.3.1. Stars (High Growth, High Market Share)
- 4.3.2. Cash Cows (Low Growth, High Market Share)
- 4.3.3. Question Mark (High Growth, Low Market Share)
- 4.3.4. Dogs (Low Growth, Low Market Share)
- 4.4. Ansoff Matrix Analysis
- 4.5. Supply Chain Analysis
- 4.6. Regulatory Landscape
- 4.7. Current Market Potential and Opportunity Assessment (TAM–SAM–SOM Framework)
- 4.8. MSR Analyst Note
- 4.1. Porters Five Forces
- 5. Market Analysis, Insights and Forecast 2021-2033
- 5.1. Market Analysis, Insights and Forecast - by Type
- 5.1.1. Solution
- 5.1.2. Services
- 5.2. Market Analysis, Insights and Forecast - by Deployment
- 5.2.1. On-premise
- 5.2.2. Cloud
- 5.3. Market Analysis, Insights and Forecast - by End-user Industry
- 5.3.1. BFSI
- 5.3.2. Transportation and Logistics
- 5.3.3. Government and Defense
- 5.3.4. Retail
- 5.3.5. Energy and Utilities
- 5.3.6. Other End-user Industries
- 5.4. Market Analysis, Insights and Forecast - by Region
- 5.4.1. North America
- 5.4.2. Europe
- 5.4.3. Asia Pacific
- 5.4.4. Latin America
- 5.4.5. Middle East and Africa
- 5.1. Market Analysis, Insights and Forecast - by Type
- 6. Global Physical Security Software Market Analysis, Insights and Forecast, 2021-2033
- 6.1. Market Analysis, Insights and Forecast - by Type
- 6.1.1. Solution
- 6.1.2. Services
- 6.2. Market Analysis, Insights and Forecast - by Deployment
- 6.2.1. On-premise
- 6.2.2. Cloud
- 6.3. Market Analysis, Insights and Forecast - by End-user Industry
- 6.3.1. BFSI
- 6.3.2. Transportation and Logistics
- 6.3.3. Government and Defense
- 6.3.4. Retail
- 6.3.5. Energy and Utilities
- 6.3.6. Other End-user Industries
- 6.1. Market Analysis, Insights and Forecast - by Type
- 7. North America Physical Security Software Market Analysis, Insights and Forecast, 2020-2032
- 7.1. Market Analysis, Insights and Forecast - by Type
- 7.1.1. Solution
- 7.1.2. Services
- 7.2. Market Analysis, Insights and Forecast - by Deployment
- 7.2.1. On-premise
- 7.2.2. Cloud
- 7.3. Market Analysis, Insights and Forecast - by End-user Industry
- 7.3.1. BFSI
- 7.3.2. Transportation and Logistics
- 7.3.3. Government and Defense
- 7.3.4. Retail
- 7.3.5. Energy and Utilities
- 7.3.6. Other End-user Industries
- 7.1. Market Analysis, Insights and Forecast - by Type
- 8. Europe Physical Security Software Market Analysis, Insights and Forecast, 2020-2032
- 8.1. Market Analysis, Insights and Forecast - by Type
- 8.1.1. Solution
- 8.1.2. Services
- 8.2. Market Analysis, Insights and Forecast - by Deployment
- 8.2.1. On-premise
- 8.2.2. Cloud
- 8.3. Market Analysis, Insights and Forecast - by End-user Industry
- 8.3.1. BFSI
- 8.3.2. Transportation and Logistics
- 8.3.3. Government and Defense
- 8.3.4. Retail
- 8.3.5. Energy and Utilities
- 8.3.6. Other End-user Industries
- 8.1. Market Analysis, Insights and Forecast - by Type
- 9. Asia Pacific Physical Security Software Market Analysis, Insights and Forecast, 2020-2032
- 9.1. Market Analysis, Insights and Forecast - by Type
- 9.1.1. Solution
- 9.1.2. Services
- 9.2. Market Analysis, Insights and Forecast - by Deployment
- 9.2.1. On-premise
- 9.2.2. Cloud
- 9.3. Market Analysis, Insights and Forecast - by End-user Industry
- 9.3.1. BFSI
- 9.3.2. Transportation and Logistics
- 9.3.3. Government and Defense
- 9.3.4. Retail
- 9.3.5. Energy and Utilities
- 9.3.6. Other End-user Industries
- 9.1. Market Analysis, Insights and Forecast - by Type
- 10. Latin America Physical Security Software Market Analysis, Insights and Forecast, 2020-2032
- 10.1. Market Analysis, Insights and Forecast - by Type
- 10.1.1. Solution
- 10.1.2. Services
- 10.2. Market Analysis, Insights and Forecast - by Deployment
- 10.2.1. On-premise
- 10.2.2. Cloud
- 10.3. Market Analysis, Insights and Forecast - by End-user Industry
- 10.3.1. BFSI
- 10.3.2. Transportation and Logistics
- 10.3.3. Government and Defense
- 10.3.4. Retail
- 10.3.5. Energy and Utilities
- 10.3.6. Other End-user Industries
- 10.1. Market Analysis, Insights and Forecast - by Type
- 11. Middle East and Africa Physical Security Software Market Analysis, Insights and Forecast, 2020-2032
- 11.1. Market Analysis, Insights and Forecast - by Type
- 11.1.1. Solution
- 11.1.2. Services
- 11.2. Market Analysis, Insights and Forecast - by Deployment
- 11.2.1. On-premise
- 11.2.2. Cloud
- 11.3. Market Analysis, Insights and Forecast - by End-user Industry
- 11.3.1. BFSI
- 11.3.2. Transportation and Logistics
- 11.3.3. Government and Defense
- 11.3.4. Retail
- 11.3.5. Energy and Utilities
- 11.3.6. Other End-user Industries
- 11.1. Market Analysis, Insights and Forecast - by Type
- 12. Competitive Analysis
- 12.1. Company Profiles
- 12.1.1 Milestone Systems A/S (Denmark)
- 12.1.1.1. Company Overview
- 12.1.1.2. Products
- 12.1.1.3. Company Financials
- 12.1.1.4. SWOT Analysis
- 12.1.2 LenelS
- 12.1.2.1. Company Overview
- 12.1.2.2. Products
- 12.1.2.3. Company Financials
- 12.1.2.4. SWOT Analysis
- 12.1.3 Qognify Inc
- 12.1.3.1. Company Overview
- 12.1.3.2. Products
- 12.1.3.3. Company Financials
- 12.1.3.4. SWOT Analysis
- 12.1.4 Johnson Controls International PLC
- 12.1.4.1. Company Overview
- 12.1.4.2. Products
- 12.1.4.3. Company Financials
- 12.1.4.4. SWOT Analysis
- 12.1.5 AxxonSoft Inc
- 12.1.5.1. Company Overview
- 12.1.5.2. Products
- 12.1.5.3. Company Financials
- 12.1.5.4. SWOT Analysis
- 12.1.6 Advancis Software & Services GmbH
- 12.1.6.1. Company Overview
- 12.1.6.2. Products
- 12.1.6.3. Company Financials
- 12.1.6.4. SWOT Analysis
- 12.1.7 Prysm Software
- 12.1.7.1. Company Overview
- 12.1.7.2. Products
- 12.1.7.3. Company Financials
- 12.1.7.4. SWOT Analysis
- 12.1.8 Hexagon AB
- 12.1.8.1. Company Overview
- 12.1.8.2. Products
- 12.1.8.3. Company Financials
- 12.1.8.4. SWOT Analysis
- 12.1.9 Vidsys Inc
- 12.1.9.1. Company Overview
- 12.1.9.2. Products
- 12.1.9.3. Company Financials
- 12.1.9.4. SWOT Analysis
- 12.1.10 Genetec Inc
- 12.1.10.1. Company Overview
- 12.1.10.2. Products
- 12.1.10.3. Company Financials
- 12.1.10.4. SWOT Analysis
- 12.1.11 Everbridge Inc
- 12.1.11.1. Company Overview
- 12.1.11.2. Products
- 12.1.11.3. Company Financials
- 12.1.11.4. SWOT Analysis
- 12.1.12 Verint Systems Inc
- 12.1.12.1. Company Overview
- 12.1.12.2. Products
- 12.1.12.3. Company Financials
- 12.1.12.4. SWOT Analysis
- 12.1.13 Ela-Soft GmbH
- 12.1.13.1. Company Overview
- 12.1.13.2. Products
- 12.1.13.3. Company Financials
- 12.1.13.4. SWOT Analysis
- 12.1.14 Easypsim AG
- 12.1.14.1. Company Overview
- 12.1.14.2. Products
- 12.1.14.3. Company Financials
- 12.1.14.4. SWOT Analysis
- 12.1.15 F A S T Systems Inc
- 12.1.15.1. Company Overview
- 12.1.15.2. Products
- 12.1.15.3. Company Financials
- 12.1.15.4. SWOT Analysis
- 12.1.16 Octopus System
- 12.1.16.1. Company Overview
- 12.1.16.2. Products
- 12.1.16.3. Company Financials
- 12.1.16.4. SWOT Analysis
- 12.1.17 VIDEONEXT Network Solutions
- 12.1.17.1. Company Overview
- 12.1.17.2. Products
- 12.1.17.3. Company Financials
- 12.1.17.4. SWOT Analysis
- 12.1.1 Milestone Systems A/S (Denmark)
- 12.2. Market Entropy
- 12.2.1 Company's Key Areas Served
- 12.2.2 Recent Developments
- 12.3. Company Market Share Analysis 2025
- 12.3.1 Top 5 Companies Market Share Analysis
- 12.3.2 Top 3 Companies Market Share Analysis
- 12.4. List of Potential Customers
- 13. Research Methodology
List of Figures
- Figure 1: Global Physical Security Software Market Revenue Breakdown (Million, %) by Region 2025 & 2033
- Figure 2: North America Physical Security Software Market Revenue (Million), by Type 2025 & 2033
- Figure 3: North America Physical Security Software Market Revenue Share (%), by Type 2025 & 2033
- Figure 4: North America Physical Security Software Market Revenue (Million), by Deployment 2025 & 2033
- Figure 5: North America Physical Security Software Market Revenue Share (%), by Deployment 2025 & 2033
- Figure 6: North America Physical Security Software Market Revenue (Million), by End-user Industry 2025 & 2033
- Figure 7: North America Physical Security Software Market Revenue Share (%), by End-user Industry 2025 & 2033
- Figure 8: North America Physical Security Software Market Revenue (Million), by Country 2025 & 2033
- Figure 9: North America Physical Security Software Market Revenue Share (%), by Country 2025 & 2033
- Figure 10: Europe Physical Security Software Market Revenue (Million), by Type 2025 & 2033
- Figure 11: Europe Physical Security Software Market Revenue Share (%), by Type 2025 & 2033
- Figure 12: Europe Physical Security Software Market Revenue (Million), by Deployment 2025 & 2033
- Figure 13: Europe Physical Security Software Market Revenue Share (%), by Deployment 2025 & 2033
- Figure 14: Europe Physical Security Software Market Revenue (Million), by End-user Industry 2025 & 2033
- Figure 15: Europe Physical Security Software Market Revenue Share (%), by End-user Industry 2025 & 2033
- Figure 16: Europe Physical Security Software Market Revenue (Million), by Country 2025 & 2033
- Figure 17: Europe Physical Security Software Market Revenue Share (%), by Country 2025 & 2033
- Figure 18: Asia Pacific Physical Security Software Market Revenue (Million), by Type 2025 & 2033
- Figure 19: Asia Pacific Physical Security Software Market Revenue Share (%), by Type 2025 & 2033
- Figure 20: Asia Pacific Physical Security Software Market Revenue (Million), by Deployment 2025 & 2033
- Figure 21: Asia Pacific Physical Security Software Market Revenue Share (%), by Deployment 2025 & 2033
- Figure 22: Asia Pacific Physical Security Software Market Revenue (Million), by End-user Industry 2025 & 2033
- Figure 23: Asia Pacific Physical Security Software Market Revenue Share (%), by End-user Industry 2025 & 2033
- Figure 24: Asia Pacific Physical Security Software Market Revenue (Million), by Country 2025 & 2033
- Figure 25: Asia Pacific Physical Security Software Market Revenue Share (%), by Country 2025 & 2033
- Figure 26: Latin America Physical Security Software Market Revenue (Million), by Type 2025 & 2033
- Figure 27: Latin America Physical Security Software Market Revenue Share (%), by Type 2025 & 2033
- Figure 28: Latin America Physical Security Software Market Revenue (Million), by Deployment 2025 & 2033
- Figure 29: Latin America Physical Security Software Market Revenue Share (%), by Deployment 2025 & 2033
- Figure 30: Latin America Physical Security Software Market Revenue (Million), by End-user Industry 2025 & 2033
- Figure 31: Latin America Physical Security Software Market Revenue Share (%), by End-user Industry 2025 & 2033
- Figure 32: Latin America Physical Security Software Market Revenue (Million), by Country 2025 & 2033
- Figure 33: Latin America Physical Security Software Market Revenue Share (%), by Country 2025 & 2033
- Figure 34: Middle East and Africa Physical Security Software Market Revenue (Million), by Type 2025 & 2033
- Figure 35: Middle East and Africa Physical Security Software Market Revenue Share (%), by Type 2025 & 2033
- Figure 36: Middle East and Africa Physical Security Software Market Revenue (Million), by Deployment 2025 & 2033
- Figure 37: Middle East and Africa Physical Security Software Market Revenue Share (%), by Deployment 2025 & 2033
- Figure 38: Middle East and Africa Physical Security Software Market Revenue (Million), by End-user Industry 2025 & 2033
- Figure 39: Middle East and Africa Physical Security Software Market Revenue Share (%), by End-user Industry 2025 & 2033
- Figure 40: Middle East and Africa Physical Security Software Market Revenue (Million), by Country 2025 & 2033
- Figure 41: Middle East and Africa Physical Security Software Market Revenue Share (%), by Country 2025 & 2033
List of Tables
- Table 1: Global Physical Security Software Market Revenue Million Forecast, by Type 2020 & 2033
- Table 2: Global Physical Security Software Market Revenue Million Forecast, by Deployment 2020 & 2033
- Table 3: Global Physical Security Software Market Revenue Million Forecast, by End-user Industry 2020 & 2033
- Table 4: Global Physical Security Software Market Revenue Million Forecast, by Region 2020 & 2033
- Table 5: Global Physical Security Software Market Revenue Million Forecast, by Type 2020 & 2033
- Table 6: Global Physical Security Software Market Revenue Million Forecast, by Deployment 2020 & 2033
- Table 7: Global Physical Security Software Market Revenue Million Forecast, by End-user Industry 2020 & 2033
- Table 8: Global Physical Security Software Market Revenue Million Forecast, by Country 2020 & 2033
- Table 9: Unites States Physical Security Software Market Revenue (Million) Forecast, by Application 2020 & 2033
- Table 10: Canada Physical Security Software Market Revenue (Million) Forecast, by Application 2020 & 2033
- Table 11: Global Physical Security Software Market Revenue Million Forecast, by Type 2020 & 2033
- Table 12: Global Physical Security Software Market Revenue Million Forecast, by Deployment 2020 & 2033
- Table 13: Global Physical Security Software Market Revenue Million Forecast, by End-user Industry 2020 & 2033
- Table 14: Global Physical Security Software Market Revenue Million Forecast, by Country 2020 & 2033
- Table 15: Germany Physical Security Software Market Revenue (Million) Forecast, by Application 2020 & 2033
- Table 16: United Kingdom Physical Security Software Market Revenue (Million) Forecast, by Application 2020 & 2033
- Table 17: France Physical Security Software Market Revenue (Million) Forecast, by Application 2020 & 2033
- Table 18: Rest of Europe Physical Security Software Market Revenue (Million) Forecast, by Application 2020 & 2033
- Table 19: Global Physical Security Software Market Revenue Million Forecast, by Type 2020 & 2033
- Table 20: Global Physical Security Software Market Revenue Million Forecast, by Deployment 2020 & 2033
- Table 21: Global Physical Security Software Market Revenue Million Forecast, by End-user Industry 2020 & 2033
- Table 22: Global Physical Security Software Market Revenue Million Forecast, by Country 2020 & 2033
- Table 23: India Physical Security Software Market Revenue (Million) Forecast, by Application 2020 & 2033
- Table 24: China Physical Security Software Market Revenue (Million) Forecast, by Application 2020 & 2033
- Table 25: Japan Physical Security Software Market Revenue (Million) Forecast, by Application 2020 & 2033
- Table 26: Rest of Asia Pacific Physical Security Software Market Revenue (Million) Forecast, by Application 2020 & 2033
- Table 27: Global Physical Security Software Market Revenue Million Forecast, by Type 2020 & 2033
- Table 28: Global Physical Security Software Market Revenue Million Forecast, by Deployment 2020 & 2033
- Table 29: Global Physical Security Software Market Revenue Million Forecast, by End-user Industry 2020 & 2033
- Table 30: Global Physical Security Software Market Revenue Million Forecast, by Country 2020 & 2033
- Table 31: Global Physical Security Software Market Revenue Million Forecast, by Type 2020 & 2033
- Table 32: Global Physical Security Software Market Revenue Million Forecast, by Deployment 2020 & 2033
- Table 33: Global Physical Security Software Market Revenue Million Forecast, by End-user Industry 2020 & 2033
- Table 34: Global Physical Security Software Market Revenue Million Forecast, by Country 2020 & 2033
Frequently Asked Questions
1. What is the projected Compound Annual Growth Rate (CAGR) of the Physical Security Software Market?
The projected CAGR is approximately 16.24%.
2. Which companies are prominent players in the Physical Security Software Market?
Key companies in the market include Milestone Systems A/S (Denmark), LenelS, Qognify Inc, Johnson Controls International PLC, AxxonSoft Inc, Advancis Software & Services GmbH, Prysm Software, Hexagon AB, Vidsys Inc, Genetec Inc, Everbridge Inc, Verint Systems Inc, Ela-Soft GmbH, Easypsim AG, F A S T Systems Inc, Octopus System, VIDEONEXT Network Solutions.
3. What are the main segments of the Physical Security Software Market?
The market segments include Type, Deployment, End-user Industry.
4. Can you provide details about the market size?
The market size is estimated to be USD 1.66 Million as of 2022.
5. What are some drivers contributing to market growth?
Increasing Government Initiatives for Smart Cities; Surging Demand for Sophisticated Organizational Security.
6. What are the notable trends driving market growth?
Government and Defense Have Significant Shares in the Market.
7. Are there any restraints impacting market growth?
High Deployment and Integration Costs.
8. Can you provide examples of recent developments in the market?
May 2022 - SureView Systems, a provider of open response platforms, and ShotSpotter, a provider of police technology solutions, announced that SureView can interact with ShotSpotter. SureView and ShotSpotter demonstrate how combining their disparate technology may help law enforcement respond more swiftly to incidents. Furthermore, the existence of the things will help in crime prevention. The combination of ShotSpotter's gunshot alerts and SureView's PSIM provides security operations teams with the tactical information they require to respond and save people with a clear picture of events.
9. What pricing options are available for accessing the report?
Pricing options include single-user, multi-user, and enterprise licenses priced at USD 4750, USD 5250, and USD 8750 respectively.
10. Is the market size provided in terms of value or volume?
The market size is provided in terms of value, measured in Million.
11. Are there any specific market keywords associated with the report?
Yes, the market keyword associated with the report is "Physical Security Software Market," which aids in identifying and referencing the specific market segment covered.
12. How do I determine which pricing option suits my needs best?
The pricing options vary based on user requirements and access needs. Individual users may opt for single-user licenses, while businesses requiring broader access may choose multi-user or enterprise licenses for cost-effective access to the report.
13. Are there any additional resources or data provided in the Physical Security Software Market report?
While the report offers comprehensive insights, it's advisable to review the specific contents or supplementary materials provided to ascertain if additional resources or data are available.
14. How can I stay updated on further developments or reports in the Physical Security Software Market?
To stay informed about further developments, trends, and reports in the Physical Security Software Market, consider subscribing to industry newsletters, following relevant companies and organizations, or regularly checking reputable industry news sources and publications.
Methodology
Step 1 - Identification of Relevant Samples Size from Population Database


Step 2 - Approaches for Defining Global Market Size (Value, Volume* & Price*)

Note*: In applicable scenarios
Step 3 - Data Sources
Primary Research
- Web Analytics
- Survey Reports
- Research Institute
- Latest Research Reports
- Opinion Leaders
Secondary Research
- Annual Reports
- White Paper
- Latest Press Release
- Industry Association
- Paid Database
- Investor Presentations

Step 4 - Data Triangulation
Involves using different sources of information in order to increase the validity of a study
These sources are likely to be stakeholders in a program - participants, other researchers, program staff, other community members, and so on.
Then we put all data in single framework & apply various statistical tools to find out the dynamic on the market.
During the analysis stage, feedback from the stakeholder groups would be compared to determine areas of agreement as well as areas of divergence