

Key Insights
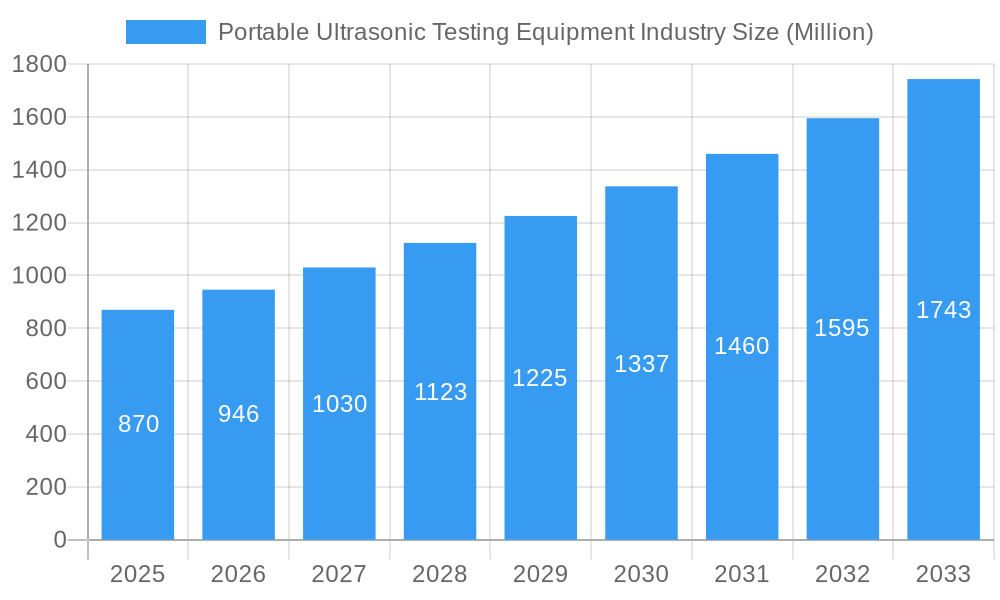
The global portable ultrasonic testing equipment market, valued at $0.87 billion in 2025, is poised for substantial growth, exhibiting a compound annual growth rate (CAGR) of 8.79% from 2025 to 2033. This expansion is driven by several key factors. Increased demand across diverse industries like aerospace, automotive, and energy for non-destructive testing (NDT) solutions is a primary driver. The rising need for enhanced quality control, preventative maintenance, and structural integrity assessments fuels this demand. Technological advancements leading to more portable, user-friendly, and sophisticated ultrasonic testing equipment further contribute to market growth. Specifically, the integration of advanced features like improved imaging capabilities, data analysis software, and wireless connectivity is enhancing the efficiency and accuracy of inspections, making the technology attractive to a broader range of users. The growth is also fueled by stringent regulatory compliance requirements in several sectors necessitating rigorous testing and inspection protocols.
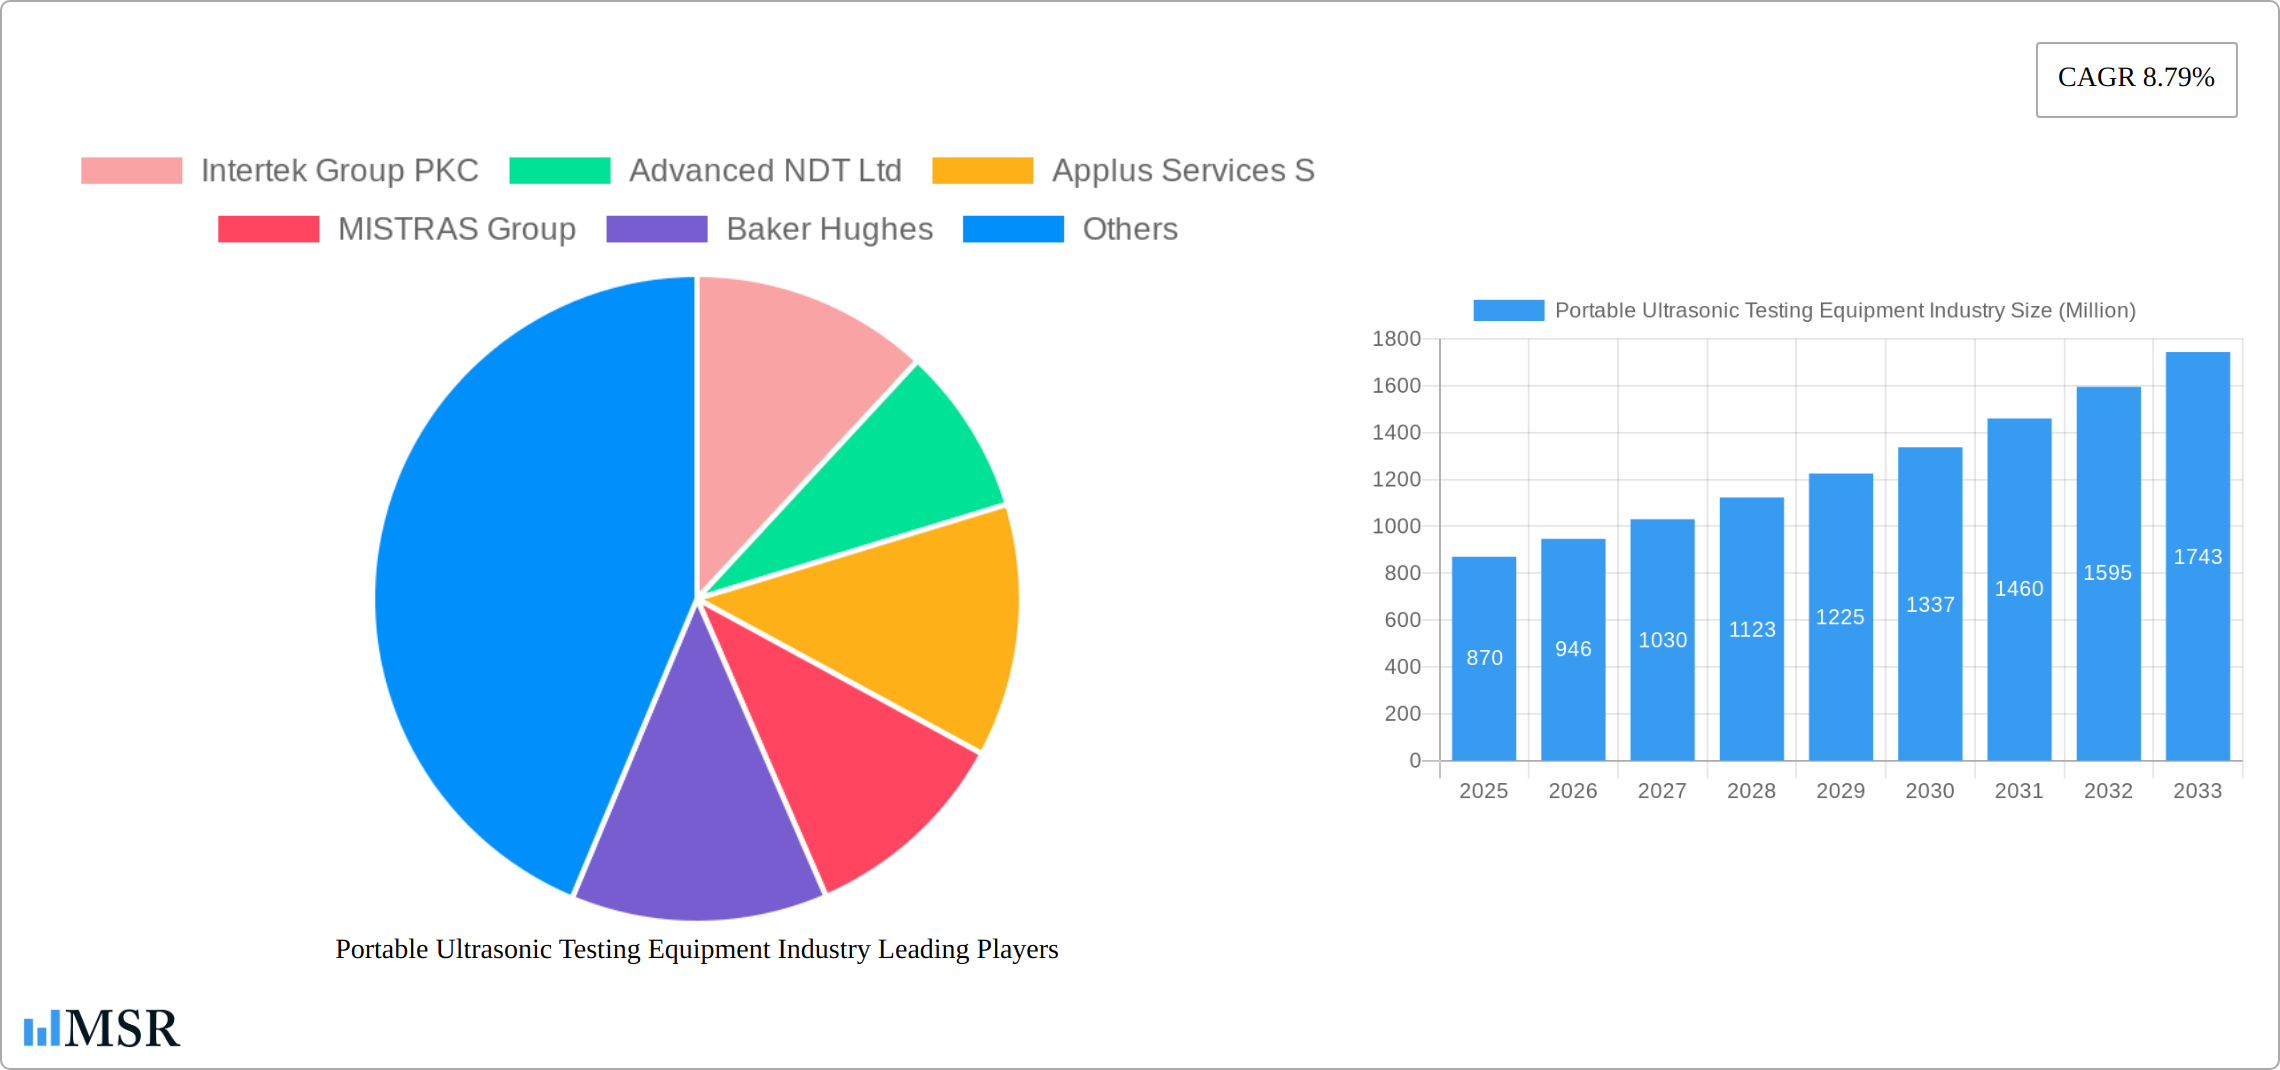
Portable Ultrasonic Testing Equipment Industry Market Size (In Million)
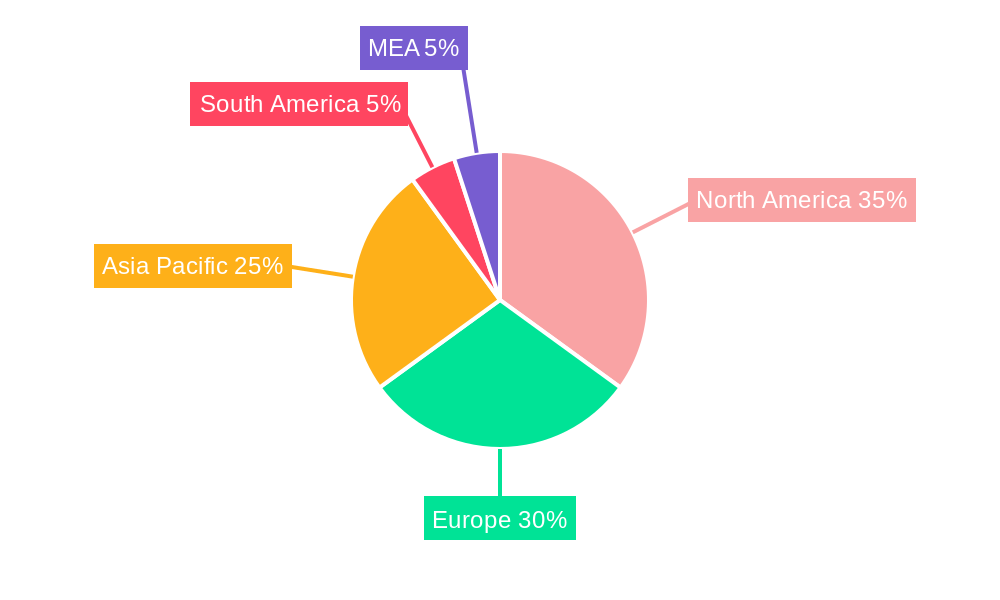
However, market growth is not without challenges. The high initial investment costs associated with purchasing advanced equipment can act as a restraint, particularly for smaller companies. The need for skilled technicians proficient in operating and interpreting ultrasonic testing results also poses a barrier to wider adoption. Competition among established players and emerging technology providers can also impact market dynamics. Nevertheless, the market is expected to witness considerable growth in the forecast period, with consistent expansion across all major geographical regions. North America and Europe are currently leading the market owing to strong industrial bases and advanced technological infrastructure. However, the Asia-Pacific region is projected to demonstrate significant growth in the coming years, driven by industrialization and infrastructure development in countries such as China and India. The market segmentation by product type (manual, automated, handheld) and application will continue to evolve, with increasing demand for automated and handheld solutions due to their ease of use and adaptability to various testing scenarios.
Portable Ultrasonic Testing Equipment Industry Company Market Share
Portable Ultrasonic Testing Equipment Industry: A Comprehensive Market Report (2019-2033)
This comprehensive report provides an in-depth analysis of the Portable Ultrasonic Testing Equipment industry, offering invaluable insights for stakeholders, investors, and industry professionals. Covering the period 2019-2033, with a base year of 2025 and a forecast period of 2025-2033, this report unveils market dynamics, growth drivers, key players, and emerging opportunities. The global market size is projected to reach xx Million by 2033, exhibiting a CAGR of xx% during the forecast period.
Portable Ultrasonic Testing Equipment Industry Market Concentration & Dynamics
The portable ultrasonic testing equipment market exhibits a moderately consolidated structure, with several key players holding significant market share. The top 10 companies, including Intertek Group PKC, Advanced NDT Ltd, Applus Services S.A., MISTRAS Group, Baker Hughes, Russell Fraser Sales Pty Ltd, OkoNDT group, ROSEN Group, Bureau Veritas SA, Johnson and Allen Ltd, and Olympus Corporation, collectively account for an estimated xx% of the global market. Market share dynamics are influenced by factors such as technological innovation, strategic acquisitions, and geographical expansion.
The industry is characterized by a dynamic innovation ecosystem, with ongoing advancements in sensor technology, data analytics, and automation driving product development. Regulatory frameworks, particularly concerning safety and quality standards, play a crucial role in shaping market practices. Substitute products, such as radiographic testing and magnetic particle inspection, pose competitive challenges. End-user trends toward increased automation and improved efficiency are significantly impacting market demand. M&A activity in the sector has been moderate, with xx major deals recorded during the historical period (2019-2024), primarily focused on expanding geographical reach and technological capabilities.
- Market Concentration: Moderately consolidated, top 10 players holding xx% market share.
- Innovation: Continuous advancements in sensor technology, data analytics, and automation.
- Regulations: Stringent safety and quality standards influence market practices.
- Substitutes: Radiographic and magnetic particle inspection pose competitive pressure.
- End-user trends: Increased demand for automation and efficiency.
- M&A Activity: xx major deals (2019-2024), focused on expansion and technology.
Portable Ultrasonic Testing Equipment Industry Insights & Trends
The global portable ultrasonic testing equipment market is experiencing robust growth, driven by several key factors. The increasing demand for non-destructive testing (NDT) across diverse industries, coupled with technological advancements leading to more efficient and portable equipment, are the primary catalysts for market expansion. The rising adoption of advanced materials in various applications necessitates rigorous testing procedures, further fueling market growth. The automotive, aerospace, and energy sectors are key contributors to this demand, owing to stringent quality control requirements. The market is witnessing a shift towards automated and handheld ultrasonic testing equipment, driven by their enhanced accuracy, ease of use, and improved productivity. The global market size was valued at xx Million in 2024 and is projected to reach xx Million by 2033, exhibiting a Compound Annual Growth Rate (CAGR) of xx% during the forecast period. This growth is further fueled by evolving consumer behaviors that prioritize faster turnaround times, improved accuracy, and enhanced data analysis capabilities.
Key Markets & Segments Leading Portable Ultrasonic Testing Equipment Industry
The dominant regions for portable ultrasonic testing equipment are North America and Europe, driven by robust industrial activity and stringent quality control regulations. Within product types, handheld ultrasonic testing equipment commands the largest market share, owing to its portability, ease of use, and cost-effectiveness. The manufacturing sector remains the largest application segment, followed by aerospace and energy.
Dominant Regions: North America and Europe.
Leading Product Types: Handheld ultrasonic testing equipment holds the largest market share.
Largest Application Segment: Manufacturing, followed by aerospace and energy.
Drivers for Key Segments:
- Manufacturing: Stringent quality control requirements, high production volumes.
- Aerospace: Demand for lightweight yet high-strength materials, stringent safety regulations.
- Energy: Inspection and maintenance of pipelines, turbines, and other critical infrastructure.
- Automotive: Quality control in manufacturing processes, non-destructive testing of components.
- Construction: Inspection of welds, reinforcement, and other critical structural elements.
Portable Ultrasonic Testing Equipment Industry Product Developments
Recent years have witnessed significant advancements in portable ultrasonic testing equipment, including the integration of advanced sensors, improved data processing capabilities, and the development of user-friendly software interfaces. These innovations have led to increased accuracy, enhanced portability, and improved data analysis. The incorporation of AI and machine learning is further enhancing the capabilities of these devices, enabling faster and more accurate defect detection. These developments provide manufacturers with a significant competitive edge, allowing them to offer more efficient and reliable testing solutions.
Challenges in the Portable Ultrasonic Testing Equipment Industry Market
The portable ultrasonic testing equipment market faces several challenges, including increasing competition, supply chain disruptions, and regulatory hurdles. The highly competitive landscape necessitates continuous innovation and strategic partnerships to maintain market share. Supply chain bottlenecks, particularly concerning raw materials and components, can impact production timelines and overall costs. Stringent regulatory compliance requirements, varying across different geographical regions, pose additional hurdles for manufacturers. These factors can collectively impact profitability and market growth.
Forces Driving Portable Ultrasonic Testing Equipment Industry Growth
The portable ultrasonic testing (UT) equipment industry is experiencing robust growth, propelled by a confluence of dynamic factors. A primary driver is the relentless pace of **technological advancements**, yielding more sophisticated, compact, and user-friendly UT devices. These innovations enhance precision, speed, and data interpretation capabilities, making them indispensable tools. Concurrently, the **increasing adoption of Non-Destructive Testing (NDT)** methodologies across a multitude of sectors, including aerospace, oil & gas, automotive, and manufacturing, is significantly fueling market expansion. This surge is directly linked to escalating **stringent quality control standards** and safety regulations, compelling industries to invest in reliable inspection solutions. Furthermore, **supportive government regulations and initiatives** that encourage the adoption of advanced NDT technologies and promote infrastructure development also play a pivotal role. The global push for enhanced **infrastructure projects**, coupled with the overarching demand for efficient, accurate, and portable testing solutions that minimize downtime and operational costs, creates substantial growth opportunities for the portable ultrasonic testing equipment market.
Long-Term Growth Catalysts in the Portable Ultrasonic Testing Equipment Industry
Long-term growth in the portable ultrasonic testing equipment market will be driven by continued innovation in sensor technology, data analytics, and automation. Strategic partnerships between manufacturers and end-users will foster the development of customized testing solutions. Expansion into emerging markets, particularly in developing economies with growing infrastructure development, will further contribute to long-term growth.
Emerging Opportunities in Portable Ultrasonic Testing Equipment Industry
The landscape of the portable ultrasonic testing equipment industry is ripe with emerging opportunities. A significant frontier lies in the **development and integration of artificial intelligence (AI) and machine learning (ML)**. AI-powered UT solutions offer the potential for real-time data analysis, automated defect detection and classification, and predictive maintenance insights, revolutionizing how inspections are conducted. The **expansion of the Internet of Things (IoT)** into UT equipment presents another avenue for growth, enabling remote monitoring, data logging, and seamless integration with enterprise asset management systems. Beyond traditional applications, there's considerable untapped potential in **penetrating niche and emerging markets**. This includes the medical industry for non-invasive diagnostics and material analysis, the food processing sector for quality control and integrity checks, and even in advanced materials research. The miniaturization and enhanced portability of UT devices also open doors for their application in previously inaccessible or challenging environments.
Leading Players in the Portable Ultrasonic Testing Equipment Industry Sector
- Intertek Group PKC
- Advanced NDT Ltd
- Applus Services S.A.
- MISTRAS Group
- Baker Hughes
- Russell Fraser Sales Pty Ltd
- OkoNDT group
- ROSEN Group
- Bureau Veritas SA
- Johnson and Allen Ltd
- Olympus Corporation
- GE Inspection Technologies
- Sonatest
- NDT Systems
Key Milestones in Portable Ultrasonic Testing Equipment Industry
- July 2022: Applus+ secured a substantial two-year contract for comprehensive non-destructive testing services on maritime assets, with ultrasonic testing being a critical component. This significant award underscores the escalating demand for advanced UT solutions within the maritime sector and highlights the impact of large-scale contracts in validating and driving market growth.
- October 2023: Olympus Corporation announced the launch of its next-generation portable ultrasonic flaw detector, featuring enhanced battery life, intuitive user interface, and advanced data logging capabilities, catering to the evolving needs of field technicians.
- March 2024: MISTRAS Group unveiled its new AI-powered analytics platform for UT data, promising faster and more accurate defect identification, marking a significant step towards intelligent NDT solutions.
Strategic Outlook for Portable Ultrasonic Testing Equipment Market
The future of the portable ultrasonic testing equipment market is bright, with continued growth fueled by technological advancements and increasing demand across various sectors. Strategic investments in R&D, coupled with strategic partnerships and geographical expansion, will be crucial for manufacturers to maintain a competitive edge and capitalize on emerging opportunities. The focus on user-friendly interfaces, enhanced data analysis, and integration with other technologies will further drive market growth.
Portable Ultrasonic Testing Equipment Industry Segmentation
-
1. Product Type
- 1.1. Manual Ultrasonic Testing Equipment
- 1.2. Automated Ultrasonic Testing Equipment
- 1.3. Handheld Ultrasonic Testing Equipment
-
2. Application
- 2.1. Aerospace
- 2.2. Manufacturing
- 2.3. Automotive
- 2.4. Energy
- 2.5. Construction
Portable Ultrasonic Testing Equipment Industry Segmentation By Geography
-
1. North America
- 1.1. United States
- 1.2. Canada
-
2. Europe
- 2.1. Germany
- 2.2. United Kingdom
- 2.3. France
- 2.4. Spain
- 2.5. Rest of Europe
-
3. Asia Pacific
- 3.1. China
- 3.2. Japan
- 3.3. India
- 3.4. South Korea
- 3.5. Rest of Asia Pacific
-
4. Latin America
- 4.1. Brazil
- 4.2. Argentina
- 4.3. Rest of Latin America
-
5. Middle East and Africa
- 5.1. United Arab Emirates
- 5.2. Saudi Arabia
- 5.3. Rest of Middle East and Africa
Portable Ultrasonic Testing Equipment Industry Regional Market Share
Geographic Coverage of Portable Ultrasonic Testing Equipment Industry
Portable Ultrasonic Testing Equipment Industry REPORT HIGHLIGHTS
| Aspects | Details |
|---|---|
| Study Period | 2020-2034 |
| Base Year | 2025 |
| Estimated Year | 2026 |
| Forecast Period | 2026-2034 |
| Historical Period | 2020-2025 |
| Growth Rate | CAGR of 8.79% from 2020-2034 |
| Segmentation |
|
Table of Contents
- 1. Introduction
- 1.1. Research Scope
- 1.2. Market Segmentation
- 1.3. Research Objective
- 1.4. Definitions and Assumptions
- 2. Executive Summary
- 2.1. Market Snapshot
- 3. Market Dynamics
- 3.1. Market Drivers
- 3.2. Market Restrains
- 3.3. Market Trends
- 3.4. Market Opportunities
- 4. Market Factor Analysis
- 4.1. Porters Five Forces
- 4.1.1. Bargaining Power of Suppliers
- 4.1.2. Bargaining Power of Buyers
- 4.1.3. Threat of New Entrants
- 4.1.4. Threat of Substitutes
- 4.1.5. Competitive Rivalry
- 4.2. PESTEL analysis
- 4.3. BCG Analysis
- 4.3.1. Stars (High Growth, High Market Share)
- 4.3.2. Cash Cows (Low Growth, High Market Share)
- 4.3.3. Question Mark (High Growth, Low Market Share)
- 4.3.4. Dogs (Low Growth, Low Market Share)
- 4.4. Ansoff Matrix Analysis
- 4.5. Supply Chain Analysis
- 4.6. Regulatory Landscape
- 4.7. Current Market Potential and Opportunity Assessment (TAM–SAM–SOM Framework)
- 4.8. MSR Analyst Note
- 4.1. Porters Five Forces
- 5. Market Analysis, Insights and Forecast 2021-2033
- 5.1. Market Analysis, Insights and Forecast - by Product Type
- 5.1.1. Manual Ultrasonic Testing Equipment
- 5.1.2. Automated Ultrasonic Testing Equipment
- 5.1.3. Handheld Ultrasonic Testing Equipment
- 5.2. Market Analysis, Insights and Forecast - by Application
- 5.2.1. Aerospace
- 5.2.2. Manufacturing
- 5.2.3. Automotive
- 5.2.4. Energy
- 5.2.5. Construction
- 5.3. Market Analysis, Insights and Forecast - by Region
- 5.3.1. North America
- 5.3.2. Europe
- 5.3.3. Asia Pacific
- 5.3.4. Latin America
- 5.3.5. Middle East and Africa
- 5.1. Market Analysis, Insights and Forecast - by Product Type
- 6. Global Portable Ultrasonic Testing Equipment Industry Analysis, Insights and Forecast, 2021-2033
- 6.1. Market Analysis, Insights and Forecast - by Product Type
- 6.1.1. Manual Ultrasonic Testing Equipment
- 6.1.2. Automated Ultrasonic Testing Equipment
- 6.1.3. Handheld Ultrasonic Testing Equipment
- 6.2. Market Analysis, Insights and Forecast - by Application
- 6.2.1. Aerospace
- 6.2.2. Manufacturing
- 6.2.3. Automotive
- 6.2.4. Energy
- 6.2.5. Construction
- 6.1. Market Analysis, Insights and Forecast - by Product Type
- 7. North America Portable Ultrasonic Testing Equipment Industry Analysis, Insights and Forecast, 2020-2032
- 7.1. Market Analysis, Insights and Forecast - by Product Type
- 7.1.1. Manual Ultrasonic Testing Equipment
- 7.1.2. Automated Ultrasonic Testing Equipment
- 7.1.3. Handheld Ultrasonic Testing Equipment
- 7.2. Market Analysis, Insights and Forecast - by Application
- 7.2.1. Aerospace
- 7.2.2. Manufacturing
- 7.2.3. Automotive
- 7.2.4. Energy
- 7.2.5. Construction
- 7.1. Market Analysis, Insights and Forecast - by Product Type
- 8. Europe Portable Ultrasonic Testing Equipment Industry Analysis, Insights and Forecast, 2020-2032
- 8.1. Market Analysis, Insights and Forecast - by Product Type
- 8.1.1. Manual Ultrasonic Testing Equipment
- 8.1.2. Automated Ultrasonic Testing Equipment
- 8.1.3. Handheld Ultrasonic Testing Equipment
- 8.2. Market Analysis, Insights and Forecast - by Application
- 8.2.1. Aerospace
- 8.2.2. Manufacturing
- 8.2.3. Automotive
- 8.2.4. Energy
- 8.2.5. Construction
- 8.1. Market Analysis, Insights and Forecast - by Product Type
- 9. Asia Pacific Portable Ultrasonic Testing Equipment Industry Analysis, Insights and Forecast, 2020-2032
- 9.1. Market Analysis, Insights and Forecast - by Product Type
- 9.1.1. Manual Ultrasonic Testing Equipment
- 9.1.2. Automated Ultrasonic Testing Equipment
- 9.1.3. Handheld Ultrasonic Testing Equipment
- 9.2. Market Analysis, Insights and Forecast - by Application
- 9.2.1. Aerospace
- 9.2.2. Manufacturing
- 9.2.3. Automotive
- 9.2.4. Energy
- 9.2.5. Construction
- 9.1. Market Analysis, Insights and Forecast - by Product Type
- 10. Latin America Portable Ultrasonic Testing Equipment Industry Analysis, Insights and Forecast, 2020-2032
- 10.1. Market Analysis, Insights and Forecast - by Product Type
- 10.1.1. Manual Ultrasonic Testing Equipment
- 10.1.2. Automated Ultrasonic Testing Equipment
- 10.1.3. Handheld Ultrasonic Testing Equipment
- 10.2. Market Analysis, Insights and Forecast - by Application
- 10.2.1. Aerospace
- 10.2.2. Manufacturing
- 10.2.3. Automotive
- 10.2.4. Energy
- 10.2.5. Construction
- 10.1. Market Analysis, Insights and Forecast - by Product Type
- 11. Middle East and Africa Portable Ultrasonic Testing Equipment Industry Analysis, Insights and Forecast, 2020-2032
- 11.1. Market Analysis, Insights and Forecast - by Product Type
- 11.1.1. Manual Ultrasonic Testing Equipment
- 11.1.2. Automated Ultrasonic Testing Equipment
- 11.1.3. Handheld Ultrasonic Testing Equipment
- 11.2. Market Analysis, Insights and Forecast - by Application
- 11.2.1. Aerospace
- 11.2.2. Manufacturing
- 11.2.3. Automotive
- 11.2.4. Energy
- 11.2.5. Construction
- 11.1. Market Analysis, Insights and Forecast - by Product Type
- 12. Competitive Analysis
- 12.1. Company Profiles
- 12.1.1 Intertek Group PKC
- 12.1.1.1. Company Overview
- 12.1.1.2. Products
- 12.1.1.3. Company Financials
- 12.1.1.4. SWOT Analysis
- 12.1.2 Advanced NDT Ltd
- 12.1.2.1. Company Overview
- 12.1.2.2. Products
- 12.1.2.3. Company Financials
- 12.1.2.4. SWOT Analysis
- 12.1.3 Applus Services S
- 12.1.3.1. Company Overview
- 12.1.3.2. Products
- 12.1.3.3. Company Financials
- 12.1.3.4. SWOT Analysis
- 12.1.4 MISTRAS Group
- 12.1.4.1. Company Overview
- 12.1.4.2. Products
- 12.1.4.3. Company Financials
- 12.1.4.4. SWOT Analysis
- 12.1.5 Baker Hughes
- 12.1.5.1. Company Overview
- 12.1.5.2. Products
- 12.1.5.3. Company Financials
- 12.1.5.4. SWOT Analysis
- 12.1.6 Russell Fraser Sales Pty Ltd
- 12.1.6.1. Company Overview
- 12.1.6.2. Products
- 12.1.6.3. Company Financials
- 12.1.6.4. SWOT Analysis
- 12.1.7 OkoNDT group
- 12.1.7.1. Company Overview
- 12.1.7.2. Products
- 12.1.7.3. Company Financials
- 12.1.7.4. SWOT Analysis
- 12.1.8 ROSEN Group
- 12.1.8.1. Company Overview
- 12.1.8.2. Products
- 12.1.8.3. Company Financials
- 12.1.8.4. SWOT Analysis
- 12.1.9 Bureau Veritas SA
- 12.1.9.1. Company Overview
- 12.1.9.2. Products
- 12.1.9.3. Company Financials
- 12.1.9.4. SWOT Analysis
- 12.1.10 Johnson and Allen Ltd
- 12.1.10.1. Company Overview
- 12.1.10.2. Products
- 12.1.10.3. Company Financials
- 12.1.10.4. SWOT Analysis
- 12.1.11 Olympus Corporation
- 12.1.11.1. Company Overview
- 12.1.11.2. Products
- 12.1.11.3. Company Financials
- 12.1.11.4. SWOT Analysis
- 12.1.1 Intertek Group PKC
- 12.2. Market Entropy
- 12.2.1 Company's Key Areas Served
- 12.2.2 Recent Developments
- 12.3. Company Market Share Analysis 2025
- 12.3.1 Top 5 Companies Market Share Analysis
- 12.3.2 Top 3 Companies Market Share Analysis
- 12.4. List of Potential Customers
- 13. Research Methodology
List of Figures
- Figure 1: Global Portable Ultrasonic Testing Equipment Industry Revenue Breakdown (Million, %) by Region 2025 & 2033
- Figure 2: Global Portable Ultrasonic Testing Equipment Industry Volume Breakdown (K Unit, %) by Region 2025 & 2033
- Figure 3: North America Portable Ultrasonic Testing Equipment Industry Revenue (Million), by Product Type 2025 & 2033
- Figure 4: North America Portable Ultrasonic Testing Equipment Industry Volume (K Unit), by Product Type 2025 & 2033
- Figure 5: North America Portable Ultrasonic Testing Equipment Industry Revenue Share (%), by Product Type 2025 & 2033
- Figure 6: North America Portable Ultrasonic Testing Equipment Industry Volume Share (%), by Product Type 2025 & 2033
- Figure 7: North America Portable Ultrasonic Testing Equipment Industry Revenue (Million), by Application 2025 & 2033
- Figure 8: North America Portable Ultrasonic Testing Equipment Industry Volume (K Unit), by Application 2025 & 2033
- Figure 9: North America Portable Ultrasonic Testing Equipment Industry Revenue Share (%), by Application 2025 & 2033
- Figure 10: North America Portable Ultrasonic Testing Equipment Industry Volume Share (%), by Application 2025 & 2033
- Figure 11: North America Portable Ultrasonic Testing Equipment Industry Revenue (Million), by Country 2025 & 2033
- Figure 12: North America Portable Ultrasonic Testing Equipment Industry Volume (K Unit), by Country 2025 & 2033
- Figure 13: North America Portable Ultrasonic Testing Equipment Industry Revenue Share (%), by Country 2025 & 2033
- Figure 14: North America Portable Ultrasonic Testing Equipment Industry Volume Share (%), by Country 2025 & 2033
- Figure 15: Europe Portable Ultrasonic Testing Equipment Industry Revenue (Million), by Product Type 2025 & 2033
- Figure 16: Europe Portable Ultrasonic Testing Equipment Industry Volume (K Unit), by Product Type 2025 & 2033
- Figure 17: Europe Portable Ultrasonic Testing Equipment Industry Revenue Share (%), by Product Type 2025 & 2033
- Figure 18: Europe Portable Ultrasonic Testing Equipment Industry Volume Share (%), by Product Type 2025 & 2033
- Figure 19: Europe Portable Ultrasonic Testing Equipment Industry Revenue (Million), by Application 2025 & 2033
- Figure 20: Europe Portable Ultrasonic Testing Equipment Industry Volume (K Unit), by Application 2025 & 2033
- Figure 21: Europe Portable Ultrasonic Testing Equipment Industry Revenue Share (%), by Application 2025 & 2033
- Figure 22: Europe Portable Ultrasonic Testing Equipment Industry Volume Share (%), by Application 2025 & 2033
- Figure 23: Europe Portable Ultrasonic Testing Equipment Industry Revenue (Million), by Country 2025 & 2033
- Figure 24: Europe Portable Ultrasonic Testing Equipment Industry Volume (K Unit), by Country 2025 & 2033
- Figure 25: Europe Portable Ultrasonic Testing Equipment Industry Revenue Share (%), by Country 2025 & 2033
- Figure 26: Europe Portable Ultrasonic Testing Equipment Industry Volume Share (%), by Country 2025 & 2033
- Figure 27: Asia Pacific Portable Ultrasonic Testing Equipment Industry Revenue (Million), by Product Type 2025 & 2033
- Figure 28: Asia Pacific Portable Ultrasonic Testing Equipment Industry Volume (K Unit), by Product Type 2025 & 2033
- Figure 29: Asia Pacific Portable Ultrasonic Testing Equipment Industry Revenue Share (%), by Product Type 2025 & 2033
- Figure 30: Asia Pacific Portable Ultrasonic Testing Equipment Industry Volume Share (%), by Product Type 2025 & 2033
- Figure 31: Asia Pacific Portable Ultrasonic Testing Equipment Industry Revenue (Million), by Application 2025 & 2033
- Figure 32: Asia Pacific Portable Ultrasonic Testing Equipment Industry Volume (K Unit), by Application 2025 & 2033
- Figure 33: Asia Pacific Portable Ultrasonic Testing Equipment Industry Revenue Share (%), by Application 2025 & 2033
- Figure 34: Asia Pacific Portable Ultrasonic Testing Equipment Industry Volume Share (%), by Application 2025 & 2033
- Figure 35: Asia Pacific Portable Ultrasonic Testing Equipment Industry Revenue (Million), by Country 2025 & 2033
- Figure 36: Asia Pacific Portable Ultrasonic Testing Equipment Industry Volume (K Unit), by Country 2025 & 2033
- Figure 37: Asia Pacific Portable Ultrasonic Testing Equipment Industry Revenue Share (%), by Country 2025 & 2033
- Figure 38: Asia Pacific Portable Ultrasonic Testing Equipment Industry Volume Share (%), by Country 2025 & 2033
- Figure 39: Latin America Portable Ultrasonic Testing Equipment Industry Revenue (Million), by Product Type 2025 & 2033
- Figure 40: Latin America Portable Ultrasonic Testing Equipment Industry Volume (K Unit), by Product Type 2025 & 2033
- Figure 41: Latin America Portable Ultrasonic Testing Equipment Industry Revenue Share (%), by Product Type 2025 & 2033
- Figure 42: Latin America Portable Ultrasonic Testing Equipment Industry Volume Share (%), by Product Type 2025 & 2033
- Figure 43: Latin America Portable Ultrasonic Testing Equipment Industry Revenue (Million), by Application 2025 & 2033
- Figure 44: Latin America Portable Ultrasonic Testing Equipment Industry Volume (K Unit), by Application 2025 & 2033
- Figure 45: Latin America Portable Ultrasonic Testing Equipment Industry Revenue Share (%), by Application 2025 & 2033
- Figure 46: Latin America Portable Ultrasonic Testing Equipment Industry Volume Share (%), by Application 2025 & 2033
- Figure 47: Latin America Portable Ultrasonic Testing Equipment Industry Revenue (Million), by Country 2025 & 2033
- Figure 48: Latin America Portable Ultrasonic Testing Equipment Industry Volume (K Unit), by Country 2025 & 2033
- Figure 49: Latin America Portable Ultrasonic Testing Equipment Industry Revenue Share (%), by Country 2025 & 2033
- Figure 50: Latin America Portable Ultrasonic Testing Equipment Industry Volume Share (%), by Country 2025 & 2033
- Figure 51: Middle East and Africa Portable Ultrasonic Testing Equipment Industry Revenue (Million), by Product Type 2025 & 2033
- Figure 52: Middle East and Africa Portable Ultrasonic Testing Equipment Industry Volume (K Unit), by Product Type 2025 & 2033
- Figure 53: Middle East and Africa Portable Ultrasonic Testing Equipment Industry Revenue Share (%), by Product Type 2025 & 2033
- Figure 54: Middle East and Africa Portable Ultrasonic Testing Equipment Industry Volume Share (%), by Product Type 2025 & 2033
- Figure 55: Middle East and Africa Portable Ultrasonic Testing Equipment Industry Revenue (Million), by Application 2025 & 2033
- Figure 56: Middle East and Africa Portable Ultrasonic Testing Equipment Industry Volume (K Unit), by Application 2025 & 2033
- Figure 57: Middle East and Africa Portable Ultrasonic Testing Equipment Industry Revenue Share (%), by Application 2025 & 2033
- Figure 58: Middle East and Africa Portable Ultrasonic Testing Equipment Industry Volume Share (%), by Application 2025 & 2033
- Figure 59: Middle East and Africa Portable Ultrasonic Testing Equipment Industry Revenue (Million), by Country 2025 & 2033
- Figure 60: Middle East and Africa Portable Ultrasonic Testing Equipment Industry Volume (K Unit), by Country 2025 & 2033
- Figure 61: Middle East and Africa Portable Ultrasonic Testing Equipment Industry Revenue Share (%), by Country 2025 & 2033
- Figure 62: Middle East and Africa Portable Ultrasonic Testing Equipment Industry Volume Share (%), by Country 2025 & 2033
List of Tables
- Table 1: Global Portable Ultrasonic Testing Equipment Industry Revenue Million Forecast, by Product Type 2020 & 2033
- Table 2: Global Portable Ultrasonic Testing Equipment Industry Volume K Unit Forecast, by Product Type 2020 & 2033
- Table 3: Global Portable Ultrasonic Testing Equipment Industry Revenue Million Forecast, by Application 2020 & 2033
- Table 4: Global Portable Ultrasonic Testing Equipment Industry Volume K Unit Forecast, by Application 2020 & 2033
- Table 5: Global Portable Ultrasonic Testing Equipment Industry Revenue Million Forecast, by Region 2020 & 2033
- Table 6: Global Portable Ultrasonic Testing Equipment Industry Volume K Unit Forecast, by Region 2020 & 2033
- Table 7: Global Portable Ultrasonic Testing Equipment Industry Revenue Million Forecast, by Product Type 2020 & 2033
- Table 8: Global Portable Ultrasonic Testing Equipment Industry Volume K Unit Forecast, by Product Type 2020 & 2033
- Table 9: Global Portable Ultrasonic Testing Equipment Industry Revenue Million Forecast, by Application 2020 & 2033
- Table 10: Global Portable Ultrasonic Testing Equipment Industry Volume K Unit Forecast, by Application 2020 & 2033
- Table 11: Global Portable Ultrasonic Testing Equipment Industry Revenue Million Forecast, by Country 2020 & 2033
- Table 12: Global Portable Ultrasonic Testing Equipment Industry Volume K Unit Forecast, by Country 2020 & 2033
- Table 13: United States Portable Ultrasonic Testing Equipment Industry Revenue (Million) Forecast, by Application 2020 & 2033
- Table 14: United States Portable Ultrasonic Testing Equipment Industry Volume (K Unit) Forecast, by Application 2020 & 2033
- Table 15: Canada Portable Ultrasonic Testing Equipment Industry Revenue (Million) Forecast, by Application 2020 & 2033
- Table 16: Canada Portable Ultrasonic Testing Equipment Industry Volume (K Unit) Forecast, by Application 2020 & 2033
- Table 17: Global Portable Ultrasonic Testing Equipment Industry Revenue Million Forecast, by Product Type 2020 & 2033
- Table 18: Global Portable Ultrasonic Testing Equipment Industry Volume K Unit Forecast, by Product Type 2020 & 2033
- Table 19: Global Portable Ultrasonic Testing Equipment Industry Revenue Million Forecast, by Application 2020 & 2033
- Table 20: Global Portable Ultrasonic Testing Equipment Industry Volume K Unit Forecast, by Application 2020 & 2033
- Table 21: Global Portable Ultrasonic Testing Equipment Industry Revenue Million Forecast, by Country 2020 & 2033
- Table 22: Global Portable Ultrasonic Testing Equipment Industry Volume K Unit Forecast, by Country 2020 & 2033
- Table 23: Germany Portable Ultrasonic Testing Equipment Industry Revenue (Million) Forecast, by Application 2020 & 2033
- Table 24: Germany Portable Ultrasonic Testing Equipment Industry Volume (K Unit) Forecast, by Application 2020 & 2033
- Table 25: United Kingdom Portable Ultrasonic Testing Equipment Industry Revenue (Million) Forecast, by Application 2020 & 2033
- Table 26: United Kingdom Portable Ultrasonic Testing Equipment Industry Volume (K Unit) Forecast, by Application 2020 & 2033
- Table 27: France Portable Ultrasonic Testing Equipment Industry Revenue (Million) Forecast, by Application 2020 & 2033
- Table 28: France Portable Ultrasonic Testing Equipment Industry Volume (K Unit) Forecast, by Application 2020 & 2033
- Table 29: Spain Portable Ultrasonic Testing Equipment Industry Revenue (Million) Forecast, by Application 2020 & 2033
- Table 30: Spain Portable Ultrasonic Testing Equipment Industry Volume (K Unit) Forecast, by Application 2020 & 2033
- Table 31: Rest of Europe Portable Ultrasonic Testing Equipment Industry Revenue (Million) Forecast, by Application 2020 & 2033
- Table 32: Rest of Europe Portable Ultrasonic Testing Equipment Industry Volume (K Unit) Forecast, by Application 2020 & 2033
- Table 33: Global Portable Ultrasonic Testing Equipment Industry Revenue Million Forecast, by Product Type 2020 & 2033
- Table 34: Global Portable Ultrasonic Testing Equipment Industry Volume K Unit Forecast, by Product Type 2020 & 2033
- Table 35: Global Portable Ultrasonic Testing Equipment Industry Revenue Million Forecast, by Application 2020 & 2033
- Table 36: Global Portable Ultrasonic Testing Equipment Industry Volume K Unit Forecast, by Application 2020 & 2033
- Table 37: Global Portable Ultrasonic Testing Equipment Industry Revenue Million Forecast, by Country 2020 & 2033
- Table 38: Global Portable Ultrasonic Testing Equipment Industry Volume K Unit Forecast, by Country 2020 & 2033
- Table 39: China Portable Ultrasonic Testing Equipment Industry Revenue (Million) Forecast, by Application 2020 & 2033
- Table 40: China Portable Ultrasonic Testing Equipment Industry Volume (K Unit) Forecast, by Application 2020 & 2033
- Table 41: Japan Portable Ultrasonic Testing Equipment Industry Revenue (Million) Forecast, by Application 2020 & 2033
- Table 42: Japan Portable Ultrasonic Testing Equipment Industry Volume (K Unit) Forecast, by Application 2020 & 2033
- Table 43: India Portable Ultrasonic Testing Equipment Industry Revenue (Million) Forecast, by Application 2020 & 2033
- Table 44: India Portable Ultrasonic Testing Equipment Industry Volume (K Unit) Forecast, by Application 2020 & 2033
- Table 45: South Korea Portable Ultrasonic Testing Equipment Industry Revenue (Million) Forecast, by Application 2020 & 2033
- Table 46: South Korea Portable Ultrasonic Testing Equipment Industry Volume (K Unit) Forecast, by Application 2020 & 2033
- Table 47: Rest of Asia Pacific Portable Ultrasonic Testing Equipment Industry Revenue (Million) Forecast, by Application 2020 & 2033
- Table 48: Rest of Asia Pacific Portable Ultrasonic Testing Equipment Industry Volume (K Unit) Forecast, by Application 2020 & 2033
- Table 49: Global Portable Ultrasonic Testing Equipment Industry Revenue Million Forecast, by Product Type 2020 & 2033
- Table 50: Global Portable Ultrasonic Testing Equipment Industry Volume K Unit Forecast, by Product Type 2020 & 2033
- Table 51: Global Portable Ultrasonic Testing Equipment Industry Revenue Million Forecast, by Application 2020 & 2033
- Table 52: Global Portable Ultrasonic Testing Equipment Industry Volume K Unit Forecast, by Application 2020 & 2033
- Table 53: Global Portable Ultrasonic Testing Equipment Industry Revenue Million Forecast, by Country 2020 & 2033
- Table 54: Global Portable Ultrasonic Testing Equipment Industry Volume K Unit Forecast, by Country 2020 & 2033
- Table 55: Brazil Portable Ultrasonic Testing Equipment Industry Revenue (Million) Forecast, by Application 2020 & 2033
- Table 56: Brazil Portable Ultrasonic Testing Equipment Industry Volume (K Unit) Forecast, by Application 2020 & 2033
- Table 57: Argentina Portable Ultrasonic Testing Equipment Industry Revenue (Million) Forecast, by Application 2020 & 2033
- Table 58: Argentina Portable Ultrasonic Testing Equipment Industry Volume (K Unit) Forecast, by Application 2020 & 2033
- Table 59: Rest of Latin America Portable Ultrasonic Testing Equipment Industry Revenue (Million) Forecast, by Application 2020 & 2033
- Table 60: Rest of Latin America Portable Ultrasonic Testing Equipment Industry Volume (K Unit) Forecast, by Application 2020 & 2033
- Table 61: Global Portable Ultrasonic Testing Equipment Industry Revenue Million Forecast, by Product Type 2020 & 2033
- Table 62: Global Portable Ultrasonic Testing Equipment Industry Volume K Unit Forecast, by Product Type 2020 & 2033
- Table 63: Global Portable Ultrasonic Testing Equipment Industry Revenue Million Forecast, by Application 2020 & 2033
- Table 64: Global Portable Ultrasonic Testing Equipment Industry Volume K Unit Forecast, by Application 2020 & 2033
- Table 65: Global Portable Ultrasonic Testing Equipment Industry Revenue Million Forecast, by Country 2020 & 2033
- Table 66: Global Portable Ultrasonic Testing Equipment Industry Volume K Unit Forecast, by Country 2020 & 2033
- Table 67: United Arab Emirates Portable Ultrasonic Testing Equipment Industry Revenue (Million) Forecast, by Application 2020 & 2033
- Table 68: United Arab Emirates Portable Ultrasonic Testing Equipment Industry Volume (K Unit) Forecast, by Application 2020 & 2033
- Table 69: Saudi Arabia Portable Ultrasonic Testing Equipment Industry Revenue (Million) Forecast, by Application 2020 & 2033
- Table 70: Saudi Arabia Portable Ultrasonic Testing Equipment Industry Volume (K Unit) Forecast, by Application 2020 & 2033
- Table 71: Rest of Middle East and Africa Portable Ultrasonic Testing Equipment Industry Revenue (Million) Forecast, by Application 2020 & 2033
- Table 72: Rest of Middle East and Africa Portable Ultrasonic Testing Equipment Industry Volume (K Unit) Forecast, by Application 2020 & 2033
Frequently Asked Questions
1. What is the projected Compound Annual Growth Rate (CAGR) of the Portable Ultrasonic Testing Equipment Industry?
The projected CAGR is approximately 8.79%.
2. Which companies are prominent players in the Portable Ultrasonic Testing Equipment Industry?
Key companies in the market include Intertek Group PKC, Advanced NDT Ltd, Applus Services S, MISTRAS Group, Baker Hughes, Russell Fraser Sales Pty Ltd, OkoNDT group, ROSEN Group, Bureau Veritas SA, Johnson and Allen Ltd, Olympus Corporation.
3. What are the main segments of the Portable Ultrasonic Testing Equipment Industry?
The market segments include Product Type , Application .
4. Can you provide details about the market size?
The market size is estimated to be USD 0.87 Million as of 2022.
5. What are some drivers contributing to market growth?
Increased Safety Regulation; More Emphasis Toward Continuous Monitoring to Prevent Sudden Failure; Availability of Portable and Connected Devices for Real-time Data.
6. What are the notable trends driving market growth?
Availability of Portable and Connected Devices for Real-time Data is Expected to Drive the Market's Growth.
7. Are there any restraints impacting market growth?
Lack of Skilled Labor Required to Implement and Carry Out Inspection Service.
8. Can you provide examples of recent developments in the market?
July 2022 - Applus+ was awarded a major contract to execute non-destructive testing on critical maritime assets. Applus+ provides a significant range of marine Non-destructive testing services like materials, corrosion monitoring and testing, and electrical safety and functionality testing. The two-year project entails the execution of radiographic and ultrasonic testing on diverse maritime assets, including watercraft.
9. What pricing options are available for accessing the report?
Pricing options include single-user, multi-user, and enterprise licenses priced at USD 4750, USD 5250, and USD 8750 respectively.
10. Is the market size provided in terms of value or volume?
The market size is provided in terms of value, measured in Million and volume, measured in K Unit.
11. Are there any specific market keywords associated with the report?
Yes, the market keyword associated with the report is "Portable Ultrasonic Testing Equipment Industry," which aids in identifying and referencing the specific market segment covered.
12. How do I determine which pricing option suits my needs best?
The pricing options vary based on user requirements and access needs. Individual users may opt for single-user licenses, while businesses requiring broader access may choose multi-user or enterprise licenses for cost-effective access to the report.
13. Are there any additional resources or data provided in the Portable Ultrasonic Testing Equipment Industry report?
While the report offers comprehensive insights, it's advisable to review the specific contents or supplementary materials provided to ascertain if additional resources or data are available.
14. How can I stay updated on further developments or reports in the Portable Ultrasonic Testing Equipment Industry?
To stay informed about further developments, trends, and reports in the Portable Ultrasonic Testing Equipment Industry, consider subscribing to industry newsletters, following relevant companies and organizations, or regularly checking reputable industry news sources and publications.
Methodology
Step 1 - Identification of Relevant Samples Size from Population Database


Step 2 - Approaches for Defining Global Market Size (Value, Volume* & Price*)

Note*: In applicable scenarios
Step 3 - Data Sources
Primary Research
- Web Analytics
- Survey Reports
- Research Institute
- Latest Research Reports
- Opinion Leaders
Secondary Research
- Annual Reports
- White Paper
- Latest Press Release
- Industry Association
- Paid Database
- Investor Presentations

Step 4 - Data Triangulation
Involves using different sources of information in order to increase the validity of a study
These sources are likely to be stakeholders in a program - participants, other researchers, program staff, other community members, and so on.
Then we put all data in single framework & apply various statistical tools to find out the dynamic on the market.
During the analysis stage, feedback from the stakeholder groups would be compared to determine areas of agreement as well as areas of divergence