
Key Insights
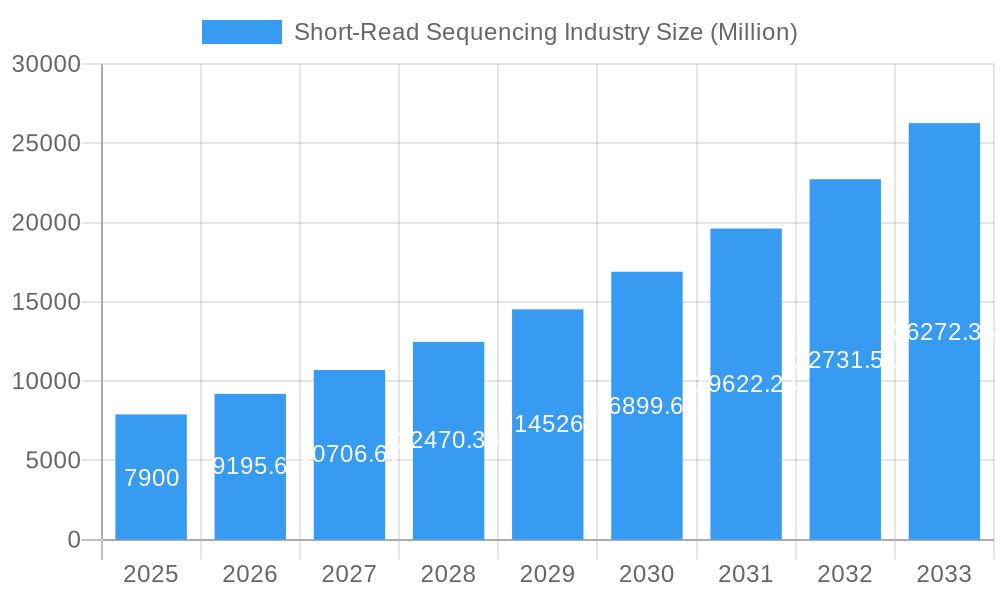
The short-read sequencing market, currently valued at $7.9 billion in 2025, is experiencing robust growth, projected to expand at a Compound Annual Growth Rate (CAGR) of 16.4% from 2025 to 2033. This significant expansion is driven by several key factors. The increasing affordability and accessibility of next-generation sequencing (NGS) technologies are making them more widely adopted across various applications, including genomics research, clinical diagnostics, and drug discovery. Furthermore, the growing prevalence of chronic diseases and the rising demand for personalized medicine are fueling the demand for accurate and efficient sequencing solutions. Advances in sequencing technologies, such as improved throughput, accuracy, and reduced sequencing time, are further contributing to market growth. The expanding applications of short-read sequencing in oncology, infectious disease diagnostics, and agricultural genomics are also driving the market's expansion.
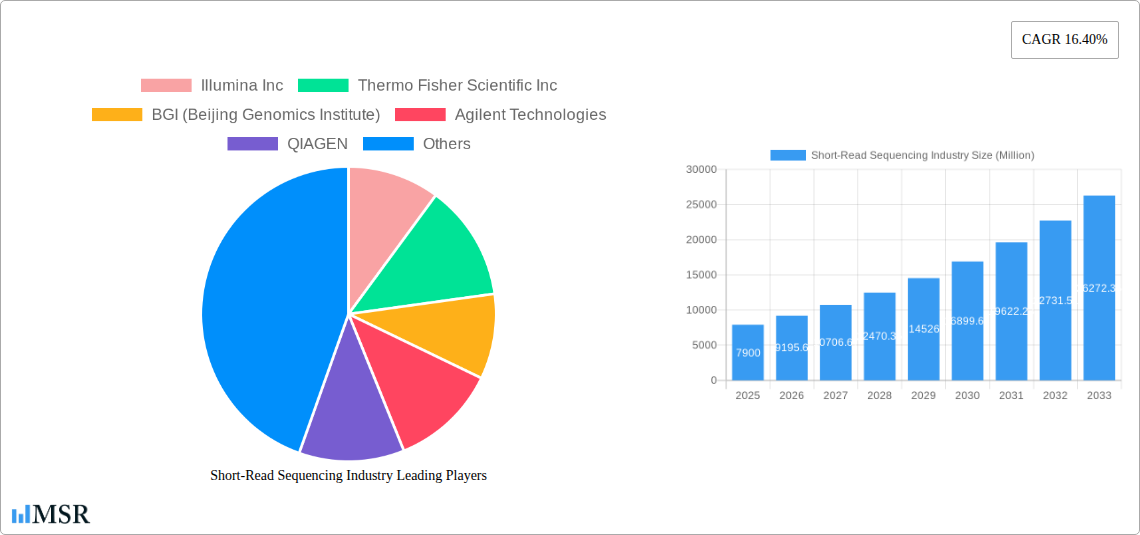
Short-Read Sequencing Industry Market Size (In Billion)
Competition in the short-read sequencing market is fierce, with major players like Illumina, Thermo Fisher Scientific, BGI, and QIAGEN constantly innovating and expanding their product portfolios. These companies are actively investing in research and development to improve sequencing technologies, develop new applications, and expand their global reach. While challenges such as the high cost of equipment and the need for specialized expertise exist, ongoing technological advancements and decreasing costs are mitigating these limitations. The market's future growth is anticipated to be further fueled by the increasing adoption of cloud-based data analysis platforms, which enhance data management and interpretation, and the continued development of innovative applications for short-read sequencing across diverse fields.
Short-Read Sequencing Industry Company Market Share
Short-Read Sequencing Industry: Market Report 2019-2033
This comprehensive report provides an in-depth analysis of the short-read sequencing industry, covering market dynamics, key players, technological advancements, and future growth prospects. The study period spans from 2019 to 2033, with 2025 serving as the base and estimated year. The report projects a robust market expansion during the forecast period (2025-2033), driven by significant technological breakthroughs and increasing demand across diverse applications. This detailed analysis is essential for industry stakeholders, investors, and researchers seeking a clear understanding of this rapidly evolving sector. The report includes forecasts for market size in Millions, market share analysis, and CAGR calculations.
Short-Read Sequencing Industry Market Concentration & Dynamics
The short-read sequencing market is characterized by a moderately concentrated landscape, dominated by major players like Illumina Inc, Thermo Fisher Scientific Inc, and BGI (Beijing Genomics Institute). These companies collectively hold a significant market share (estimated at xx%), owing to their strong technological capabilities, extensive distribution networks, and established brand reputation. However, the market also features several smaller players and emerging companies driving innovation.
- Market Share (Estimated 2025): Illumina Inc (xx%), Thermo Fisher Scientific Inc (xx%), BGI (xx%), Others (xx%).
- Mergers & Acquisitions (M&A) Activity (2019-2024): xx deals, reflecting industry consolidation and expansion efforts.
- Innovation Ecosystems: A robust ecosystem of research institutions, CROs (like Firalis Molecular Precision), and technology developers fosters continuous innovation in sequencing technologies and applications.
- Regulatory Frameworks: Stringent regulatory requirements governing medical diagnostics and genomic data privacy shape the market dynamics, influencing product development and market access.
- Substitute Products: While competing technologies exist (e.g., long-read sequencing), short-read sequencing maintains dominance due to its cost-effectiveness, speed, and established infrastructure.
- End-User Trends: Increasing demand from research institutions, pharmaceutical companies, and clinical diagnostic labs fuels market growth.
Short-Read Sequencing Industry Industry Insights & Trends
The short-read sequencing market exhibited robust growth during the historical period (2019-2024), reaching an estimated market size of $xx Million in 2025. This growth is projected to continue at a Compound Annual Growth Rate (CAGR) of xx% during the forecast period (2025-2033), reaching $xx Million by 2033. Several key factors contribute to this expansion. The decreasing cost of sequencing, coupled with advancements in technology (higher throughput, increased accuracy, and improved data analysis tools), makes short-read sequencing accessible to a broader range of users. Furthermore, the growing adoption of next-generation sequencing (NGS) in various applications, including genomics research, precision medicine, and infectious disease diagnostics, significantly boosts market demand. The increasing focus on personalized medicine and pharmacogenomics is another major growth driver. Finally, ongoing technological disruptions, such as the development of more efficient and user-friendly platforms (like PacBio's Onso system), are expanding market access and accelerating adoption. Consumer behavior is shifting towards greater acceptance and integration of genomic information in healthcare decision-making, further fueling market growth.
Key Markets & Segments Leading Short-Read Sequencing Industry
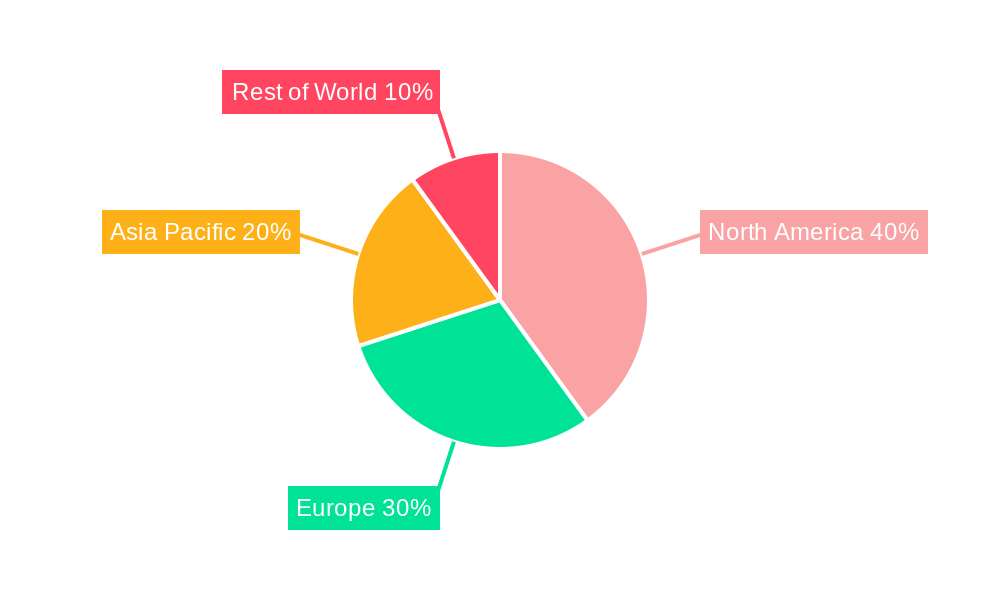
The North American market currently holds a leading position in the short-read sequencing industry, driven by substantial investments in research and development, the presence of major market players, and strong regulatory support. However, the Asia-Pacific region is expected to witness significant growth in the coming years, fueled by expanding healthcare infrastructure, increasing government initiatives to promote genomics research, and rising healthcare expenditure.
- North America:
- Strong presence of major players and research institutions.
- High adoption rates in research and clinical settings.
- Well-established regulatory framework.
- Asia-Pacific:
- Rapidly growing healthcare infrastructure and investments.
- Expanding genomics research initiatives.
- Increasing healthcare expenditure.
- Europe:
- Significant investments in genomics research and healthcare.
- Growing adoption in clinical diagnostics and personalized medicine.
- Stringent regulatory environment.
Short-Read Sequencing Industry Product Developments
Recent advancements in short-read sequencing technology have focused on improving throughput, accuracy, and cost-effectiveness. Key innovations include the introduction of highly integrated systems that streamline the sequencing workflow, the development of novel chemistries and reagents, and the creation of sophisticated bioinformatics tools for data analysis. These advancements are providing researchers and clinicians with greater access to high-quality genomic data at an affordable price, driving market growth. The competitive edge now lies in offering faster turnaround times, higher accuracy, and more user-friendly platforms.
Challenges in the Short-Read Sequencing Industry Market
The short-read sequencing industry faces challenges including stringent regulatory hurdles in certain regions, potentially impacting market entry and product approval timelines. Supply chain disruptions can affect the availability of key reagents and instruments, influencing production and delivery timelines. Furthermore, intense competition among established players and emerging companies exerts pressure on pricing and market share. These factors can collectively impact market growth.
Forces Driving Short-Read Sequencing Industry Growth
Several factors drive the growth of the short-read sequencing market. Technological advancements, such as higher throughput sequencing technologies and improved data analysis tools, are key. Decreasing sequencing costs have made this technology accessible to a broader range of users. Increasing funding for genomics research from both public and private sectors further fuels the demand. Finally, government initiatives promoting personalized medicine and pharmacogenomics contribute to the expansion of this sector.
Long-Term Growth Catalysts in the Short-Read Sequencing Industry
Long-term growth will be driven by continuous technological innovation, resulting in faster, more accurate, and more affordable sequencing solutions. Strategic partnerships between sequencing technology providers, research institutions, and pharmaceutical companies will play a crucial role in developing new applications and expanding market penetration. The expansion of short-read sequencing into emerging markets with growing healthcare needs will also contribute significantly to long-term growth.
Emerging Opportunities in Short-Read Sequencing Industry
Emerging opportunities include the expansion of applications into new areas, such as microbiology, environmental monitoring, and agricultural genomics. The development of novel sequencing platforms with enhanced capabilities and user-friendliness will create further market opportunities. Finally, increased adoption of cloud-based data analysis solutions and the integration of artificial intelligence (AI) in data interpretation will unlock new possibilities.
Leading Players in the Short-Read Sequencing Industry Sector
- Illumina Inc
- Thermo Fisher Scientific Inc
- BGI (Beijing Genomics Institute)
- Agilent Technologies
- QIAGEN
- F Hoffmann-La Roche Ltd
- Pacific Biosciences (PacBio)
- 10x Genomics
- Oxford Nanopore Technologies PLC
- Macrogen Inc
- PerkinElmer Inc
Key Milestones in Short-Read Sequencing Industry Industry
- December 2023: Firalis Molecular Precision acquired Illumina NovaSeq X Plus, enhancing its genomics capabilities and scaling short-read sequencing technology.
- August 2023: PacBio launched the Onso short-read sequencing system, introducing novel SBB chemistry for enhanced accuracy on a user-friendly platform.
Strategic Outlook for Short-Read Sequencing Industry Market
The future of the short-read sequencing market looks bright, with significant potential for growth driven by continued technological advancements, increasing applications in various sectors, and expanding global demand. Strategic partnerships, acquisitions, and investments in research and development will be key to capturing a larger market share and unlocking the full potential of this transformative technology. The focus on personalized medicine, coupled with the ongoing decline in sequencing costs, is poised to propel the market to new heights in the coming years.
Short-Read Sequencing Industry Segmentation
-
1. Product and Services
- 1.1. Instruments
- 1.2. Consumables
-
2. Platform
- 2.1. Sequencing by Synthesis (SBS)
- 2.2. Sequencing by Binding (SBB)
- 2.3. Sequencing by Ligation (SBL)
-
3. Application
- 3.1. Whole Genome Sequencing (WGS)
- 3.2. Whole Exome Sequencing (WES)
- 3.3. Other Applications
-
4. End User
- 4.1. Academic and Research Institutes
- 4.2. Pharmaceutical and Biotechnology Companies
- 4.3. Clinical Research Laboratories
- 4.4. Other End Users
Short-Read Sequencing Industry Segmentation By Geography
-
1. North America
- 1.1. United States
- 1.2. Canada
- 1.3. Mexico
-
2. Europe
- 2.1. Germany
- 2.2. United Kingdom
- 2.3. France
- 2.4. Italy
- 2.5. Spain
- 2.6. Rest of Europe
-
3. Asia Pacific
- 3.1. China
- 3.2. Japan
- 3.3. India
- 3.4. Australia
- 3.5. South Korea
- 3.6. Rest of Asia Pacific
-
4. Middle East and Africa
- 4.1. GCC
- 4.2. South Africa
- 4.3. Rest of Middle East and Africa
-
5. South America
- 5.1. Brazil
- 5.2. Argentina
- 5.3. Rest of South America
Short-Read Sequencing Industry Regional Market Share
Geographic Coverage of Short-Read Sequencing Industry
Short-Read Sequencing Industry REPORT HIGHLIGHTS
| Aspects | Details |
|---|---|
| Study Period | 2020-2034 |
| Base Year | 2025 |
| Estimated Year | 2026 |
| Forecast Period | 2026-2034 |
| Historical Period | 2020-2025 |
| Growth Rate | CAGR of 16.40% from 2020-2034 |
| Segmentation |
|
Table of Contents
- 1. Introduction
- 1.1. Research Scope
- 1.2. Market Segmentation
- 1.3. Research Methodology
- 1.4. Definitions and Assumptions
- 2. Executive Summary
- 2.1. Introduction
- 3. Market Dynamics
- 3.1. Introduction
- 3.2. Market Drivers
- 3.2.1. Rising Demand for Precision Medicine; Continuous Advancements in Genomics Research; Cost-Effectiveness and Efficiency of Short-read Sequencing Technologies
- 3.3. Market Restrains
- 3.3.1. Rising Demand for Precision Medicine; Continuous Advancements in Genomics Research; Cost-Effectiveness and Efficiency of Short-read Sequencing Technologies
- 3.4. Market Trends
- 3.4.1. The Whole Genome Sequencing (WGS) Application Segment is Expected to Have a Significant Share in the Market During the Forecast Period
- 4. Market Factor Analysis
- 4.1. Porters Five Forces
- 4.2. Supply/Value Chain
- 4.3. PESTEL analysis
- 4.4. Market Entropy
- 4.5. Patent/Trademark Analysis
- 5. Global Short-Read Sequencing Industry Analysis, Insights and Forecast, 2020-2032
- 5.1. Market Analysis, Insights and Forecast - by Product and Services
- 5.1.1. Instruments
- 5.1.2. Consumables
- 5.2. Market Analysis, Insights and Forecast - by Platform
- 5.2.1. Sequencing by Synthesis (SBS)
- 5.2.2. Sequencing by Binding (SBB)
- 5.2.3. Sequencing by Ligation (SBL)
- 5.3. Market Analysis, Insights and Forecast - by Application
- 5.3.1. Whole Genome Sequencing (WGS)
- 5.3.2. Whole Exome Sequencing (WES)
- 5.3.3. Other Applications
- 5.4. Market Analysis, Insights and Forecast - by End User
- 5.4.1. Academic and Research Institutes
- 5.4.2. Pharmaceutical and Biotechnology Companies
- 5.4.3. Clinical Research Laboratories
- 5.4.4. Other End Users
- 5.5. Market Analysis, Insights and Forecast - by Region
- 5.5.1. North America
- 5.5.2. Europe
- 5.5.3. Asia Pacific
- 5.5.4. Middle East and Africa
- 5.5.5. South America
- 5.1. Market Analysis, Insights and Forecast - by Product and Services
- 6. North America Short-Read Sequencing Industry Analysis, Insights and Forecast, 2020-2032
- 6.1. Market Analysis, Insights and Forecast - by Product and Services
- 6.1.1. Instruments
- 6.1.2. Consumables
- 6.2. Market Analysis, Insights and Forecast - by Platform
- 6.2.1. Sequencing by Synthesis (SBS)
- 6.2.2. Sequencing by Binding (SBB)
- 6.2.3. Sequencing by Ligation (SBL)
- 6.3. Market Analysis, Insights and Forecast - by Application
- 6.3.1. Whole Genome Sequencing (WGS)
- 6.3.2. Whole Exome Sequencing (WES)
- 6.3.3. Other Applications
- 6.4. Market Analysis, Insights and Forecast - by End User
- 6.4.1. Academic and Research Institutes
- 6.4.2. Pharmaceutical and Biotechnology Companies
- 6.4.3. Clinical Research Laboratories
- 6.4.4. Other End Users
- 6.1. Market Analysis, Insights and Forecast - by Product and Services
- 7. Europe Short-Read Sequencing Industry Analysis, Insights and Forecast, 2020-2032
- 7.1. Market Analysis, Insights and Forecast - by Product and Services
- 7.1.1. Instruments
- 7.1.2. Consumables
- 7.2. Market Analysis, Insights and Forecast - by Platform
- 7.2.1. Sequencing by Synthesis (SBS)
- 7.2.2. Sequencing by Binding (SBB)
- 7.2.3. Sequencing by Ligation (SBL)
- 7.3. Market Analysis, Insights and Forecast - by Application
- 7.3.1. Whole Genome Sequencing (WGS)
- 7.3.2. Whole Exome Sequencing (WES)
- 7.3.3. Other Applications
- 7.4. Market Analysis, Insights and Forecast - by End User
- 7.4.1. Academic and Research Institutes
- 7.4.2. Pharmaceutical and Biotechnology Companies
- 7.4.3. Clinical Research Laboratories
- 7.4.4. Other End Users
- 7.1. Market Analysis, Insights and Forecast - by Product and Services
- 8. Asia Pacific Short-Read Sequencing Industry Analysis, Insights and Forecast, 2020-2032
- 8.1. Market Analysis, Insights and Forecast - by Product and Services
- 8.1.1. Instruments
- 8.1.2. Consumables
- 8.2. Market Analysis, Insights and Forecast - by Platform
- 8.2.1. Sequencing by Synthesis (SBS)
- 8.2.2. Sequencing by Binding (SBB)
- 8.2.3. Sequencing by Ligation (SBL)
- 8.3. Market Analysis, Insights and Forecast - by Application
- 8.3.1. Whole Genome Sequencing (WGS)
- 8.3.2. Whole Exome Sequencing (WES)
- 8.3.3. Other Applications
- 8.4. Market Analysis, Insights and Forecast - by End User
- 8.4.1. Academic and Research Institutes
- 8.4.2. Pharmaceutical and Biotechnology Companies
- 8.4.3. Clinical Research Laboratories
- 8.4.4. Other End Users
- 8.1. Market Analysis, Insights and Forecast - by Product and Services
- 9. Middle East and Africa Short-Read Sequencing Industry Analysis, Insights and Forecast, 2020-2032
- 9.1. Market Analysis, Insights and Forecast - by Product and Services
- 9.1.1. Instruments
- 9.1.2. Consumables
- 9.2. Market Analysis, Insights and Forecast - by Platform
- 9.2.1. Sequencing by Synthesis (SBS)
- 9.2.2. Sequencing by Binding (SBB)
- 9.2.3. Sequencing by Ligation (SBL)
- 9.3. Market Analysis, Insights and Forecast - by Application
- 9.3.1. Whole Genome Sequencing (WGS)
- 9.3.2. Whole Exome Sequencing (WES)
- 9.3.3. Other Applications
- 9.4. Market Analysis, Insights and Forecast - by End User
- 9.4.1. Academic and Research Institutes
- 9.4.2. Pharmaceutical and Biotechnology Companies
- 9.4.3. Clinical Research Laboratories
- 9.4.4. Other End Users
- 9.1. Market Analysis, Insights and Forecast - by Product and Services
- 10. South America Short-Read Sequencing Industry Analysis, Insights and Forecast, 2020-2032
- 10.1. Market Analysis, Insights and Forecast - by Product and Services
- 10.1.1. Instruments
- 10.1.2. Consumables
- 10.2. Market Analysis, Insights and Forecast - by Platform
- 10.2.1. Sequencing by Synthesis (SBS)
- 10.2.2. Sequencing by Binding (SBB)
- 10.2.3. Sequencing by Ligation (SBL)
- 10.3. Market Analysis, Insights and Forecast - by Application
- 10.3.1. Whole Genome Sequencing (WGS)
- 10.3.2. Whole Exome Sequencing (WES)
- 10.3.3. Other Applications
- 10.4. Market Analysis, Insights and Forecast - by End User
- 10.4.1. Academic and Research Institutes
- 10.4.2. Pharmaceutical and Biotechnology Companies
- 10.4.3. Clinical Research Laboratories
- 10.4.4. Other End Users
- 10.1. Market Analysis, Insights and Forecast - by Product and Services
- 11. Competitive Analysis
- 11.1. Global Market Share Analysis 2025
- 11.2. Company Profiles
- 11.2.1 Illumina Inc
- 11.2.1.1. Overview
- 11.2.1.2. Products
- 11.2.1.3. SWOT Analysis
- 11.2.1.4. Recent Developments
- 11.2.1.5. Financials (Based on Availability)
- 11.2.2 Thermo Fisher Scientific Inc
- 11.2.2.1. Overview
- 11.2.2.2. Products
- 11.2.2.3. SWOT Analysis
- 11.2.2.4. Recent Developments
- 11.2.2.5. Financials (Based on Availability)
- 11.2.3 BGI (Beijing Genomics Institute)
- 11.2.3.1. Overview
- 11.2.3.2. Products
- 11.2.3.3. SWOT Analysis
- 11.2.3.4. Recent Developments
- 11.2.3.5. Financials (Based on Availability)
- 11.2.4 Agilent Technologies
- 11.2.4.1. Overview
- 11.2.4.2. Products
- 11.2.4.3. SWOT Analysis
- 11.2.4.4. Recent Developments
- 11.2.4.5. Financials (Based on Availability)
- 11.2.5 QIAGEN
- 11.2.5.1. Overview
- 11.2.5.2. Products
- 11.2.5.3. SWOT Analysis
- 11.2.5.4. Recent Developments
- 11.2.5.5. Financials (Based on Availability)
- 11.2.6 F Hoffmann-La Roche Ltd
- 11.2.6.1. Overview
- 11.2.6.2. Products
- 11.2.6.3. SWOT Analysis
- 11.2.6.4. Recent Developments
- 11.2.6.5. Financials (Based on Availability)
- 11.2.7 Pacific Biosciences (PacBio)
- 11.2.7.1. Overview
- 11.2.7.2. Products
- 11.2.7.3. SWOT Analysis
- 11.2.7.4. Recent Developments
- 11.2.7.5. Financials (Based on Availability)
- 11.2.8 10x Geonomics
- 11.2.8.1. Overview
- 11.2.8.2. Products
- 11.2.8.3. SWOT Analysis
- 11.2.8.4. Recent Developments
- 11.2.8.5. Financials (Based on Availability)
- 11.2.9 Oxford Nanopore Technologies PLC
- 11.2.9.1. Overview
- 11.2.9.2. Products
- 11.2.9.3. SWOT Analysis
- 11.2.9.4. Recent Developments
- 11.2.9.5. Financials (Based on Availability)
- 11.2.10 Macrogen Inc
- 11.2.10.1. Overview
- 11.2.10.2. Products
- 11.2.10.3. SWOT Analysis
- 11.2.10.4. Recent Developments
- 11.2.10.5. Financials (Based on Availability)
- 11.2.11 PerkinElmer Inc *List Not Exhaustive
- 11.2.11.1. Overview
- 11.2.11.2. Products
- 11.2.11.3. SWOT Analysis
- 11.2.11.4. Recent Developments
- 11.2.11.5. Financials (Based on Availability)
- 11.2.1 Illumina Inc
List of Figures
- Figure 1: Global Short-Read Sequencing Industry Revenue Breakdown (Million, %) by Region 2025 & 2033
- Figure 2: Global Short-Read Sequencing Industry Volume Breakdown (Billion, %) by Region 2025 & 2033
- Figure 3: North America Short-Read Sequencing Industry Revenue (Million), by Product and Services 2025 & 2033
- Figure 4: North America Short-Read Sequencing Industry Volume (Billion), by Product and Services 2025 & 2033
- Figure 5: North America Short-Read Sequencing Industry Revenue Share (%), by Product and Services 2025 & 2033
- Figure 6: North America Short-Read Sequencing Industry Volume Share (%), by Product and Services 2025 & 2033
- Figure 7: North America Short-Read Sequencing Industry Revenue (Million), by Platform 2025 & 2033
- Figure 8: North America Short-Read Sequencing Industry Volume (Billion), by Platform 2025 & 2033
- Figure 9: North America Short-Read Sequencing Industry Revenue Share (%), by Platform 2025 & 2033
- Figure 10: North America Short-Read Sequencing Industry Volume Share (%), by Platform 2025 & 2033
- Figure 11: North America Short-Read Sequencing Industry Revenue (Million), by Application 2025 & 2033
- Figure 12: North America Short-Read Sequencing Industry Volume (Billion), by Application 2025 & 2033
- Figure 13: North America Short-Read Sequencing Industry Revenue Share (%), by Application 2025 & 2033
- Figure 14: North America Short-Read Sequencing Industry Volume Share (%), by Application 2025 & 2033
- Figure 15: North America Short-Read Sequencing Industry Revenue (Million), by End User 2025 & 2033
- Figure 16: North America Short-Read Sequencing Industry Volume (Billion), by End User 2025 & 2033
- Figure 17: North America Short-Read Sequencing Industry Revenue Share (%), by End User 2025 & 2033
- Figure 18: North America Short-Read Sequencing Industry Volume Share (%), by End User 2025 & 2033
- Figure 19: North America Short-Read Sequencing Industry Revenue (Million), by Country 2025 & 2033
- Figure 20: North America Short-Read Sequencing Industry Volume (Billion), by Country 2025 & 2033
- Figure 21: North America Short-Read Sequencing Industry Revenue Share (%), by Country 2025 & 2033
- Figure 22: North America Short-Read Sequencing Industry Volume Share (%), by Country 2025 & 2033
- Figure 23: Europe Short-Read Sequencing Industry Revenue (Million), by Product and Services 2025 & 2033
- Figure 24: Europe Short-Read Sequencing Industry Volume (Billion), by Product and Services 2025 & 2033
- Figure 25: Europe Short-Read Sequencing Industry Revenue Share (%), by Product and Services 2025 & 2033
- Figure 26: Europe Short-Read Sequencing Industry Volume Share (%), by Product and Services 2025 & 2033
- Figure 27: Europe Short-Read Sequencing Industry Revenue (Million), by Platform 2025 & 2033
- Figure 28: Europe Short-Read Sequencing Industry Volume (Billion), by Platform 2025 & 2033
- Figure 29: Europe Short-Read Sequencing Industry Revenue Share (%), by Platform 2025 & 2033
- Figure 30: Europe Short-Read Sequencing Industry Volume Share (%), by Platform 2025 & 2033
- Figure 31: Europe Short-Read Sequencing Industry Revenue (Million), by Application 2025 & 2033
- Figure 32: Europe Short-Read Sequencing Industry Volume (Billion), by Application 2025 & 2033
- Figure 33: Europe Short-Read Sequencing Industry Revenue Share (%), by Application 2025 & 2033
- Figure 34: Europe Short-Read Sequencing Industry Volume Share (%), by Application 2025 & 2033
- Figure 35: Europe Short-Read Sequencing Industry Revenue (Million), by End User 2025 & 2033
- Figure 36: Europe Short-Read Sequencing Industry Volume (Billion), by End User 2025 & 2033
- Figure 37: Europe Short-Read Sequencing Industry Revenue Share (%), by End User 2025 & 2033
- Figure 38: Europe Short-Read Sequencing Industry Volume Share (%), by End User 2025 & 2033
- Figure 39: Europe Short-Read Sequencing Industry Revenue (Million), by Country 2025 & 2033
- Figure 40: Europe Short-Read Sequencing Industry Volume (Billion), by Country 2025 & 2033
- Figure 41: Europe Short-Read Sequencing Industry Revenue Share (%), by Country 2025 & 2033
- Figure 42: Europe Short-Read Sequencing Industry Volume Share (%), by Country 2025 & 2033
- Figure 43: Asia Pacific Short-Read Sequencing Industry Revenue (Million), by Product and Services 2025 & 2033
- Figure 44: Asia Pacific Short-Read Sequencing Industry Volume (Billion), by Product and Services 2025 & 2033
- Figure 45: Asia Pacific Short-Read Sequencing Industry Revenue Share (%), by Product and Services 2025 & 2033
- Figure 46: Asia Pacific Short-Read Sequencing Industry Volume Share (%), by Product and Services 2025 & 2033
- Figure 47: Asia Pacific Short-Read Sequencing Industry Revenue (Million), by Platform 2025 & 2033
- Figure 48: Asia Pacific Short-Read Sequencing Industry Volume (Billion), by Platform 2025 & 2033
- Figure 49: Asia Pacific Short-Read Sequencing Industry Revenue Share (%), by Platform 2025 & 2033
- Figure 50: Asia Pacific Short-Read Sequencing Industry Volume Share (%), by Platform 2025 & 2033
- Figure 51: Asia Pacific Short-Read Sequencing Industry Revenue (Million), by Application 2025 & 2033
- Figure 52: Asia Pacific Short-Read Sequencing Industry Volume (Billion), by Application 2025 & 2033
- Figure 53: Asia Pacific Short-Read Sequencing Industry Revenue Share (%), by Application 2025 & 2033
- Figure 54: Asia Pacific Short-Read Sequencing Industry Volume Share (%), by Application 2025 & 2033
- Figure 55: Asia Pacific Short-Read Sequencing Industry Revenue (Million), by End User 2025 & 2033
- Figure 56: Asia Pacific Short-Read Sequencing Industry Volume (Billion), by End User 2025 & 2033
- Figure 57: Asia Pacific Short-Read Sequencing Industry Revenue Share (%), by End User 2025 & 2033
- Figure 58: Asia Pacific Short-Read Sequencing Industry Volume Share (%), by End User 2025 & 2033
- Figure 59: Asia Pacific Short-Read Sequencing Industry Revenue (Million), by Country 2025 & 2033
- Figure 60: Asia Pacific Short-Read Sequencing Industry Volume (Billion), by Country 2025 & 2033
- Figure 61: Asia Pacific Short-Read Sequencing Industry Revenue Share (%), by Country 2025 & 2033
- Figure 62: Asia Pacific Short-Read Sequencing Industry Volume Share (%), by Country 2025 & 2033
- Figure 63: Middle East and Africa Short-Read Sequencing Industry Revenue (Million), by Product and Services 2025 & 2033
- Figure 64: Middle East and Africa Short-Read Sequencing Industry Volume (Billion), by Product and Services 2025 & 2033
- Figure 65: Middle East and Africa Short-Read Sequencing Industry Revenue Share (%), by Product and Services 2025 & 2033
- Figure 66: Middle East and Africa Short-Read Sequencing Industry Volume Share (%), by Product and Services 2025 & 2033
- Figure 67: Middle East and Africa Short-Read Sequencing Industry Revenue (Million), by Platform 2025 & 2033
- Figure 68: Middle East and Africa Short-Read Sequencing Industry Volume (Billion), by Platform 2025 & 2033
- Figure 69: Middle East and Africa Short-Read Sequencing Industry Revenue Share (%), by Platform 2025 & 2033
- Figure 70: Middle East and Africa Short-Read Sequencing Industry Volume Share (%), by Platform 2025 & 2033
- Figure 71: Middle East and Africa Short-Read Sequencing Industry Revenue (Million), by Application 2025 & 2033
- Figure 72: Middle East and Africa Short-Read Sequencing Industry Volume (Billion), by Application 2025 & 2033
- Figure 73: Middle East and Africa Short-Read Sequencing Industry Revenue Share (%), by Application 2025 & 2033
- Figure 74: Middle East and Africa Short-Read Sequencing Industry Volume Share (%), by Application 2025 & 2033
- Figure 75: Middle East and Africa Short-Read Sequencing Industry Revenue (Million), by End User 2025 & 2033
- Figure 76: Middle East and Africa Short-Read Sequencing Industry Volume (Billion), by End User 2025 & 2033
- Figure 77: Middle East and Africa Short-Read Sequencing Industry Revenue Share (%), by End User 2025 & 2033
- Figure 78: Middle East and Africa Short-Read Sequencing Industry Volume Share (%), by End User 2025 & 2033
- Figure 79: Middle East and Africa Short-Read Sequencing Industry Revenue (Million), by Country 2025 & 2033
- Figure 80: Middle East and Africa Short-Read Sequencing Industry Volume (Billion), by Country 2025 & 2033
- Figure 81: Middle East and Africa Short-Read Sequencing Industry Revenue Share (%), by Country 2025 & 2033
- Figure 82: Middle East and Africa Short-Read Sequencing Industry Volume Share (%), by Country 2025 & 2033
- Figure 83: South America Short-Read Sequencing Industry Revenue (Million), by Product and Services 2025 & 2033
- Figure 84: South America Short-Read Sequencing Industry Volume (Billion), by Product and Services 2025 & 2033
- Figure 85: South America Short-Read Sequencing Industry Revenue Share (%), by Product and Services 2025 & 2033
- Figure 86: South America Short-Read Sequencing Industry Volume Share (%), by Product and Services 2025 & 2033
- Figure 87: South America Short-Read Sequencing Industry Revenue (Million), by Platform 2025 & 2033
- Figure 88: South America Short-Read Sequencing Industry Volume (Billion), by Platform 2025 & 2033
- Figure 89: South America Short-Read Sequencing Industry Revenue Share (%), by Platform 2025 & 2033
- Figure 90: South America Short-Read Sequencing Industry Volume Share (%), by Platform 2025 & 2033
- Figure 91: South America Short-Read Sequencing Industry Revenue (Million), by Application 2025 & 2033
- Figure 92: South America Short-Read Sequencing Industry Volume (Billion), by Application 2025 & 2033
- Figure 93: South America Short-Read Sequencing Industry Revenue Share (%), by Application 2025 & 2033
- Figure 94: South America Short-Read Sequencing Industry Volume Share (%), by Application 2025 & 2033
- Figure 95: South America Short-Read Sequencing Industry Revenue (Million), by End User 2025 & 2033
- Figure 96: South America Short-Read Sequencing Industry Volume (Billion), by End User 2025 & 2033
- Figure 97: South America Short-Read Sequencing Industry Revenue Share (%), by End User 2025 & 2033
- Figure 98: South America Short-Read Sequencing Industry Volume Share (%), by End User 2025 & 2033
- Figure 99: South America Short-Read Sequencing Industry Revenue (Million), by Country 2025 & 2033
- Figure 100: South America Short-Read Sequencing Industry Volume (Billion), by Country 2025 & 2033
- Figure 101: South America Short-Read Sequencing Industry Revenue Share (%), by Country 2025 & 2033
- Figure 102: South America Short-Read Sequencing Industry Volume Share (%), by Country 2025 & 2033
List of Tables
- Table 1: Global Short-Read Sequencing Industry Revenue Million Forecast, by Region 2020 & 2033
- Table 2: Global Short-Read Sequencing Industry Volume Billion Forecast, by Region 2020 & 2033
- Table 3: Global Short-Read Sequencing Industry Revenue Million Forecast, by Product and Services 2020 & 2033
- Table 4: Global Short-Read Sequencing Industry Volume Billion Forecast, by Product and Services 2020 & 2033
- Table 5: Global Short-Read Sequencing Industry Revenue Million Forecast, by Platform 2020 & 2033
- Table 6: Global Short-Read Sequencing Industry Volume Billion Forecast, by Platform 2020 & 2033
- Table 7: Global Short-Read Sequencing Industry Revenue Million Forecast, by Application 2020 & 2033
- Table 8: Global Short-Read Sequencing Industry Volume Billion Forecast, by Application 2020 & 2033
- Table 9: Global Short-Read Sequencing Industry Revenue Million Forecast, by End User 2020 & 2033
- Table 10: Global Short-Read Sequencing Industry Volume Billion Forecast, by End User 2020 & 2033
- Table 11: Global Short-Read Sequencing Industry Revenue Million Forecast, by Region 2020 & 2033
- Table 12: Global Short-Read Sequencing Industry Volume Billion Forecast, by Region 2020 & 2033
- Table 13: Global Short-Read Sequencing Industry Revenue Million Forecast, by Product and Services 2020 & 2033
- Table 14: Global Short-Read Sequencing Industry Volume Billion Forecast, by Product and Services 2020 & 2033
- Table 15: Global Short-Read Sequencing Industry Revenue Million Forecast, by Platform 2020 & 2033
- Table 16: Global Short-Read Sequencing Industry Volume Billion Forecast, by Platform 2020 & 2033
- Table 17: Global Short-Read Sequencing Industry Revenue Million Forecast, by Application 2020 & 2033
- Table 18: Global Short-Read Sequencing Industry Volume Billion Forecast, by Application 2020 & 2033
- Table 19: Global Short-Read Sequencing Industry Revenue Million Forecast, by End User 2020 & 2033
- Table 20: Global Short-Read Sequencing Industry Volume Billion Forecast, by End User 2020 & 2033
- Table 21: Global Short-Read Sequencing Industry Revenue Million Forecast, by Country 2020 & 2033
- Table 22: Global Short-Read Sequencing Industry Volume Billion Forecast, by Country 2020 & 2033
- Table 23: United States Short-Read Sequencing Industry Revenue (Million) Forecast, by Application 2020 & 2033
- Table 24: United States Short-Read Sequencing Industry Volume (Billion) Forecast, by Application 2020 & 2033
- Table 25: Canada Short-Read Sequencing Industry Revenue (Million) Forecast, by Application 2020 & 2033
- Table 26: Canada Short-Read Sequencing Industry Volume (Billion) Forecast, by Application 2020 & 2033
- Table 27: Mexico Short-Read Sequencing Industry Revenue (Million) Forecast, by Application 2020 & 2033
- Table 28: Mexico Short-Read Sequencing Industry Volume (Billion) Forecast, by Application 2020 & 2033
- Table 29: Global Short-Read Sequencing Industry Revenue Million Forecast, by Product and Services 2020 & 2033
- Table 30: Global Short-Read Sequencing Industry Volume Billion Forecast, by Product and Services 2020 & 2033
- Table 31: Global Short-Read Sequencing Industry Revenue Million Forecast, by Platform 2020 & 2033
- Table 32: Global Short-Read Sequencing Industry Volume Billion Forecast, by Platform 2020 & 2033
- Table 33: Global Short-Read Sequencing Industry Revenue Million Forecast, by Application 2020 & 2033
- Table 34: Global Short-Read Sequencing Industry Volume Billion Forecast, by Application 2020 & 2033
- Table 35: Global Short-Read Sequencing Industry Revenue Million Forecast, by End User 2020 & 2033
- Table 36: Global Short-Read Sequencing Industry Volume Billion Forecast, by End User 2020 & 2033
- Table 37: Global Short-Read Sequencing Industry Revenue Million Forecast, by Country 2020 & 2033
- Table 38: Global Short-Read Sequencing Industry Volume Billion Forecast, by Country 2020 & 2033
- Table 39: Germany Short-Read Sequencing Industry Revenue (Million) Forecast, by Application 2020 & 2033
- Table 40: Germany Short-Read Sequencing Industry Volume (Billion) Forecast, by Application 2020 & 2033
- Table 41: United Kingdom Short-Read Sequencing Industry Revenue (Million) Forecast, by Application 2020 & 2033
- Table 42: United Kingdom Short-Read Sequencing Industry Volume (Billion) Forecast, by Application 2020 & 2033
- Table 43: France Short-Read Sequencing Industry Revenue (Million) Forecast, by Application 2020 & 2033
- Table 44: France Short-Read Sequencing Industry Volume (Billion) Forecast, by Application 2020 & 2033
- Table 45: Italy Short-Read Sequencing Industry Revenue (Million) Forecast, by Application 2020 & 2033
- Table 46: Italy Short-Read Sequencing Industry Volume (Billion) Forecast, by Application 2020 & 2033
- Table 47: Spain Short-Read Sequencing Industry Revenue (Million) Forecast, by Application 2020 & 2033
- Table 48: Spain Short-Read Sequencing Industry Volume (Billion) Forecast, by Application 2020 & 2033
- Table 49: Rest of Europe Short-Read Sequencing Industry Revenue (Million) Forecast, by Application 2020 & 2033
- Table 50: Rest of Europe Short-Read Sequencing Industry Volume (Billion) Forecast, by Application 2020 & 2033
- Table 51: Global Short-Read Sequencing Industry Revenue Million Forecast, by Product and Services 2020 & 2033
- Table 52: Global Short-Read Sequencing Industry Volume Billion Forecast, by Product and Services 2020 & 2033
- Table 53: Global Short-Read Sequencing Industry Revenue Million Forecast, by Platform 2020 & 2033
- Table 54: Global Short-Read Sequencing Industry Volume Billion Forecast, by Platform 2020 & 2033
- Table 55: Global Short-Read Sequencing Industry Revenue Million Forecast, by Application 2020 & 2033
- Table 56: Global Short-Read Sequencing Industry Volume Billion Forecast, by Application 2020 & 2033
- Table 57: Global Short-Read Sequencing Industry Revenue Million Forecast, by End User 2020 & 2033
- Table 58: Global Short-Read Sequencing Industry Volume Billion Forecast, by End User 2020 & 2033
- Table 59: Global Short-Read Sequencing Industry Revenue Million Forecast, by Country 2020 & 2033
- Table 60: Global Short-Read Sequencing Industry Volume Billion Forecast, by Country 2020 & 2033
- Table 61: China Short-Read Sequencing Industry Revenue (Million) Forecast, by Application 2020 & 2033
- Table 62: China Short-Read Sequencing Industry Volume (Billion) Forecast, by Application 2020 & 2033
- Table 63: Japan Short-Read Sequencing Industry Revenue (Million) Forecast, by Application 2020 & 2033
- Table 64: Japan Short-Read Sequencing Industry Volume (Billion) Forecast, by Application 2020 & 2033
- Table 65: India Short-Read Sequencing Industry Revenue (Million) Forecast, by Application 2020 & 2033
- Table 66: India Short-Read Sequencing Industry Volume (Billion) Forecast, by Application 2020 & 2033
- Table 67: Australia Short-Read Sequencing Industry Revenue (Million) Forecast, by Application 2020 & 2033
- Table 68: Australia Short-Read Sequencing Industry Volume (Billion) Forecast, by Application 2020 & 2033
- Table 69: South Korea Short-Read Sequencing Industry Revenue (Million) Forecast, by Application 2020 & 2033
- Table 70: South Korea Short-Read Sequencing Industry Volume (Billion) Forecast, by Application 2020 & 2033
- Table 71: Rest of Asia Pacific Short-Read Sequencing Industry Revenue (Million) Forecast, by Application 2020 & 2033
- Table 72: Rest of Asia Pacific Short-Read Sequencing Industry Volume (Billion) Forecast, by Application 2020 & 2033
- Table 73: Global Short-Read Sequencing Industry Revenue Million Forecast, by Product and Services 2020 & 2033
- Table 74: Global Short-Read Sequencing Industry Volume Billion Forecast, by Product and Services 2020 & 2033
- Table 75: Global Short-Read Sequencing Industry Revenue Million Forecast, by Platform 2020 & 2033
- Table 76: Global Short-Read Sequencing Industry Volume Billion Forecast, by Platform 2020 & 2033
- Table 77: Global Short-Read Sequencing Industry Revenue Million Forecast, by Application 2020 & 2033
- Table 78: Global Short-Read Sequencing Industry Volume Billion Forecast, by Application 2020 & 2033
- Table 79: Global Short-Read Sequencing Industry Revenue Million Forecast, by End User 2020 & 2033
- Table 80: Global Short-Read Sequencing Industry Volume Billion Forecast, by End User 2020 & 2033
- Table 81: Global Short-Read Sequencing Industry Revenue Million Forecast, by Country 2020 & 2033
- Table 82: Global Short-Read Sequencing Industry Volume Billion Forecast, by Country 2020 & 2033
- Table 83: GCC Short-Read Sequencing Industry Revenue (Million) Forecast, by Application 2020 & 2033
- Table 84: GCC Short-Read Sequencing Industry Volume (Billion) Forecast, by Application 2020 & 2033
- Table 85: South Africa Short-Read Sequencing Industry Revenue (Million) Forecast, by Application 2020 & 2033
- Table 86: South Africa Short-Read Sequencing Industry Volume (Billion) Forecast, by Application 2020 & 2033
- Table 87: Rest of Middle East and Africa Short-Read Sequencing Industry Revenue (Million) Forecast, by Application 2020 & 2033
- Table 88: Rest of Middle East and Africa Short-Read Sequencing Industry Volume (Billion) Forecast, by Application 2020 & 2033
- Table 89: Global Short-Read Sequencing Industry Revenue Million Forecast, by Product and Services 2020 & 2033
- Table 90: Global Short-Read Sequencing Industry Volume Billion Forecast, by Product and Services 2020 & 2033
- Table 91: Global Short-Read Sequencing Industry Revenue Million Forecast, by Platform 2020 & 2033
- Table 92: Global Short-Read Sequencing Industry Volume Billion Forecast, by Platform 2020 & 2033
- Table 93: Global Short-Read Sequencing Industry Revenue Million Forecast, by Application 2020 & 2033
- Table 94: Global Short-Read Sequencing Industry Volume Billion Forecast, by Application 2020 & 2033
- Table 95: Global Short-Read Sequencing Industry Revenue Million Forecast, by End User 2020 & 2033
- Table 96: Global Short-Read Sequencing Industry Volume Billion Forecast, by End User 2020 & 2033
- Table 97: Global Short-Read Sequencing Industry Revenue Million Forecast, by Country 2020 & 2033
- Table 98: Global Short-Read Sequencing Industry Volume Billion Forecast, by Country 2020 & 2033
- Table 99: Brazil Short-Read Sequencing Industry Revenue (Million) Forecast, by Application 2020 & 2033
- Table 100: Brazil Short-Read Sequencing Industry Volume (Billion) Forecast, by Application 2020 & 2033
- Table 101: Argentina Short-Read Sequencing Industry Revenue (Million) Forecast, by Application 2020 & 2033
- Table 102: Argentina Short-Read Sequencing Industry Volume (Billion) Forecast, by Application 2020 & 2033
- Table 103: Rest of South America Short-Read Sequencing Industry Revenue (Million) Forecast, by Application 2020 & 2033
- Table 104: Rest of South America Short-Read Sequencing Industry Volume (Billion) Forecast, by Application 2020 & 2033
Frequently Asked Questions
1. What is the projected Compound Annual Growth Rate (CAGR) of the Short-Read Sequencing Industry?
The projected CAGR is approximately 16.40%.
2. Which companies are prominent players in the Short-Read Sequencing Industry?
Key companies in the market include Illumina Inc, Thermo Fisher Scientific Inc, BGI (Beijing Genomics Institute), Agilent Technologies, QIAGEN, F Hoffmann-La Roche Ltd, Pacific Biosciences (PacBio), 10x Geonomics, Oxford Nanopore Technologies PLC, Macrogen Inc, PerkinElmer Inc *List Not Exhaustive.
3. What are the main segments of the Short-Read Sequencing Industry?
The market segments include Product and Services, Platform, Application, End User.
4. Can you provide details about the market size?
The market size is estimated to be USD 7.90 Million as of 2022.
5. What are some drivers contributing to market growth?
Rising Demand for Precision Medicine; Continuous Advancements in Genomics Research; Cost-Effectiveness and Efficiency of Short-read Sequencing Technologies.
6. What are the notable trends driving market growth?
The Whole Genome Sequencing (WGS) Application Segment is Expected to Have a Significant Share in the Market During the Forecast Period.
7. Are there any restraints impacting market growth?
Rising Demand for Precision Medicine; Continuous Advancements in Genomics Research; Cost-Effectiveness and Efficiency of Short-read Sequencing Technologies.
8. Can you provide examples of recent developments in the market?
December 2023: Firalis Molecular Precision, a contract research organization (CRO), significantly bolstered its genomics capabilities by acquiring the cutting-edge Illumina NovaSeq X Plus Sequencing System. This system offers dual flow cell sequencing, enabling refinement and scaling-up of short-read sequencing technology.
9. What pricing options are available for accessing the report?
Pricing options include single-user, multi-user, and enterprise licenses priced at USD 4750, USD 5250, and USD 8750 respectively.
10. Is the market size provided in terms of value or volume?
The market size is provided in terms of value, measured in Million and volume, measured in Billion.
11. Are there any specific market keywords associated with the report?
Yes, the market keyword associated with the report is "Short-Read Sequencing Industry," which aids in identifying and referencing the specific market segment covered.
12. How do I determine which pricing option suits my needs best?
The pricing options vary based on user requirements and access needs. Individual users may opt for single-user licenses, while businesses requiring broader access may choose multi-user or enterprise licenses for cost-effective access to the report.
13. Are there any additional resources or data provided in the Short-Read Sequencing Industry report?
While the report offers comprehensive insights, it's advisable to review the specific contents or supplementary materials provided to ascertain if additional resources or data are available.
14. How can I stay updated on further developments or reports in the Short-Read Sequencing Industry?
To stay informed about further developments, trends, and reports in the Short-Read Sequencing Industry, consider subscribing to industry newsletters, following relevant companies and organizations, or regularly checking reputable industry news sources and publications.
Methodology
Step 1 - Identification of Relevant Samples Size from Population Database


Step 2 - Approaches for Defining Global Market Size (Value, Volume* & Price*)

Note*: In applicable scenarios
Step 3 - Data Sources
Primary Research
- Web Analytics
- Survey Reports
- Research Institute
- Latest Research Reports
- Opinion Leaders
Secondary Research
- Annual Reports
- White Paper
- Latest Press Release
- Industry Association
- Paid Database
- Investor Presentations

Step 4 - Data Triangulation
Involves using different sources of information in order to increase the validity of a study
These sources are likely to be stakeholders in a program - participants, other researchers, program staff, other community members, and so on.
Then we put all data in single framework & apply various statistical tools to find out the dynamic on the market.
During the analysis stage, feedback from the stakeholder groups would be compared to determine areas of agreement as well as areas of divergence
