

Key Insights
The global Static Var Compensator (SVC) market is poised for exceptional growth, driven by the increasing demand for reliable and efficient power grid stabilization. The market is projected to reach an estimated USD 1,600 million in 2025, exhibiting a remarkable Compound Annual Growth Rate (CAGR) of 54% from 2019 to 2033. This robust expansion is primarily fueled by the escalating need for improved power quality, voltage regulation, and enhanced grid stability amidst the growing integration of renewable energy sources. The increasing complexity of power grids, coupled with the rising investments in infrastructure development and grid modernization initiatives across the globe, are significant contributors to this upward trajectory. Furthermore, the growing adoption of industrial automation and the continuous expansion of manufacturing sectors are also playing a crucial role in propelling the demand for SVCs.
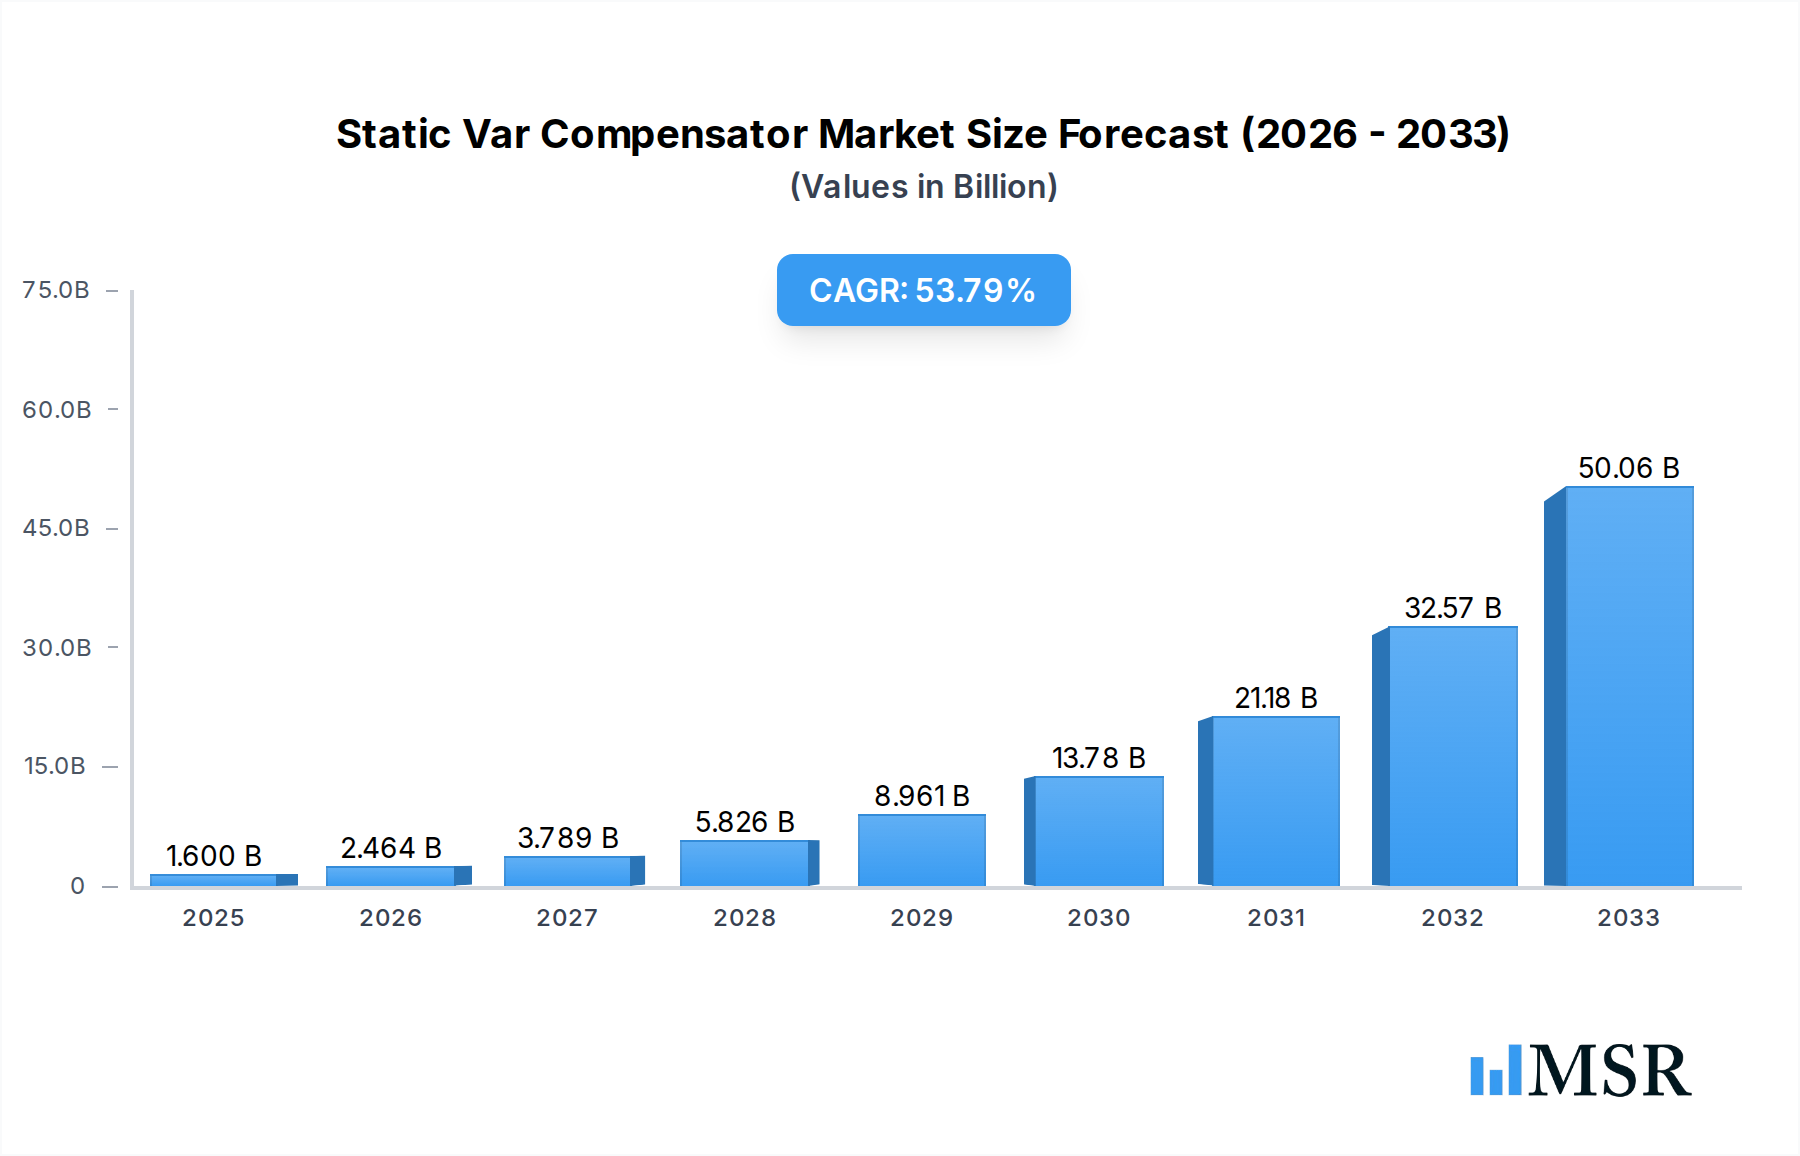
Static Var Compensator Market Size (In Billion)
The SVC market is segmented by application, encompassing industrial, utility, and renewable energy sectors, with the utility segment expected to lead the market due to the critical role of SVCs in maintaining grid stability. By type, the market is divided into thyristor-based SVCs and synchronous condenser-based SVCs, with thyristor-based SVCs currently dominating the market due to their superior performance and responsiveness. While the market exhibits strong growth potential, certain restraints such as the high initial cost of installation and the availability of alternative grid-balancing solutions might pose challenges. However, the overwhelming benefits of SVCs in terms of improved power quality, reduced transmission losses, and increased grid reliability are expected to outweigh these limitations. Leading companies like ABB, Siemens, Mitsubishi Electric, Alstom, and GE are actively investing in research and development to offer advanced SVC solutions, further stimulating market growth.

Static Var Compensator Company Market Share
Unlock critical insights into the global Static Var Compensator (SVC) market with this in-depth report. Covering the study period of 2019–2033, with a base year of 2025 and a forecast period from 2025–2033, this analysis provides a definitive roadmap for industry stakeholders. Dive deep into market dynamics, emerging trends, key players, and future growth trajectories for SVC technology, vital for power quality improvement and grid stability. This report offers actionable intelligence on the SVC market size, CAGR, and application segments, making it an indispensable resource for manufacturers, investors, and utility providers.
Static Var Compensator Market Concentration & Dynamics
The global Static Var Compensator (SVC) market exhibits a moderate to high concentration, with a few dominant players like ABB, Siemens, and Mitsubishi Electric holding significant market share. The SVC market share is influenced by technological expertise, extensive project portfolios, and global service networks. Innovation ecosystems are vibrant, driven by continuous research and development in areas like faster response times, reduced footprint, and enhanced grid integration capabilities. Regulatory frameworks, particularly those promoting grid modernization and renewable energy integration, play a crucial role in shaping market dynamics. Substitute products, such as Dynamic Var Compensators (DVCs) and Flexible AC Transmission Systems (FACTS) devices, offer competitive alternatives but SVCs maintain their relevance due to cost-effectiveness in specific applications and proven reliability. End-user trends favor solutions that improve power quality, enhance grid stability, and support the integration of intermittent renewable energy sources. Merger and acquisition (M&A) activities are moderate, focusing on consolidating market presence and acquiring specialized technological capabilities. The SVC market has witnessed approximately xx M&A deals in the historical period, with projected growth in strategic partnerships.
- Market Share Concentration: Dominated by a few key global players.
- Innovation Ecosystems: Driven by advancements in power electronics and control systems.
- Regulatory Impact: Strong influence from grid codes and renewable energy mandates.
- Substitute Products: Competition from DVCs and other FACTS devices.
- End-User Trends: Focus on grid stability, power quality, and renewable integration.
- M&A Activities: Moderate, with a focus on strategic consolidation and technology acquisition.
Static Var Compensator Industry Insights & Trends
The Static Var Compensator (SVC) industry is poised for substantial growth, driven by the increasing demand for reliable and stable power grids worldwide. The SVC market size was estimated at over $2.5 billion in the base year 2025 and is projected to reach over $4.0 billion by 2033, exhibiting a Compound Annual Growth Rate (CAGR) of approximately 5.5%. This expansion is fueled by several key factors. Firstly, the escalating integration of renewable energy sources like solar and wind power, which are inherently intermittent, necessitates advanced grid control solutions to maintain voltage stability and power quality. SVCs are instrumental in compensating for the rapid voltage fluctuations associated with these sources. Secondly, the rapid urbanization and industrialization in emerging economies are leading to increased electricity demand, placing greater stress on existing power infrastructure. This surge in demand requires robust solutions for grid reinforcement and efficiency, where SVCs play a vital role.
Technological disruptions are continuously enhancing SVC performance. Advancements in power electronics, particularly the development of faster-switching semiconductor devices like IGBTs and GTOs, have led to the creation of more efficient, compact, and responsive SVC systems. The development of hybrid SVCs, combining traditional thyristor-based systems with more agile elements like voltage-sourced converters, offers a blend of cost-effectiveness and superior dynamic performance. Furthermore, sophisticated control algorithms and digital monitoring systems are improving the operational efficiency and predictive maintenance capabilities of SVCs.
Evolving consumer behaviors, while not directly impacting SVC demand, are indirectly influencing the market through their contribution to overall energy consumption patterns and the push for greener energy solutions. The increasing adoption of electric vehicles and smart home technologies, for instance, will contribute to more complex load profiles on the grid, further emphasizing the need for advanced power quality management systems. The global push towards decarbonization and the establishment of smart grids are fundamental trends supporting the long-term growth of the SVC market. The report also examines the impact of evolving grid codes and international standards that are increasingly mandating the use of advanced reactive power compensation devices to ensure grid stability and reliability, directly benefiting the SVC market. The continuous research and development efforts by major players like GE, Hitachi, and Toshiba are also driving innovation and market expansion.
Key Markets & Segments Leading Static Var Compensator
The Static Var Compensator (SVC) market is experiencing significant leadership from key regions and application segments, driven by robust economic growth and substantial infrastructure development. Asia Pacific stands out as the dominant region, with countries like China and India spearheading the demand for SVCs. This dominance is attributed to several factors:
- Economic Growth & Industrialization: Rapid industrial expansion in these nations necessitates significant investments in power infrastructure to support manufacturing and mining operations.
- Infrastructure Development: Large-scale projects in power transmission and distribution, including grid modernization and the construction of new power plants, require advanced reactive power compensation.
- Renewable Energy Integration: Asia Pacific is a global leader in renewable energy deployment, particularly solar and wind power. The intermittency of these sources creates a critical need for SVCs to ensure grid stability. China's ambitious renewable energy targets and substantial investments in grid-connected renewable projects are a major growth driver.
- Urbanization: The rapid growth of urban centers leads to increased electricity consumption and complex load patterns, making SVCs essential for maintaining power quality and voltage stability in densely populated areas.
Within the Application: segment, the Industrial sector is a primary driver of SVC demand. This includes:
- Mining & Metals: Large industrial complexes in mining and metals processing require significant amounts of reactive power and are prone to voltage sags and swells, making SVCs crucial for stable operations. Companies like Alstom and GE have a strong presence in supplying SVCs to these industries.
- Pulp & Paper: These industries are characterized by heavy electrical loads and fluctuating power demands, necessitating effective reactive power compensation to prevent disruptions.
- Petrochemical & Chemical: The continuous nature of processes in these sectors demands highly reliable power supply, which SVCs help ensure by mitigating voltage disturbances.
- Cement: Cement plants are energy-intensive and require stable power for their heavy machinery, making SVCs a vital component of their electrical infrastructure.
The Type: segment of Thyristor-Based SVCs continues to hold a significant market share due to their proven reliability and cost-effectiveness for many applications. However, advancements are also driving the growth of Hybrid SVCs, which combine the benefits of thyristor-based systems with faster-responding voltage-sourced converters, offering enhanced dynamic performance.
- Thyristor-Based SVCs: Dominant due to their mature technology, robustness, and lower initial cost in many scenarios.
- Hybrid SVCs: Gaining traction for applications requiring faster response times and greater flexibility, bridging the gap between traditional SVCs and more advanced FACTS devices.
The dominance of these segments is further reinforced by government initiatives promoting grid reliability, energy efficiency, and the integration of distributed energy resources. Countries like Japan and South Korea also contribute to the regional demand with their focus on advanced grid technologies and the steady growth of their industrial sectors.
Static Var Compensator Product Developments
Product developments in the Static Var Compensator (SVC) market are focused on enhancing performance, reducing footprint, and improving cost-effectiveness. Innovations in power electronics, particularly the adoption of advanced semiconductor devices and modular converter topologies, are leading to SVCs with faster response times and greater controllability. Manufacturers like Rongxin Power Electronic and Zhiguang Electric are introducing SVCs with integrated digital control systems that enable sophisticated grid monitoring, fault detection, and adaptive control strategies. There is a growing trend towards the development of compact, modular SVC solutions that are easier to transport, install, and maintain, catering to the needs of distributed generation and smaller industrial applications. The market relevance of these advancements lies in their ability to address the increasing complexity of power grids, driven by renewable energy integration and evolving load patterns, thereby ensuring improved grid stability and power quality.
Challenges in the Static Var Compensator Market
The Static Var Compensator (SVC) market faces several challenges that can impede its growth trajectory. Regulatory hurdles, particularly variations in grid connection standards and permitting processes across different regions, can lead to project delays and increased costs. Supply chain issues, exacerbated by global geopolitical events and the reliance on specialized components, can affect manufacturing timelines and component availability. Competitive pressures from alternative technologies like Static Synchronous Compensators (STATCOMs) and other FACTS devices, which offer faster response times and more advanced functionalities in certain scenarios, pose a significant challenge. Furthermore, the high initial capital investment required for SVC installations can be a barrier for smaller utilities or in price-sensitive markets. The complexity of integration with existing grid infrastructure also requires specialized expertise and can lead to implementation challenges.
Forces Driving Static Var Compensator Growth
Several powerful forces are propelling the growth of the Static Var Compensator (SVC) market. The fundamental driver is the relentless expansion of global electricity demand, necessitating robust and reliable power grids. The accelerating integration of renewable energy sources, such as solar and wind, is a critical catalyst, as SVCs are essential for managing the inherent voltage fluctuations and ensuring grid stability. Government initiatives and policies aimed at grid modernization, enhancing energy efficiency, and promoting the decarbonization of the energy sector further bolster demand. The ongoing industrialization and urbanization in emerging economies create a constant need for expanded and upgraded power infrastructure, where SVCs play a crucial role in maintaining power quality. Advancements in power electronics technology, leading to more efficient, compact, and cost-effective SVC designs, also contribute to market expansion.
Challenges in the Static Var Compensator Market
Long-term growth catalysts for the Static Var Compensator (SVC) market are deeply intertwined with global energy trends and technological advancements. The continued transition towards a low-carbon economy, with increasing reliance on renewable energy, will sustain the need for grid stability solutions like SVCs. Innovations in smart grid technologies, including advanced control systems and digital twins, will enhance the operational capabilities and integration of SVCs. Strategic partnerships between SVC manufacturers and utility companies are crucial for developing customized solutions and accelerating deployment. Furthermore, market expansions into developing regions with rapidly growing energy needs present significant long-term opportunities. The development of next-generation SVCs with enhanced features, such as dynamic voltage support and grid fault ride-through capabilities, will also be key growth accelerators.
Emerging Opportunities in Static Var Compensator
Emerging opportunities in the Static Var Compensator (SVC) market are driven by evolving energy landscapes and technological breakthroughs. The increasing deployment of offshore wind farms, which present unique grid connection challenges, offers a significant market for advanced SVC solutions. The growing demand for grid resilience in the face of extreme weather events and cyber threats creates opportunities for SVCs that can enhance grid stability and rapid recovery. The development of distributed energy resource management systems (DERMS) and microgrids also presents a fertile ground for SVC integration, enabling better control and coordination of local power resources. Furthermore, the retrofitting of existing substations with modern SVC technology to improve power quality and capacity is a growing opportunity. The adoption of artificial intelligence and machine learning for predictive maintenance and optimized operation of SVCs is another area with substantial potential.
Leading Players in the Static Var Compensator Sector
- ABB
- Siemens
- Mitsubishi Electric
- Alstom
- GE
- Hitachi
- Toshiba
- Rongxin Power Electronic
- Epri
- Weihan Power
- XJ Group
- Zhiguang Electric
- Hengshun Electric
- Xidian Power
- Yinhu Electric
- Sanyi Electric
- Surpass Sun Electric
- Sound Power
- Fujidaneng Electric
- Jiuzhou Electric
Key Milestones in Static Var Compensator Industry
- 2019: Increased adoption of hybrid SVC technologies for enhanced dynamic response.
- 2020: Growing emphasis on digital control systems and grid integration for SVCs.
- 2021: Expansion of SVC applications in the burgeoning renewable energy sector, particularly for wind farms.
- 2022: Significant investments in R&D for more compact and cost-effective SVC solutions.
- 2023: Growing awareness of SVC benefits for grid modernization and stability initiatives globally.
- 2024: Emergence of advanced SVC control algorithms leveraging AI and machine learning for predictive maintenance.
- 2025: Anticipated increase in deployment of SVCs to support grid integration of offshore wind and large-scale solar projects.
- 2026-2033: Projected sustained growth driven by global decarbonization efforts and smart grid development.
Strategic Outlook for Static Var Compensator Market
The strategic outlook for the Static Var Compensator (SVC) market is exceptionally positive, driven by the global imperative for stable, reliable, and sustainable power grids. Growth accelerators will include continued investments in renewable energy infrastructure, the ongoing expansion of smart grids, and the increasing demand for industrial power quality solutions. Manufacturers are strategically focusing on developing more intelligent, modular, and efficient SVC systems. Partnerships with utility providers and energy developers will be crucial for tailoring solutions to specific grid requirements and accelerating market penetration. The SVC market is poised to play a pivotal role in the global energy transition, ensuring the integrity and efficiency of power networks for years to come.
Static Var Compensator Segmentation
-
1. Application
- 1.1. undefined
-
2. Type
- 2.1. undefined
Static Var Compensator Segmentation By Geography
- 1. undefined
- 2. undefined
- 3. undefined
- 4. undefined
- 5. undefined
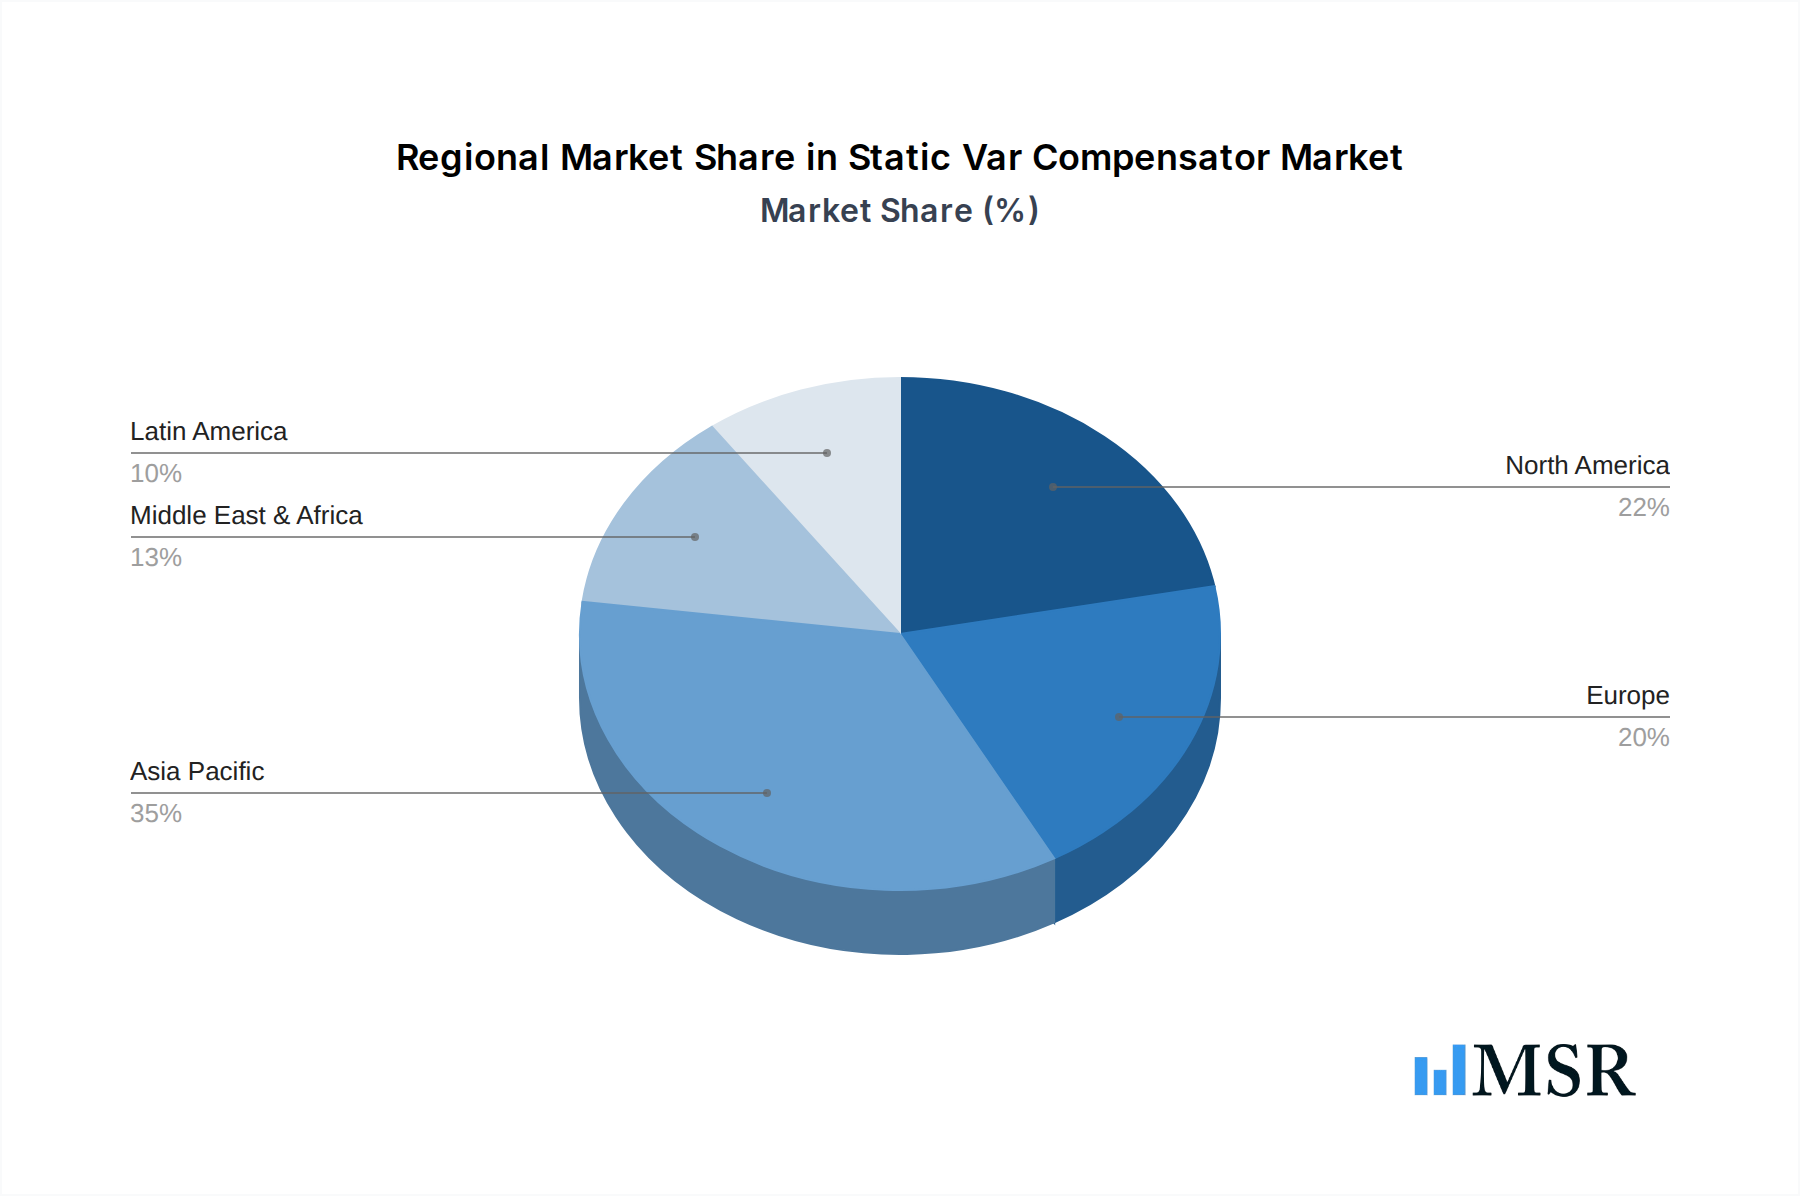
Static Var Compensator Regional Market Share
Geographic Coverage of Static Var Compensator
Static Var Compensator REPORT HIGHLIGHTS
| Aspects | Details |
|---|---|
| Study Period | 2020-2034 |
| Base Year | 2025 |
| Estimated Year | 2026 |
| Forecast Period | 2026-2034 |
| Historical Period | 2020-2025 |
| Growth Rate | CAGR of 54% from 2020-2034 |
| Segmentation |
|
Table of Contents
- 1. Introduction
- 1.1. Research Scope
- 1.2. Market Segmentation
- 1.3. Research Methodology
- 1.4. Definitions and Assumptions
- 2. Executive Summary
- 2.1. Introduction
- 3. Market Dynamics
- 3.1. Introduction
- 3.2. Market Drivers
- 3.3. Market Restrains
- 3.4. Market Trends
- 4. Market Factor Analysis
- 4.1. Porters Five Forces
- 4.2. Supply/Value Chain
- 4.3. PESTEL analysis
- 4.4. Market Entropy
- 4.5. Patent/Trademark Analysis
- 5. Global Static Var Compensator Analysis, Insights and Forecast, 2020-2032
- 5.1. Market Analysis, Insights and Forecast - by Application
- 5.1.1.
- 5.2. Market Analysis, Insights and Forecast - by Type
- 5.2.1.
- 5.3. Market Analysis, Insights and Forecast - by Region
- 5.3.1.
- 5.3.2.
- 5.3.3.
- 5.3.4.
- 5.3.5.
- 5.1. Market Analysis, Insights and Forecast - by Application
- 6. undefined Static Var Compensator Analysis, Insights and Forecast, 2020-2032
- 6.1. Market Analysis, Insights and Forecast - by Application
- 6.1.1.
- 6.2. Market Analysis, Insights and Forecast - by Type
- 6.2.1.
- 6.1. Market Analysis, Insights and Forecast - by Application
- 7. undefined Static Var Compensator Analysis, Insights and Forecast, 2020-2032
- 7.1. Market Analysis, Insights and Forecast - by Application
- 7.1.1.
- 7.2. Market Analysis, Insights and Forecast - by Type
- 7.2.1.
- 7.1. Market Analysis, Insights and Forecast - by Application
- 8. undefined Static Var Compensator Analysis, Insights and Forecast, 2020-2032
- 8.1. Market Analysis, Insights and Forecast - by Application
- 8.1.1.
- 8.2. Market Analysis, Insights and Forecast - by Type
- 8.2.1.
- 8.1. Market Analysis, Insights and Forecast - by Application
- 9. undefined Static Var Compensator Analysis, Insights and Forecast, 2020-2032
- 9.1. Market Analysis, Insights and Forecast - by Application
- 9.1.1.
- 9.2. Market Analysis, Insights and Forecast - by Type
- 9.2.1.
- 9.1. Market Analysis, Insights and Forecast - by Application
- 10. undefined Static Var Compensator Analysis, Insights and Forecast, 2020-2032
- 10.1. Market Analysis, Insights and Forecast - by Application
- 10.1.1.
- 10.2. Market Analysis, Insights and Forecast - by Type
- 10.2.1.
- 10.1. Market Analysis, Insights and Forecast - by Application
- 11. Competitive Analysis
- 11.1. Global Market Share Analysis 2025
- 11.2. Company Profiles
- 11.2.1 ABB
- 11.2.1.1. Overview
- 11.2.1.2. Products
- 11.2.1.3. SWOT Analysis
- 11.2.1.4. Recent Developments
- 11.2.1.5. Financials (Based on Availability)
- 11.2.2 Siemens
- 11.2.2.1. Overview
- 11.2.2.2. Products
- 11.2.2.3. SWOT Analysis
- 11.2.2.4. Recent Developments
- 11.2.2.5. Financials (Based on Availability)
- 11.2.3 Mitsubishi Electric
- 11.2.3.1. Overview
- 11.2.3.2. Products
- 11.2.3.3. SWOT Analysis
- 11.2.3.4. Recent Developments
- 11.2.3.5. Financials (Based on Availability)
- 11.2.4 Alstom
- 11.2.4.1. Overview
- 11.2.4.2. Products
- 11.2.4.3. SWOT Analysis
- 11.2.4.4. Recent Developments
- 11.2.4.5. Financials (Based on Availability)
- 11.2.5 GE
- 11.2.5.1. Overview
- 11.2.5.2. Products
- 11.2.5.3. SWOT Analysis
- 11.2.5.4. Recent Developments
- 11.2.5.5. Financials (Based on Availability)
- 11.2.6 Hitachi
- 11.2.6.1. Overview
- 11.2.6.2. Products
- 11.2.6.3. SWOT Analysis
- 11.2.6.4. Recent Developments
- 11.2.6.5. Financials (Based on Availability)
- 11.2.7 Toshiba
- 11.2.7.1. Overview
- 11.2.7.2. Products
- 11.2.7.3. SWOT Analysis
- 11.2.7.4. Recent Developments
- 11.2.7.5. Financials (Based on Availability)
- 11.2.8 Rongxin Power Electronic
- 11.2.8.1. Overview
- 11.2.8.2. Products
- 11.2.8.3. SWOT Analysis
- 11.2.8.4. Recent Developments
- 11.2.8.5. Financials (Based on Availability)
- 11.2.9 Epri
- 11.2.9.1. Overview
- 11.2.9.2. Products
- 11.2.9.3. SWOT Analysis
- 11.2.9.4. Recent Developments
- 11.2.9.5. Financials (Based on Availability)
- 11.2.10 Weihan Power
- 11.2.10.1. Overview
- 11.2.10.2. Products
- 11.2.10.3. SWOT Analysis
- 11.2.10.4. Recent Developments
- 11.2.10.5. Financials (Based on Availability)
- 11.2.11 XJ Group
- 11.2.11.1. Overview
- 11.2.11.2. Products
- 11.2.11.3. SWOT Analysis
- 11.2.11.4. Recent Developments
- 11.2.11.5. Financials (Based on Availability)
- 11.2.12 Zhiguang Electric
- 11.2.12.1. Overview
- 11.2.12.2. Products
- 11.2.12.3. SWOT Analysis
- 11.2.12.4. Recent Developments
- 11.2.12.5. Financials (Based on Availability)
- 11.2.13 Hengshun Electric
- 11.2.13.1. Overview
- 11.2.13.2. Products
- 11.2.13.3. SWOT Analysis
- 11.2.13.4. Recent Developments
- 11.2.13.5. Financials (Based on Availability)
- 11.2.14 Xidian Power
- 11.2.14.1. Overview
- 11.2.14.2. Products
- 11.2.14.3. SWOT Analysis
- 11.2.14.4. Recent Developments
- 11.2.14.5. Financials (Based on Availability)
- 11.2.15 Yinhu Electric
- 11.2.15.1. Overview
- 11.2.15.2. Products
- 11.2.15.3. SWOT Analysis
- 11.2.15.4. Recent Developments
- 11.2.15.5. Financials (Based on Availability)
- 11.2.16 Sanyi Electric
- 11.2.16.1. Overview
- 11.2.16.2. Products
- 11.2.16.3. SWOT Analysis
- 11.2.16.4. Recent Developments
- 11.2.16.5. Financials (Based on Availability)
- 11.2.17 Surpass Sun Electric
- 11.2.17.1. Overview
- 11.2.17.2. Products
- 11.2.17.3. SWOT Analysis
- 11.2.17.4. Recent Developments
- 11.2.17.5. Financials (Based on Availability)
- 11.2.18 Sound Power
- 11.2.18.1. Overview
- 11.2.18.2. Products
- 11.2.18.3. SWOT Analysis
- 11.2.18.4. Recent Developments
- 11.2.18.5. Financials (Based on Availability)
- 11.2.19 Fujidaneng Electric
- 11.2.19.1. Overview
- 11.2.19.2. Products
- 11.2.19.3. SWOT Analysis
- 11.2.19.4. Recent Developments
- 11.2.19.5. Financials (Based on Availability)
- 11.2.20 Jiuzhou Electric
- 11.2.20.1. Overview
- 11.2.20.2. Products
- 11.2.20.3. SWOT Analysis
- 11.2.20.4. Recent Developments
- 11.2.20.5. Financials (Based on Availability)
- 11.2.1 ABB
List of Figures
- Figure 1: Global Static Var Compensator Revenue Breakdown (billion, %) by Region 2025 & 2033
- Figure 2: Global Static Var Compensator Volume Breakdown (K, %) by Region 2025 & 2033
- Figure 3: undefined Static Var Compensator Revenue (billion), by Application 2025 & 2033
- Figure 4: undefined Static Var Compensator Volume (K), by Application 2025 & 2033
- Figure 5: undefined Static Var Compensator Revenue Share (%), by Application 2025 & 2033
- Figure 6: undefined Static Var Compensator Volume Share (%), by Application 2025 & 2033
- Figure 7: undefined Static Var Compensator Revenue (billion), by Type 2025 & 2033
- Figure 8: undefined Static Var Compensator Volume (K), by Type 2025 & 2033
- Figure 9: undefined Static Var Compensator Revenue Share (%), by Type 2025 & 2033
- Figure 10: undefined Static Var Compensator Volume Share (%), by Type 2025 & 2033
- Figure 11: undefined Static Var Compensator Revenue (billion), by Country 2025 & 2033
- Figure 12: undefined Static Var Compensator Volume (K), by Country 2025 & 2033
- Figure 13: undefined Static Var Compensator Revenue Share (%), by Country 2025 & 2033
- Figure 14: undefined Static Var Compensator Volume Share (%), by Country 2025 & 2033
- Figure 15: undefined Static Var Compensator Revenue (billion), by Application 2025 & 2033
- Figure 16: undefined Static Var Compensator Volume (K), by Application 2025 & 2033
- Figure 17: undefined Static Var Compensator Revenue Share (%), by Application 2025 & 2033
- Figure 18: undefined Static Var Compensator Volume Share (%), by Application 2025 & 2033
- Figure 19: undefined Static Var Compensator Revenue (billion), by Type 2025 & 2033
- Figure 20: undefined Static Var Compensator Volume (K), by Type 2025 & 2033
- Figure 21: undefined Static Var Compensator Revenue Share (%), by Type 2025 & 2033
- Figure 22: undefined Static Var Compensator Volume Share (%), by Type 2025 & 2033
- Figure 23: undefined Static Var Compensator Revenue (billion), by Country 2025 & 2033
- Figure 24: undefined Static Var Compensator Volume (K), by Country 2025 & 2033
- Figure 25: undefined Static Var Compensator Revenue Share (%), by Country 2025 & 2033
- Figure 26: undefined Static Var Compensator Volume Share (%), by Country 2025 & 2033
- Figure 27: undefined Static Var Compensator Revenue (billion), by Application 2025 & 2033
- Figure 28: undefined Static Var Compensator Volume (K), by Application 2025 & 2033
- Figure 29: undefined Static Var Compensator Revenue Share (%), by Application 2025 & 2033
- Figure 30: undefined Static Var Compensator Volume Share (%), by Application 2025 & 2033
- Figure 31: undefined Static Var Compensator Revenue (billion), by Type 2025 & 2033
- Figure 32: undefined Static Var Compensator Volume (K), by Type 2025 & 2033
- Figure 33: undefined Static Var Compensator Revenue Share (%), by Type 2025 & 2033
- Figure 34: undefined Static Var Compensator Volume Share (%), by Type 2025 & 2033
- Figure 35: undefined Static Var Compensator Revenue (billion), by Country 2025 & 2033
- Figure 36: undefined Static Var Compensator Volume (K), by Country 2025 & 2033
- Figure 37: undefined Static Var Compensator Revenue Share (%), by Country 2025 & 2033
- Figure 38: undefined Static Var Compensator Volume Share (%), by Country 2025 & 2033
- Figure 39: undefined Static Var Compensator Revenue (billion), by Application 2025 & 2033
- Figure 40: undefined Static Var Compensator Volume (K), by Application 2025 & 2033
- Figure 41: undefined Static Var Compensator Revenue Share (%), by Application 2025 & 2033
- Figure 42: undefined Static Var Compensator Volume Share (%), by Application 2025 & 2033
- Figure 43: undefined Static Var Compensator Revenue (billion), by Type 2025 & 2033
- Figure 44: undefined Static Var Compensator Volume (K), by Type 2025 & 2033
- Figure 45: undefined Static Var Compensator Revenue Share (%), by Type 2025 & 2033
- Figure 46: undefined Static Var Compensator Volume Share (%), by Type 2025 & 2033
- Figure 47: undefined Static Var Compensator Revenue (billion), by Country 2025 & 2033
- Figure 48: undefined Static Var Compensator Volume (K), by Country 2025 & 2033
- Figure 49: undefined Static Var Compensator Revenue Share (%), by Country 2025 & 2033
- Figure 50: undefined Static Var Compensator Volume Share (%), by Country 2025 & 2033
- Figure 51: undefined Static Var Compensator Revenue (billion), by Application 2025 & 2033
- Figure 52: undefined Static Var Compensator Volume (K), by Application 2025 & 2033
- Figure 53: undefined Static Var Compensator Revenue Share (%), by Application 2025 & 2033
- Figure 54: undefined Static Var Compensator Volume Share (%), by Application 2025 & 2033
- Figure 55: undefined Static Var Compensator Revenue (billion), by Type 2025 & 2033
- Figure 56: undefined Static Var Compensator Volume (K), by Type 2025 & 2033
- Figure 57: undefined Static Var Compensator Revenue Share (%), by Type 2025 & 2033
- Figure 58: undefined Static Var Compensator Volume Share (%), by Type 2025 & 2033
- Figure 59: undefined Static Var Compensator Revenue (billion), by Country 2025 & 2033
- Figure 60: undefined Static Var Compensator Volume (K), by Country 2025 & 2033
- Figure 61: undefined Static Var Compensator Revenue Share (%), by Country 2025 & 2033
- Figure 62: undefined Static Var Compensator Volume Share (%), by Country 2025 & 2033
List of Tables
- Table 1: Global Static Var Compensator Revenue billion Forecast, by Application 2020 & 2033
- Table 2: Global Static Var Compensator Volume K Forecast, by Application 2020 & 2033
- Table 3: Global Static Var Compensator Revenue billion Forecast, by Type 2020 & 2033
- Table 4: Global Static Var Compensator Volume K Forecast, by Type 2020 & 2033
- Table 5: Global Static Var Compensator Revenue billion Forecast, by Region 2020 & 2033
- Table 6: Global Static Var Compensator Volume K Forecast, by Region 2020 & 2033
- Table 7: Global Static Var Compensator Revenue billion Forecast, by Application 2020 & 2033
- Table 8: Global Static Var Compensator Volume K Forecast, by Application 2020 & 2033
- Table 9: Global Static Var Compensator Revenue billion Forecast, by Type 2020 & 2033
- Table 10: Global Static Var Compensator Volume K Forecast, by Type 2020 & 2033
- Table 11: Global Static Var Compensator Revenue billion Forecast, by Country 2020 & 2033
- Table 12: Global Static Var Compensator Volume K Forecast, by Country 2020 & 2033
- Table 13: Global Static Var Compensator Revenue billion Forecast, by Application 2020 & 2033
- Table 14: Global Static Var Compensator Volume K Forecast, by Application 2020 & 2033
- Table 15: Global Static Var Compensator Revenue billion Forecast, by Type 2020 & 2033
- Table 16: Global Static Var Compensator Volume K Forecast, by Type 2020 & 2033
- Table 17: Global Static Var Compensator Revenue billion Forecast, by Country 2020 & 2033
- Table 18: Global Static Var Compensator Volume K Forecast, by Country 2020 & 2033
- Table 19: Global Static Var Compensator Revenue billion Forecast, by Application 2020 & 2033
- Table 20: Global Static Var Compensator Volume K Forecast, by Application 2020 & 2033
- Table 21: Global Static Var Compensator Revenue billion Forecast, by Type 2020 & 2033
- Table 22: Global Static Var Compensator Volume K Forecast, by Type 2020 & 2033
- Table 23: Global Static Var Compensator Revenue billion Forecast, by Country 2020 & 2033
- Table 24: Global Static Var Compensator Volume K Forecast, by Country 2020 & 2033
- Table 25: Global Static Var Compensator Revenue billion Forecast, by Application 2020 & 2033
- Table 26: Global Static Var Compensator Volume K Forecast, by Application 2020 & 2033
- Table 27: Global Static Var Compensator Revenue billion Forecast, by Type 2020 & 2033
- Table 28: Global Static Var Compensator Volume K Forecast, by Type 2020 & 2033
- Table 29: Global Static Var Compensator Revenue billion Forecast, by Country 2020 & 2033
- Table 30: Global Static Var Compensator Volume K Forecast, by Country 2020 & 2033
- Table 31: Global Static Var Compensator Revenue billion Forecast, by Application 2020 & 2033
- Table 32: Global Static Var Compensator Volume K Forecast, by Application 2020 & 2033
- Table 33: Global Static Var Compensator Revenue billion Forecast, by Type 2020 & 2033
- Table 34: Global Static Var Compensator Volume K Forecast, by Type 2020 & 2033
- Table 35: Global Static Var Compensator Revenue billion Forecast, by Country 2020 & 2033
- Table 36: Global Static Var Compensator Volume K Forecast, by Country 2020 & 2033
Frequently Asked Questions
1. What is the projected Compound Annual Growth Rate (CAGR) of the Static Var Compensator?
The projected CAGR is approximately 54%.
2. Which companies are prominent players in the Static Var Compensator?
Key companies in the market include ABB, Siemens, Mitsubishi Electric, Alstom, GE, Hitachi, Toshiba, Rongxin Power Electronic, Epri, Weihan Power, XJ Group, Zhiguang Electric, Hengshun Electric, Xidian Power, Yinhu Electric, Sanyi Electric, Surpass Sun Electric, Sound Power, Fujidaneng Electric, Jiuzhou Electric.
3. What are the main segments of the Static Var Compensator?
The market segments include Application, Type.
4. Can you provide details about the market size?
The market size is estimated to be USD 1.6 billion as of 2022.
5. What are some drivers contributing to market growth?
N/A
6. What are the notable trends driving market growth?
N/A
7. Are there any restraints impacting market growth?
N/A
8. Can you provide examples of recent developments in the market?
N/A
9. What pricing options are available for accessing the report?
Pricing options include single-user, multi-user, and enterprise licenses priced at USD 3950.00, USD 5925.00, and USD 7900.00 respectively.
10. Is the market size provided in terms of value or volume?
The market size is provided in terms of value, measured in billion and volume, measured in K.
11. Are there any specific market keywords associated with the report?
Yes, the market keyword associated with the report is "Static Var Compensator," which aids in identifying and referencing the specific market segment covered.
12. How do I determine which pricing option suits my needs best?
The pricing options vary based on user requirements and access needs. Individual users may opt for single-user licenses, while businesses requiring broader access may choose multi-user or enterprise licenses for cost-effective access to the report.
13. Are there any additional resources or data provided in the Static Var Compensator report?
While the report offers comprehensive insights, it's advisable to review the specific contents or supplementary materials provided to ascertain if additional resources or data are available.
14. How can I stay updated on further developments or reports in the Static Var Compensator?
To stay informed about further developments, trends, and reports in the Static Var Compensator, consider subscribing to industry newsletters, following relevant companies and organizations, or regularly checking reputable industry news sources and publications.
Methodology
Step 1 - Identification of Relevant Samples Size from Population Database


Step 2 - Approaches for Defining Global Market Size (Value, Volume* & Price*)

Note*: In applicable scenarios
Step 3 - Data Sources
Primary Research
- Web Analytics
- Survey Reports
- Research Institute
- Latest Research Reports
- Opinion Leaders
Secondary Research
- Annual Reports
- White Paper
- Latest Press Release
- Industry Association
- Paid Database
- Investor Presentations

Step 4 - Data Triangulation
Involves using different sources of information in order to increase the validity of a study
These sources are likely to be stakeholders in a program - participants, other researchers, program staff, other community members, and so on.
Then we put all data in single framework & apply various statistical tools to find out the dynamic on the market.
During the analysis stage, feedback from the stakeholder groups would be compared to determine areas of agreement as well as areas of divergence