

Key Insights
The global surface vision and inspection equipment market is projected for significant expansion, expected to reach a market size of 14.86 billion by 2033. The market is anticipated to grow at a Compound Annual Growth Rate (CAGR) of 14.56% from 2025 to 2033, propelled by the increasing automation in manufacturing across key sectors like automotive, electronics, and pharmaceuticals. Demand for stringent quality control and defect detection, alongside advancements in AI-powered image processing and superior sensor technology, are key growth drivers. The widespread adoption of smart factories and Industry 4.0 initiatives further bolsters this expansion. Analysis indicates robust opportunities in automotive and electronics applications, with camera and lighting components leading the market. However, the substantial upfront investment for advanced vision systems may present a challenge for smaller enterprises. The competitive environment is dynamic, featuring established leaders and emerging innovators, fostering continuous technological development and diverse solutions.
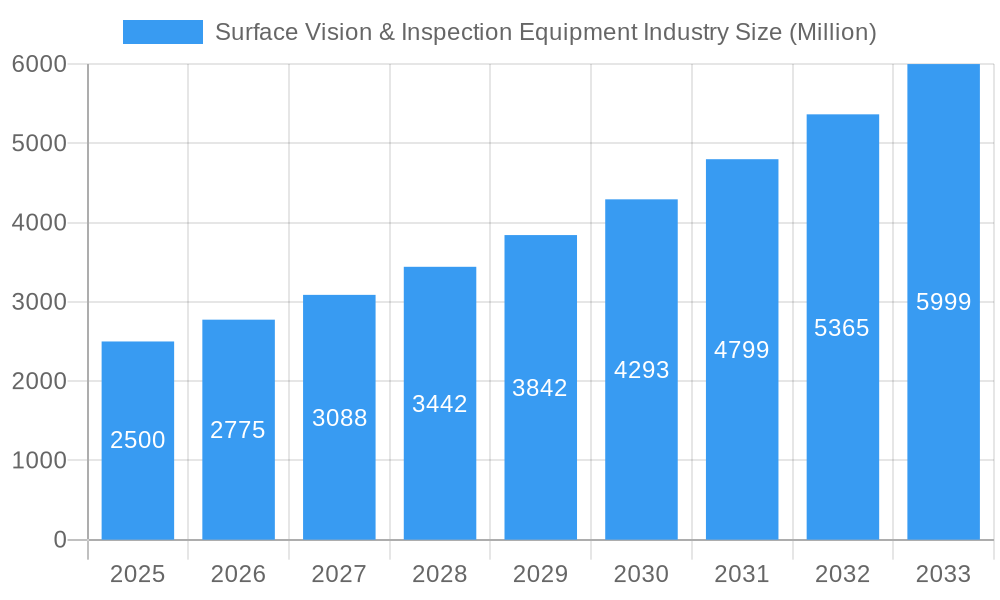
Surface Vision & Inspection Equipment Industry Market Size (In Billion)
Regionally, Asia-Pacific demonstrates robust growth, driven by its expanding manufacturing base and thriving electronics industry. North America and Europe retain significant market positions due to their advanced technological infrastructure and consistent demand for high-quality control across various industries. The ongoing integration of deep learning and 3D vision systems is expected to significantly influence the competitive dynamics and accelerate market growth. The market presents considerable expansion opportunities throughout the value chain. Stakeholders must remain agile, adapting to rapid technological advancements while addressing cost considerations and regulatory complexities.
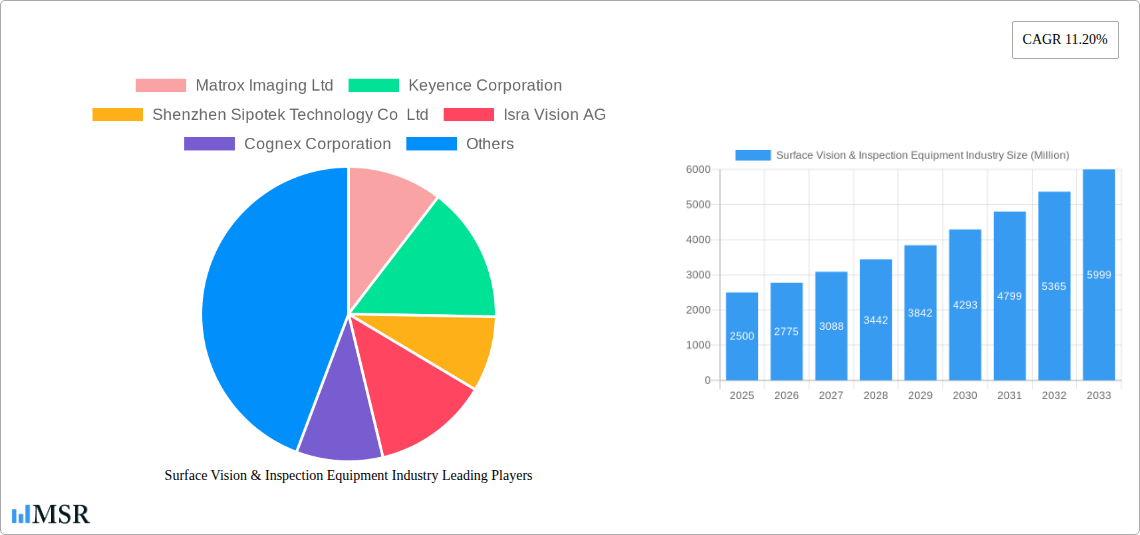
Surface Vision & Inspection Equipment Industry Company Market Share
Surface Vision & Inspection Equipment Market Report: 2019-2033
This comprehensive report provides an in-depth analysis of the Surface Vision & Inspection Equipment industry, offering invaluable insights for stakeholders, investors, and industry professionals. With a study period spanning 2019-2033, a base year of 2025, and a forecast period of 2025-2033, this report utilizes rigorous data analysis to project future market trends and identify lucrative opportunities. The global market size is estimated at $XX Million in 2025.
Surface Vision & Inspection Equipment Industry Market Concentration & Dynamics
The Surface Vision & Inspection Equipment market exhibits a moderately concentrated landscape, with key players like Matrox Imaging Ltd, Keyence Corporation, Cognex Corporation, and Isra Vision AG holding significant market share. The combined market share of the top five players is estimated at xx%. Innovation thrives through strategic partnerships, R&D investments, and acquisitions. The regulatory framework varies across regions, impacting adoption rates. Substitute products, such as manual inspection methods, exist but are gradually being replaced due to the increasing demand for higher accuracy and efficiency. End-user trends show a preference for automated solutions with advanced features like AI-powered defect detection. M&A activity has been moderate in recent years, with xx major deals recorded between 2019 and 2024.
- Market Share: Top 5 players hold xx% of the market.
- M&A Deals (2019-2024): xx major deals.
- Key Innovation Drivers: Strategic partnerships, R&D investments.
- Regulatory Landscape: Varies significantly by region.
Surface Vision & Inspection Equipment Industry Insights & Trends
The Surface Vision & Inspection Equipment market is experiencing robust growth, driven by increasing automation across various industries, particularly in automotive, electronics, and pharmaceuticals. The market size is projected to reach $XX Million by 2033, exhibiting a CAGR of xx% during the forecast period. Technological advancements, such as the integration of AI and machine learning for enhanced defect detection and improved process control, are significant growth drivers. Evolving consumer behaviors favor higher precision, faster processing speeds, and cost-effective solutions. The adoption of Industry 4.0 principles further fuels market expansion. The increasing demand for quality control in manufacturing processes and the growing need for automated inspection solutions across diverse industries are contributing to market growth.
Key Markets & Segments Leading Surface Vision & Inspection Equipment Industry
The Automotive segment dominates the application landscape, driven by stringent quality control standards and the increasing complexity of vehicle components. The Electrical & Electronics sector shows significant growth potential due to the rise of smart devices and miniaturization. Geographically, North America and Europe are leading markets, fueled by advanced manufacturing capabilities and high adoption rates of automated solutions.
Dominant Segments:
- By Component: Cameras hold the largest market share, followed by lighting equipment.
- By Application: Automotive is the leading application segment, followed by electrical & electronics.
Drivers:
- Automotive: Stringent quality requirements, rising vehicle production.
- Electrical & Electronics: Growing demand for miniaturized components, quality control needs.
- North America & Europe: Advanced manufacturing capabilities, high automation adoption.
Surface Vision & Inspection Equipment Industry Product Developments
Recent innovations include high-resolution cameras with advanced image processing capabilities, AI-powered defect detection algorithms, and improved lighting solutions for enhanced visibility. These advancements provide manufacturers with enhanced accuracy, speed, and efficiency in their inspection processes, leading to reduced defects and improved productivity. The integration of robotics and automation technologies further expands the application scope of these systems.
Challenges in the Surface Vision & Inspection Equipment Industry Market
The industry faces challenges including the high initial investment cost of advanced equipment, the complexity of integrating these systems into existing production lines, and the need for skilled personnel to operate and maintain them. Supply chain disruptions and fluctuating raw material costs also pose significant challenges. Intense competition among established players and the emergence of new entrants further complicate the market dynamics.
Forces Driving Surface Vision & Inspection Equipment Industry Growth
Technological advancements such as AI and machine learning are key drivers, enabling more efficient and accurate inspection. Growing automation across industries is increasing demand for these solutions. Favorable government regulations supporting automation and industrial upgrading in several regions are also contributing factors.
Long-Term Growth Catalysts in the Surface Vision & Inspection Equipment Industry
Long-term growth hinges on continued innovation in areas such as AI, machine vision, and robotics. Strategic partnerships and mergers & acquisitions will reshape the market landscape. Expanding into emerging markets and developing customized solutions for niche applications will unlock further growth opportunities.
Emerging Opportunities in Surface Vision & Inspection Equipment Industry
The integration of IoT and cloud computing offers opportunities for real-time data analysis and predictive maintenance. The use of advanced materials and miniaturization trends will create demand for specialized inspection equipment. Emerging markets in Asia and other developing regions present significant growth opportunities.
Leading Players in the Surface Vision & Inspection Equipment Industry Sector
- Matrox Imaging Ltd
- Keyence Corporation
- Shenzhen Sipotek Technology Co Ltd
- Isra Vision AG
- Cognex Corporation
- Stemmer Imaging AG
- AMETEK Surface Vision
- Omron Corporation
- Comvis AG
- Daitron Inc
- Flexfilm Ltd
- Edmund Scientific Corporation
- Panasonic Corporation
Key Milestones in Surface Vision & Inspection Equipment Industry Industry
- 2020: Cognex Corporation launched its In-Sight 2800 vision system.
- 2021: Keyence Corporation introduced its new line of high-speed cameras.
- 2022: Matrox Imaging Ltd partnered with a major automotive supplier.
- 2023: Several key players announced investments in AI-powered inspection solutions.
Strategic Outlook for Surface Vision & Inspection Equipment Market
The future of the Surface Vision & Inspection Equipment market is bright, propelled by technological advancements and increasing industrial automation. Strategic focus on AI-powered solutions, expansion into new applications, and development of customized systems will be critical for success. The market is poised for significant growth, with the potential for significant returns for early adopters and strategic investors.
Surface Vision & Inspection Equipment Industry Segmentation
-
1. Component
- 1.1. Camera
- 1.2. Lighting Equipment
- 1.3. Optics
- 1.4. Other Components
-
2. Application
- 2.1. Automotive
- 2.2. Electrical & Electronics
- 2.3. Medical & Pharmaceuticals
- 2.4. Food & Beverages
- 2.5. Postal & Logistics
- 2.6. Other Applications
Surface Vision & Inspection Equipment Industry Segmentation By Geography
- 1. North America
- 2. Europe
- 3. Asia Pacific
- 4. Rest of the World
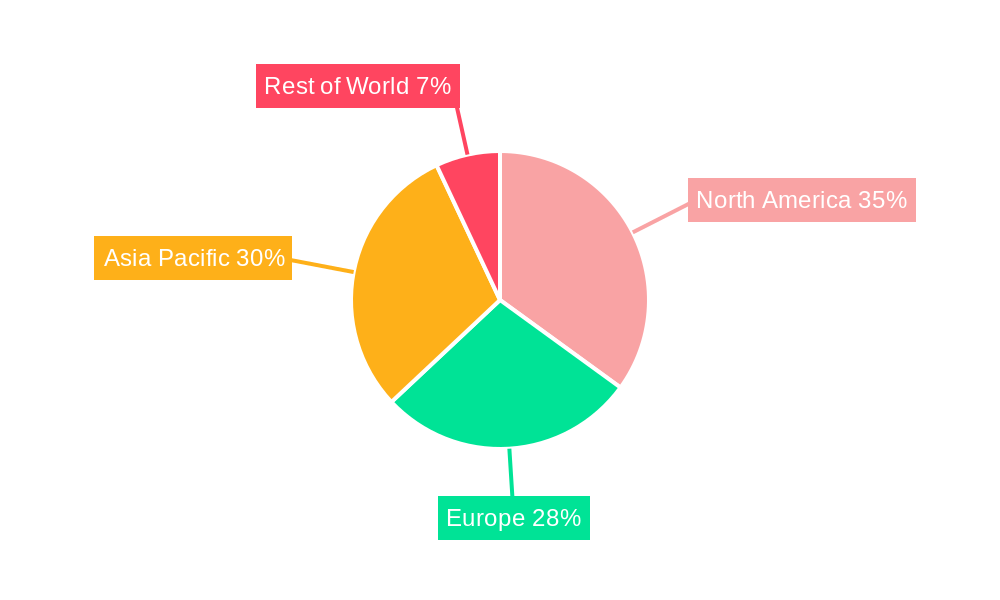
Surface Vision & Inspection Equipment Industry Regional Market Share
Geographic Coverage of Surface Vision & Inspection Equipment Industry
Surface Vision & Inspection Equipment Industry REPORT HIGHLIGHTS
| Aspects | Details |
|---|---|
| Study Period | 2020-2034 |
| Base Year | 2025 |
| Estimated Year | 2026 |
| Forecast Period | 2026-2034 |
| Historical Period | 2020-2025 |
| Growth Rate | CAGR of 14.56% from 2020-2034 |
| Segmentation |
|
Table of Contents
- 1. Introduction
- 1.1. Research Scope
- 1.2. Market Segmentation
- 1.3. Research Objective
- 1.4. Definitions and Assumptions
- 2. Executive Summary
- 2.1. Market Snapshot
- 3. Market Dynamics
- 3.1. Market Drivers
- 3.2. Market Restrains
- 3.3. Market Trends
- 3.4. Market Opportunities
- 4. Market Factor Analysis
- 4.1. Porters Five Forces
- 4.1.1. Bargaining Power of Suppliers
- 4.1.2. Bargaining Power of Buyers
- 4.1.3. Threat of New Entrants
- 4.1.4. Threat of Substitutes
- 4.1.5. Competitive Rivalry
- 4.2. PESTEL analysis
- 4.3. BCG Analysis
- 4.3.1. Stars (High Growth, High Market Share)
- 4.3.2. Cash Cows (Low Growth, High Market Share)
- 4.3.3. Question Mark (High Growth, Low Market Share)
- 4.3.4. Dogs (Low Growth, Low Market Share)
- 4.4. Ansoff Matrix Analysis
- 4.5. Supply Chain Analysis
- 4.6. Regulatory Landscape
- 4.7. Current Market Potential and Opportunity Assessment (TAM–SAM–SOM Framework)
- 4.8. MSR Analyst Note
- 4.1. Porters Five Forces
- 5. Market Analysis, Insights and Forecast 2021-2033
- 5.1. Market Analysis, Insights and Forecast - by Component
- 5.1.1. Camera
- 5.1.2. Lighting Equipment
- 5.1.3. Optics
- 5.1.4. Other Components
- 5.2. Market Analysis, Insights and Forecast - by Application
- 5.2.1. Automotive
- 5.2.2. Electrical & Electronics
- 5.2.3. Medical & Pharmaceuticals
- 5.2.4. Food & Beverages
- 5.2.5. Postal & Logistics
- 5.2.6. Other Applications
- 5.3. Market Analysis, Insights and Forecast - by Region
- 5.3.1. North America
- 5.3.2. Europe
- 5.3.3. Asia Pacific
- 5.3.4. Rest of the World
- 5.1. Market Analysis, Insights and Forecast - by Component
- 6. Global Surface Vision & Inspection Equipment Industry Analysis, Insights and Forecast, 2021-2033
- 6.1. Market Analysis, Insights and Forecast - by Component
- 6.1.1. Camera
- 6.1.2. Lighting Equipment
- 6.1.3. Optics
- 6.1.4. Other Components
- 6.2. Market Analysis, Insights and Forecast - by Application
- 6.2.1. Automotive
- 6.2.2. Electrical & Electronics
- 6.2.3. Medical & Pharmaceuticals
- 6.2.4. Food & Beverages
- 6.2.5. Postal & Logistics
- 6.2.6. Other Applications
- 6.1. Market Analysis, Insights and Forecast - by Component
- 7. North America Surface Vision & Inspection Equipment Industry Analysis, Insights and Forecast, 2020-2032
- 7.1. Market Analysis, Insights and Forecast - by Component
- 7.1.1. Camera
- 7.1.2. Lighting Equipment
- 7.1.3. Optics
- 7.1.4. Other Components
- 7.2. Market Analysis, Insights and Forecast - by Application
- 7.2.1. Automotive
- 7.2.2. Electrical & Electronics
- 7.2.3. Medical & Pharmaceuticals
- 7.2.4. Food & Beverages
- 7.2.5. Postal & Logistics
- 7.2.6. Other Applications
- 7.1. Market Analysis, Insights and Forecast - by Component
- 8. Europe Surface Vision & Inspection Equipment Industry Analysis, Insights and Forecast, 2020-2032
- 8.1. Market Analysis, Insights and Forecast - by Component
- 8.1.1. Camera
- 8.1.2. Lighting Equipment
- 8.1.3. Optics
- 8.1.4. Other Components
- 8.2. Market Analysis, Insights and Forecast - by Application
- 8.2.1. Automotive
- 8.2.2. Electrical & Electronics
- 8.2.3. Medical & Pharmaceuticals
- 8.2.4. Food & Beverages
- 8.2.5. Postal & Logistics
- 8.2.6. Other Applications
- 8.1. Market Analysis, Insights and Forecast - by Component
- 9. Asia Pacific Surface Vision & Inspection Equipment Industry Analysis, Insights and Forecast, 2020-2032
- 9.1. Market Analysis, Insights and Forecast - by Component
- 9.1.1. Camera
- 9.1.2. Lighting Equipment
- 9.1.3. Optics
- 9.1.4. Other Components
- 9.2. Market Analysis, Insights and Forecast - by Application
- 9.2.1. Automotive
- 9.2.2. Electrical & Electronics
- 9.2.3. Medical & Pharmaceuticals
- 9.2.4. Food & Beverages
- 9.2.5. Postal & Logistics
- 9.2.6. Other Applications
- 9.1. Market Analysis, Insights and Forecast - by Component
- 10. Rest of the World Surface Vision & Inspection Equipment Industry Analysis, Insights and Forecast, 2020-2032
- 10.1. Market Analysis, Insights and Forecast - by Component
- 10.1.1. Camera
- 10.1.2. Lighting Equipment
- 10.1.3. Optics
- 10.1.4. Other Components
- 10.2. Market Analysis, Insights and Forecast - by Application
- 10.2.1. Automotive
- 10.2.2. Electrical & Electronics
- 10.2.3. Medical & Pharmaceuticals
- 10.2.4. Food & Beverages
- 10.2.5. Postal & Logistics
- 10.2.6. Other Applications
- 10.1. Market Analysis, Insights and Forecast - by Component
- 11. Competitive Analysis
- 11.1. Company Profiles
- 11.1.1 Matrox Imaging Ltd
- 11.1.1.1. Company Overview
- 11.1.1.2. Products
- 11.1.1.3. Company Financials
- 11.1.1.4. SWOT Analysis
- 11.1.2 Keyence Corporation
- 11.1.2.1. Company Overview
- 11.1.2.2. Products
- 11.1.2.3. Company Financials
- 11.1.2.4. SWOT Analysis
- 11.1.3 Shenzhen Sipotek Technology Co Ltd
- 11.1.3.1. Company Overview
- 11.1.3.2. Products
- 11.1.3.3. Company Financials
- 11.1.3.4. SWOT Analysis
- 11.1.4 Isra Vision AG
- 11.1.4.1. Company Overview
- 11.1.4.2. Products
- 11.1.4.3. Company Financials
- 11.1.4.4. SWOT Analysis
- 11.1.5 Cognex Corporation
- 11.1.5.1. Company Overview
- 11.1.5.2. Products
- 11.1.5.3. Company Financials
- 11.1.5.4. SWOT Analysis
- 11.1.6 Stemmer Imaging AG
- 11.1.6.1. Company Overview
- 11.1.6.2. Products
- 11.1.6.3. Company Financials
- 11.1.6.4. SWOT Analysis
- 11.1.7 AMETEK Surface Vision
- 11.1.7.1. Company Overview
- 11.1.7.2. Products
- 11.1.7.3. Company Financials
- 11.1.7.4. SWOT Analysis
- 11.1.8 Omron Corporation
- 11.1.8.1. Company Overview
- 11.1.8.2. Products
- 11.1.8.3. Company Financials
- 11.1.8.4. SWOT Analysis
- 11.1.9 Comvis AG*List Not Exhaustive
- 11.1.9.1. Company Overview
- 11.1.9.2. Products
- 11.1.9.3. Company Financials
- 11.1.9.4. SWOT Analysis
- 11.1.10 Daitron Inc
- 11.1.10.1. Company Overview
- 11.1.10.2. Products
- 11.1.10.3. Company Financials
- 11.1.10.4. SWOT Analysis
- 11.1.11 Flexfilm Ltd
- 11.1.11.1. Company Overview
- 11.1.11.2. Products
- 11.1.11.3. Company Financials
- 11.1.11.4. SWOT Analysis
- 11.1.12 Edmund Scientific Corporation
- 11.1.12.1. Company Overview
- 11.1.12.2. Products
- 11.1.12.3. Company Financials
- 11.1.12.4. SWOT Analysis
- 11.1.13 Panasonic Corporation
- 11.1.13.1. Company Overview
- 11.1.13.2. Products
- 11.1.13.3. Company Financials
- 11.1.13.4. SWOT Analysis
- 11.1.1 Matrox Imaging Ltd
- 11.2. Market Entropy
- 11.2.1 Company's Key Areas Served
- 11.2.2 Recent Developments
- 11.3. Company Market Share Analysis 2025
- 11.3.1 Top 5 Companies Market Share Analysis
- 11.3.2 Top 3 Companies Market Share Analysis
- 11.4. List of Potential Customers
- 12. Research Methodology
List of Figures
- Figure 1: Global Surface Vision & Inspection Equipment Industry Revenue Breakdown (billion, %) by Region 2025 & 2033
- Figure 2: North America Surface Vision & Inspection Equipment Industry Revenue (billion), by Component 2025 & 2033
- Figure 3: North America Surface Vision & Inspection Equipment Industry Revenue Share (%), by Component 2025 & 2033
- Figure 4: North America Surface Vision & Inspection Equipment Industry Revenue (billion), by Application 2025 & 2033
- Figure 5: North America Surface Vision & Inspection Equipment Industry Revenue Share (%), by Application 2025 & 2033
- Figure 6: North America Surface Vision & Inspection Equipment Industry Revenue (billion), by Country 2025 & 2033
- Figure 7: North America Surface Vision & Inspection Equipment Industry Revenue Share (%), by Country 2025 & 2033
- Figure 8: Europe Surface Vision & Inspection Equipment Industry Revenue (billion), by Component 2025 & 2033
- Figure 9: Europe Surface Vision & Inspection Equipment Industry Revenue Share (%), by Component 2025 & 2033
- Figure 10: Europe Surface Vision & Inspection Equipment Industry Revenue (billion), by Application 2025 & 2033
- Figure 11: Europe Surface Vision & Inspection Equipment Industry Revenue Share (%), by Application 2025 & 2033
- Figure 12: Europe Surface Vision & Inspection Equipment Industry Revenue (billion), by Country 2025 & 2033
- Figure 13: Europe Surface Vision & Inspection Equipment Industry Revenue Share (%), by Country 2025 & 2033
- Figure 14: Asia Pacific Surface Vision & Inspection Equipment Industry Revenue (billion), by Component 2025 & 2033
- Figure 15: Asia Pacific Surface Vision & Inspection Equipment Industry Revenue Share (%), by Component 2025 & 2033
- Figure 16: Asia Pacific Surface Vision & Inspection Equipment Industry Revenue (billion), by Application 2025 & 2033
- Figure 17: Asia Pacific Surface Vision & Inspection Equipment Industry Revenue Share (%), by Application 2025 & 2033
- Figure 18: Asia Pacific Surface Vision & Inspection Equipment Industry Revenue (billion), by Country 2025 & 2033
- Figure 19: Asia Pacific Surface Vision & Inspection Equipment Industry Revenue Share (%), by Country 2025 & 2033
- Figure 20: Rest of the World Surface Vision & Inspection Equipment Industry Revenue (billion), by Component 2025 & 2033
- Figure 21: Rest of the World Surface Vision & Inspection Equipment Industry Revenue Share (%), by Component 2025 & 2033
- Figure 22: Rest of the World Surface Vision & Inspection Equipment Industry Revenue (billion), by Application 2025 & 2033
- Figure 23: Rest of the World Surface Vision & Inspection Equipment Industry Revenue Share (%), by Application 2025 & 2033
- Figure 24: Rest of the World Surface Vision & Inspection Equipment Industry Revenue (billion), by Country 2025 & 2033
- Figure 25: Rest of the World Surface Vision & Inspection Equipment Industry Revenue Share (%), by Country 2025 & 2033
List of Tables
- Table 1: Global Surface Vision & Inspection Equipment Industry Revenue billion Forecast, by Component 2020 & 2033
- Table 2: Global Surface Vision & Inspection Equipment Industry Revenue billion Forecast, by Application 2020 & 2033
- Table 3: Global Surface Vision & Inspection Equipment Industry Revenue billion Forecast, by Region 2020 & 2033
- Table 4: Global Surface Vision & Inspection Equipment Industry Revenue billion Forecast, by Component 2020 & 2033
- Table 5: Global Surface Vision & Inspection Equipment Industry Revenue billion Forecast, by Application 2020 & 2033
- Table 6: Global Surface Vision & Inspection Equipment Industry Revenue billion Forecast, by Country 2020 & 2033
- Table 7: Global Surface Vision & Inspection Equipment Industry Revenue billion Forecast, by Component 2020 & 2033
- Table 8: Global Surface Vision & Inspection Equipment Industry Revenue billion Forecast, by Application 2020 & 2033
- Table 9: Global Surface Vision & Inspection Equipment Industry Revenue billion Forecast, by Country 2020 & 2033
- Table 10: Global Surface Vision & Inspection Equipment Industry Revenue billion Forecast, by Component 2020 & 2033
- Table 11: Global Surface Vision & Inspection Equipment Industry Revenue billion Forecast, by Application 2020 & 2033
- Table 12: Global Surface Vision & Inspection Equipment Industry Revenue billion Forecast, by Country 2020 & 2033
- Table 13: Global Surface Vision & Inspection Equipment Industry Revenue billion Forecast, by Component 2020 & 2033
- Table 14: Global Surface Vision & Inspection Equipment Industry Revenue billion Forecast, by Application 2020 & 2033
- Table 15: Global Surface Vision & Inspection Equipment Industry Revenue billion Forecast, by Country 2020 & 2033
Frequently Asked Questions
1. What is the projected Compound Annual Growth Rate (CAGR) of the Surface Vision & Inspection Equipment Industry?
The projected CAGR is approximately 14.56%.
2. Which companies are prominent players in the Surface Vision & Inspection Equipment Industry?
Key companies in the market include Matrox Imaging Ltd, Keyence Corporation, Shenzhen Sipotek Technology Co Ltd, Isra Vision AG, Cognex Corporation, Stemmer Imaging AG, AMETEK Surface Vision, Omron Corporation, Comvis AG*List Not Exhaustive, Daitron Inc, Flexfilm Ltd, Edmund Scientific Corporation, Panasonic Corporation.
3. What are the main segments of the Surface Vision & Inspection Equipment Industry?
The market segments include Component, Application.
4. Can you provide details about the market size?
The market size is estimated to be USD 14.86 billion as of 2022.
5. What are some drivers contributing to market growth?
; Increasing Need for Better Manufacturing Production Capacity at Reduced Cost; Growing Demand for Qualitative Products; Increasing Adoption of Industrial 4.0 and IoT.
6. What are the notable trends driving market growth?
Camera Segment is expected to Hold the Largest Market Size during the Forecast Period.
7. Are there any restraints impacting market growth?
; Lack of Skilled Labor.
8. Can you provide examples of recent developments in the market?
N/A
9. What pricing options are available for accessing the report?
Pricing options include single-user, multi-user, and enterprise licenses priced at USD 4750, USD 5250, and USD 8750 respectively.
10. Is the market size provided in terms of value or volume?
The market size is provided in terms of value, measured in billion.
11. Are there any specific market keywords associated with the report?
Yes, the market keyword associated with the report is "Surface Vision & Inspection Equipment Industry," which aids in identifying and referencing the specific market segment covered.
12. How do I determine which pricing option suits my needs best?
The pricing options vary based on user requirements and access needs. Individual users may opt for single-user licenses, while businesses requiring broader access may choose multi-user or enterprise licenses for cost-effective access to the report.
13. Are there any additional resources or data provided in the Surface Vision & Inspection Equipment Industry report?
While the report offers comprehensive insights, it's advisable to review the specific contents or supplementary materials provided to ascertain if additional resources or data are available.
14. How can I stay updated on further developments or reports in the Surface Vision & Inspection Equipment Industry?
To stay informed about further developments, trends, and reports in the Surface Vision & Inspection Equipment Industry, consider subscribing to industry newsletters, following relevant companies and organizations, or regularly checking reputable industry news sources and publications.
Methodology
Step 1 - Identification of Relevant Samples Size from Population Database


Step 2 - Approaches for Defining Global Market Size (Value, Volume* & Price*)

Note*: In applicable scenarios
Step 3 - Data Sources
Primary Research
- Web Analytics
- Survey Reports
- Research Institute
- Latest Research Reports
- Opinion Leaders
Secondary Research
- Annual Reports
- White Paper
- Latest Press Release
- Industry Association
- Paid Database
- Investor Presentations

Step 4 - Data Triangulation
Involves using different sources of information in order to increase the validity of a study
These sources are likely to be stakeholders in a program - participants, other researchers, program staff, other community members, and so on.
Then we put all data in single framework & apply various statistical tools to find out the dynamic on the market.
During the analysis stage, feedback from the stakeholder groups would be compared to determine areas of agreement as well as areas of divergence