

Key Insights
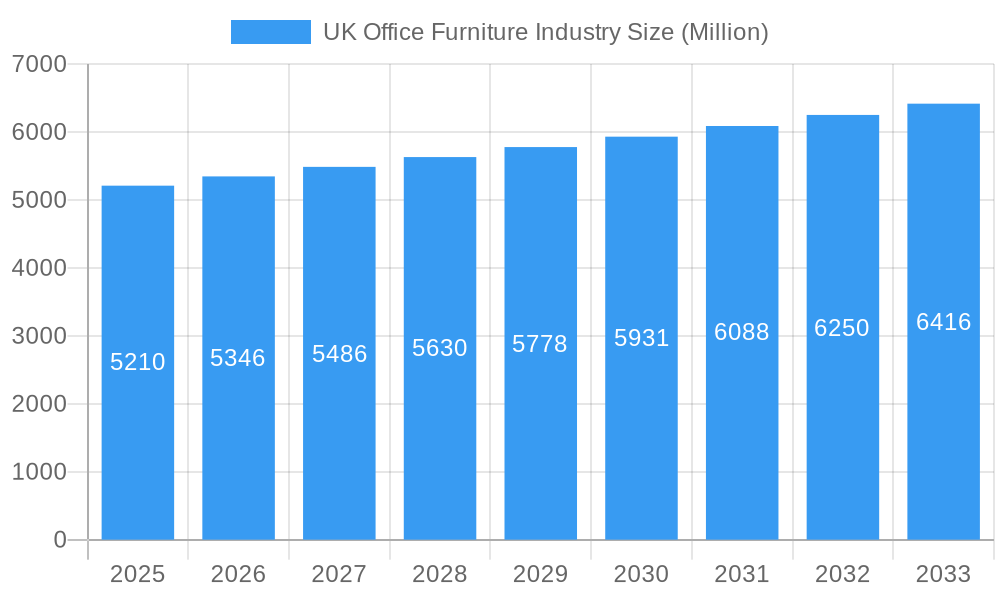
The UK office furniture market, valued at £5.21 billion in 2025, is projected to experience steady growth, driven by a Compound Annual Growth Rate (CAGR) of 2.78% from 2025 to 2033. This growth is fueled by several key factors. The increasing number of startups and small businesses, coupled with a rising demand for flexible and ergonomic workspace solutions, are significant drivers. Furthermore, a continued focus on improving employee well-being and productivity is pushing businesses to invest in high-quality, comfortable office furniture. The shift towards hybrid work models also presents a unique opportunity, with companies seeking to optimize both in-office and remote work environments. Growth within specific segments, such as ergonomic chairs and adjustable desks, is expected to outpace the overall market average. The popularity of online retail channels and the rise of e-commerce platforms are also transforming the distribution landscape, making it easier for businesses of all sizes to access a wider range of products. However, potential restraints include economic fluctuations impacting business investment and supply chain disruptions potentially affecting availability and pricing.
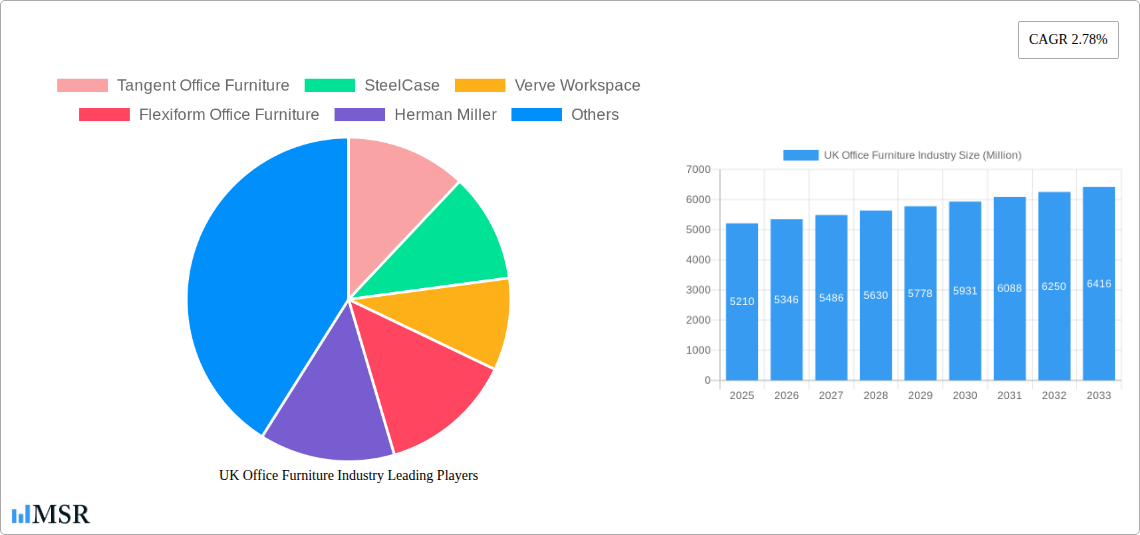
UK Office Furniture Industry Market Size (In Billion)
Despite these challenges, the market's positive trajectory is expected to continue. The ongoing trend towards creating more modern and employee-centric workplaces will necessitate substantial investment in office furniture upgrades and replacements. The expansion of co-working spaces and the development of innovative workspace designs further contribute to the sustained demand. Major players in the market, including SteelCase, Herman Miller, and Knoll, are expected to benefit from this growth, leveraging their established brands and expertise to cater to evolving customer needs. Regional variations are likely, with larger metropolitan areas exhibiting higher growth rates due to concentrated business activity. The focus on sustainability and environmentally friendly materials is also shaping procurement decisions, influencing product development and influencing market segmentation.
UK Office Furniture Industry Company Market Share
UK Office Furniture Industry: A Comprehensive Market Report (2019-2033)
This in-depth report provides a comprehensive analysis of the UK office furniture market, encompassing market dynamics, key segments, leading players, and future growth opportunities. The study period covers 2019-2033, with a base year of 2025 and a forecast period of 2025-2033. The report is essential for industry stakeholders, investors, and businesses seeking to understand and navigate this dynamic market. The £XX million market is poised for significant transformation, driven by technological advancements and evolving workplace trends.
UK Office Furniture Industry Market Concentration & Dynamics
This section analyzes the competitive landscape, innovation drivers, regulatory influences, and market trends shaping the UK office furniture industry. The market is moderately concentrated, with several major players holding significant market share. However, the presence of numerous smaller companies fosters a competitive environment.
- Market Concentration: The top five players hold an estimated xx% market share, indicating a moderately concentrated market. Smaller companies, including niche players and regional businesses, account for the remaining xx%.
- Innovation Ecosystems: Collaboration between furniture manufacturers and design firms is a key driver of innovation, as evidenced by the Herman Miller and Studio 7.5 partnership. Investment in ergonomics and sustainable materials is also gaining traction.
- Regulatory Frameworks: Regulations concerning workplace safety and environmental sustainability influence material sourcing and product design within the industry. Compliance with these standards is crucial for market participation.
- Substitute Products: The market faces competition from alternative workspace solutions, including co-working spaces and remote working setups. This trend necessitates innovation and diversification for established players.
- End-User Trends: The shift towards hybrid work models and flexible office designs is impacting demand for adaptable and ergonomic furniture. This is leading to the growth of modular and customizable solutions.
- M&A Activities: The acquisition of Halcon by Steelcase in 2022, valued at USD 127.5 million, highlights the strategic consolidation within the industry. The number of M&A deals in the historical period (2019-2024) is estimated at xx.
UK Office Furniture Industry Industry Insights & Trends
This section delves into the market's growth trajectory, technological disruptions, and evolving consumer preferences. The UK office furniture market is projected to experience substantial growth during the forecast period.
The UK office furniture market size in 2025 is estimated at £XX million, exhibiting a Compound Annual Growth Rate (CAGR) of xx% from 2025 to 2033. Several factors contribute to this growth:
- Economic Growth: Overall economic performance, particularly within the commercial sector, significantly influences investment in office infrastructure and furniture.
- Technological Disruptions: The adoption of smart office technologies, such as adjustable desks and integrated power solutions, creates new market opportunities.
- Evolving Consumer Behaviors: The increasing demand for ergonomic, sustainable, and aesthetically pleasing office furniture drives product innovation and differentiation. The rising popularity of hybrid work models is also influencing demand for adaptable office furniture.
Key Markets & Segments Leading UK Office Furniture Industry
This section identifies the dominant segments within the UK office furniture market.
Dominant Segments:
- Type: Desks and seating represent the largest segments, driven by their essential role in any office environment. The demand for ergonomic seating is particularly strong, reflecting the increased awareness of workplace well-being. The "Others" category includes specialized furniture items experiencing niche growth.
- Distribution Channels: Online stores are experiencing growth, while flagship stores and specialty stores still play a crucial role, especially for high-end and customized products. Home centers cater to a broader market, including smaller businesses and home office setups.
Growth Drivers:
- Economic expansion: A robust economy generally boosts investments in office infrastructure, resulting in increased demand for office furniture.
- Infrastructure development: New commercial constructions and office renovations stimulate demand for new furniture.
- Government initiatives: Policies promoting sustainable or ergonomic workplaces can impact market demand.
UK Office Furniture Industry Product Developments
Product innovation is a key competitive differentiator, encompassing ergonomic designs, smart functionalities, and sustainable materials. Technological advancements are creating opportunities for adjustable desks, smart seating, and integrated power solutions. Companies are emphasizing sustainable materials and eco-friendly manufacturing processes, appealing to environmentally conscious buyers.
Challenges in the UK Office Furniture Industry Market
The UK office furniture market faces several challenges including:
- Supply chain disruptions: Global supply chain issues can lead to material shortages and increased costs.
- Economic downturns: Recessions can significantly impact demand for non-essential office furniture.
- Intense competition: The presence of numerous players creates a competitive environment, necessitating continuous innovation and differentiation.
Forces Driving UK Office Furniture Industry Growth
Key growth drivers include:
- Technological advancements: Smart furniture, ergonomic designs, and sustainable materials are attracting significant interest.
- Economic growth: Improved economic conditions typically increase demand for office furniture.
- Government regulations: Regulations promoting workplace safety and sustainability encourage investments in compliant furniture.
Long-Term Growth Catalysts in the UK Office Furniture Industry
Long-term growth is fueled by continued innovation, strategic partnerships, and potential market expansions. The development of new technologies and materials, such as bio-based plastics and recycled materials, presents opportunities for sustainable product development. Strategic collaborations between manufacturers and designers will drive new product development, and expansion into niche markets could unlock further growth.
Emerging Opportunities in UK Office Furniture Industry
Emerging opportunities include:
- Sustainable furniture: The growing demand for eco-friendly products presents significant opportunities for manufacturers using recycled materials and sustainable manufacturing processes.
- Smart office technology: Integration of technology into furniture, such as adjustable height desks and integrated power, is gaining traction.
- Modular and customizable furniture: Flexibility in the workplace is driving demand for adaptable and customizable furniture solutions.
Leading Players in the UK Office Furniture Industry Sector
- Tangent Office Furniture
- SteelCase
- Verve Workspace
- Flexiform Office Furniture
- Herman Miller
- Verco Office Furniture
- Lee & Plumpton
- The Frem Group
- Margolis Furniture
- Knoll
- Metric Office Furniture
- HumanScale
- Urban Office
Key Milestones in UK Office Furniture Industry Industry
- May 2022: Steelcase Inc. acquired Halcon for USD 127.5 million, expanding its product portfolio in tailored wood furniture.
- 2022: Herman Miller launched the Zeph Chair, a collaboration with Studio 7.5, focusing on ergonomic design and modern aesthetics.
- Q1 2022: Steelcase Inc. reported USD 740.7 million in revenue, a net loss of USD 11.4 million, and an adjusted loss per share of USD 0.05.
Strategic Outlook for UK Office Furniture Industry Market
The UK office furniture market presents significant growth potential, driven by technological advancements, evolving workplace trends, and increasing demand for sustainable and ergonomic solutions. Companies that invest in innovation, sustainable practices, and strategic partnerships are well-positioned to capitalize on emerging opportunities and achieve long-term success within this dynamic sector.
UK Office Furniture Industry Segmentation
-
1. Type
- 1.1. Seating
- 1.2. Tables
- 1.3. Storage
- 1.4. Other Office Furniture
-
2. Distribution Channel
- 2.1. Home Centers
- 2.2. Flagship Stores
- 2.3. Specialty Stores
- 2.4. Online Stores
- 2.5. Other Distribution Channels
UK Office Furniture Industry Segmentation By Geography
-
1. North America
- 1.1. United States
- 1.2. Canada
- 1.3. Mexico
-
2. South America
- 2.1. Brazil
- 2.2. Argentina
- 2.3. Rest of South America
-
3. Europe
- 3.1. United Kingdom
- 3.2. Germany
- 3.3. France
- 3.4. Italy
- 3.5. Spain
- 3.6. Russia
- 3.7. Benelux
- 3.8. Nordics
- 3.9. Rest of Europe
-
4. Middle East & Africa
- 4.1. Turkey
- 4.2. Israel
- 4.3. GCC
- 4.4. North Africa
- 4.5. South Africa
- 4.6. Rest of Middle East & Africa
-
5. Asia Pacific
- 5.1. China
- 5.2. India
- 5.3. Japan
- 5.4. South Korea
- 5.5. ASEAN
- 5.6. Oceania
- 5.7. Rest of Asia Pacific
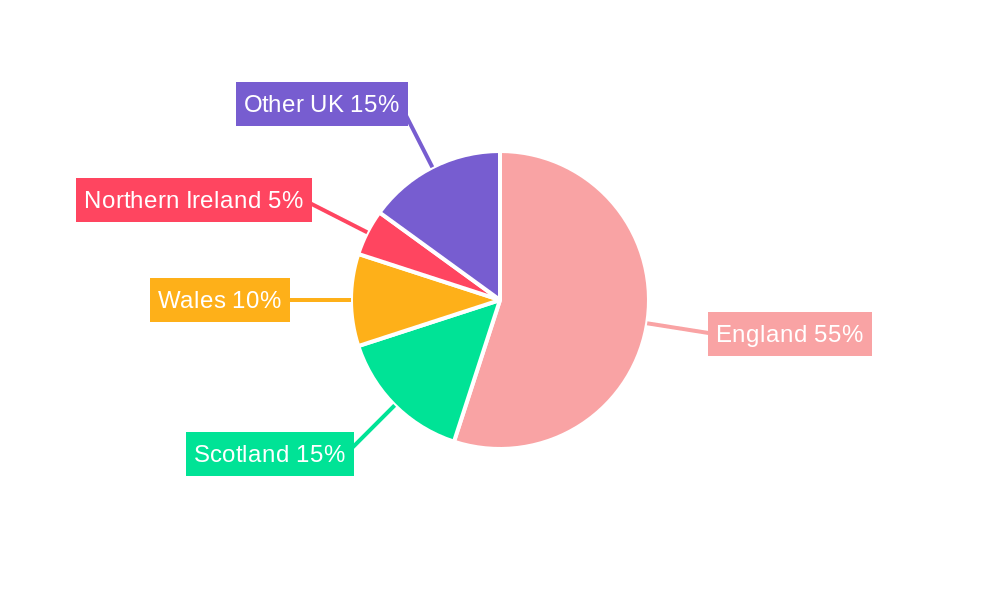
UK Office Furniture Industry Regional Market Share
Geographic Coverage of UK Office Furniture Industry
UK Office Furniture Industry REPORT HIGHLIGHTS
| Aspects | Details |
|---|---|
| Study Period | 2020-2034 |
| Base Year | 2025 |
| Estimated Year | 2026 |
| Forecast Period | 2026-2034 |
| Historical Period | 2020-2025 |
| Growth Rate | CAGR of 2.78% from 2020-2034 |
| Segmentation |
|
Table of Contents
- 1. Introduction
- 1.1. Research Scope
- 1.2. Market Segmentation
- 1.3. Research Objective
- 1.4. Definitions and Assumptions
- 2. Executive Summary
- 2.1. Market Snapshot
- 3. Market Dynamics
- 3.1. Market Drivers
- 3.2. Market Restrains
- 3.3. Market Trends
- 3.4. Market Opportunities
- 4. Market Factor Analysis
- 4.1. Porters Five Forces
- 4.1.1. Bargaining Power of Suppliers
- 4.1.2. Bargaining Power of Buyers
- 4.1.3. Threat of New Entrants
- 4.1.4. Threat of Substitutes
- 4.1.5. Competitive Rivalry
- 4.2. PESTEL analysis
- 4.3. BCG Analysis
- 4.3.1. Stars (High Growth, High Market Share)
- 4.3.2. Cash Cows (Low Growth, High Market Share)
- 4.3.3. Question Mark (High Growth, Low Market Share)
- 4.3.4. Dogs (Low Growth, Low Market Share)
- 4.4. Ansoff Matrix Analysis
- 4.5. Supply Chain Analysis
- 4.6. Regulatory Landscape
- 4.7. Current Market Potential and Opportunity Assessment (TAM–SAM–SOM Framework)
- 4.8. MSR Analyst Note
- 4.1. Porters Five Forces
- 5. Market Analysis, Insights and Forecast 2021-2033
- 5.1. Market Analysis, Insights and Forecast - by Type
- 5.1.1. Seating
- 5.1.2. Tables
- 5.1.3. Storage
- 5.1.4. Other Office Furniture
- 5.2. Market Analysis, Insights and Forecast - by Distribution Channel
- 5.2.1. Home Centers
- 5.2.2. Flagship Stores
- 5.2.3. Specialty Stores
- 5.2.4. Online Stores
- 5.2.5. Other Distribution Channels
- 5.3. Market Analysis, Insights and Forecast - by Region
- 5.3.1. North America
- 5.3.2. South America
- 5.3.3. Europe
- 5.3.4. Middle East & Africa
- 5.3.5. Asia Pacific
- 5.1. Market Analysis, Insights and Forecast - by Type
- 6. Global UK Office Furniture Industry Analysis, Insights and Forecast, 2021-2033
- 6.1. Market Analysis, Insights and Forecast - by Type
- 6.1.1. Seating
- 6.1.2. Tables
- 6.1.3. Storage
- 6.1.4. Other Office Furniture
- 6.2. Market Analysis, Insights and Forecast - by Distribution Channel
- 6.2.1. Home Centers
- 6.2.2. Flagship Stores
- 6.2.3. Specialty Stores
- 6.2.4. Online Stores
- 6.2.5. Other Distribution Channels
- 6.1. Market Analysis, Insights and Forecast - by Type
- 7. North America UK Office Furniture Industry Analysis, Insights and Forecast, 2020-2032
- 7.1. Market Analysis, Insights and Forecast - by Type
- 7.1.1. Seating
- 7.1.2. Tables
- 7.1.3. Storage
- 7.1.4. Other Office Furniture
- 7.2. Market Analysis, Insights and Forecast - by Distribution Channel
- 7.2.1. Home Centers
- 7.2.2. Flagship Stores
- 7.2.3. Specialty Stores
- 7.2.4. Online Stores
- 7.2.5. Other Distribution Channels
- 7.1. Market Analysis, Insights and Forecast - by Type
- 8. South America UK Office Furniture Industry Analysis, Insights and Forecast, 2020-2032
- 8.1. Market Analysis, Insights and Forecast - by Type
- 8.1.1. Seating
- 8.1.2. Tables
- 8.1.3. Storage
- 8.1.4. Other Office Furniture
- 8.2. Market Analysis, Insights and Forecast - by Distribution Channel
- 8.2.1. Home Centers
- 8.2.2. Flagship Stores
- 8.2.3. Specialty Stores
- 8.2.4. Online Stores
- 8.2.5. Other Distribution Channels
- 8.1. Market Analysis, Insights and Forecast - by Type
- 9. Europe UK Office Furniture Industry Analysis, Insights and Forecast, 2020-2032
- 9.1. Market Analysis, Insights and Forecast - by Type
- 9.1.1. Seating
- 9.1.2. Tables
- 9.1.3. Storage
- 9.1.4. Other Office Furniture
- 9.2. Market Analysis, Insights and Forecast - by Distribution Channel
- 9.2.1. Home Centers
- 9.2.2. Flagship Stores
- 9.2.3. Specialty Stores
- 9.2.4. Online Stores
- 9.2.5. Other Distribution Channels
- 9.1. Market Analysis, Insights and Forecast - by Type
- 10. Middle East & Africa UK Office Furniture Industry Analysis, Insights and Forecast, 2020-2032
- 10.1. Market Analysis, Insights and Forecast - by Type
- 10.1.1. Seating
- 10.1.2. Tables
- 10.1.3. Storage
- 10.1.4. Other Office Furniture
- 10.2. Market Analysis, Insights and Forecast - by Distribution Channel
- 10.2.1. Home Centers
- 10.2.2. Flagship Stores
- 10.2.3. Specialty Stores
- 10.2.4. Online Stores
- 10.2.5. Other Distribution Channels
- 10.1. Market Analysis, Insights and Forecast - by Type
- 11. Asia Pacific UK Office Furniture Industry Analysis, Insights and Forecast, 2020-2032
- 11.1. Market Analysis, Insights and Forecast - by Type
- 11.1.1. Seating
- 11.1.2. Tables
- 11.1.3. Storage
- 11.1.4. Other Office Furniture
- 11.2. Market Analysis, Insights and Forecast - by Distribution Channel
- 11.2.1. Home Centers
- 11.2.2. Flagship Stores
- 11.2.3. Specialty Stores
- 11.2.4. Online Stores
- 11.2.5. Other Distribution Channels
- 11.1. Market Analysis, Insights and Forecast - by Type
- 12. Competitive Analysis
- 12.1. Company Profiles
- 12.1.1 Tangent Office Furniture
- 12.1.1.1. Company Overview
- 12.1.1.2. Products
- 12.1.1.3. Company Financials
- 12.1.1.4. SWOT Analysis
- 12.1.2 SteelCase
- 12.1.2.1. Company Overview
- 12.1.2.2. Products
- 12.1.2.3. Company Financials
- 12.1.2.4. SWOT Analysis
- 12.1.3 Verve Workspace
- 12.1.3.1. Company Overview
- 12.1.3.2. Products
- 12.1.3.3. Company Financials
- 12.1.3.4. SWOT Analysis
- 12.1.4 Flexiform Office Furniture
- 12.1.4.1. Company Overview
- 12.1.4.2. Products
- 12.1.4.3. Company Financials
- 12.1.4.4. SWOT Analysis
- 12.1.5 Herman Miller
- 12.1.5.1. Company Overview
- 12.1.5.2. Products
- 12.1.5.3. Company Financials
- 12.1.5.4. SWOT Analysis
- 12.1.6 Verco Office Furniture
- 12.1.6.1. Company Overview
- 12.1.6.2. Products
- 12.1.6.3. Company Financials
- 12.1.6.4. SWOT Analysis
- 12.1.7 Lee & Plumpton
- 12.1.7.1. Company Overview
- 12.1.7.2. Products
- 12.1.7.3. Company Financials
- 12.1.7.4. SWOT Analysis
- 12.1.8 The Frem Group
- 12.1.8.1. Company Overview
- 12.1.8.2. Products
- 12.1.8.3. Company Financials
- 12.1.8.4. SWOT Analysis
- 12.1.9 Margolis Furniture
- 12.1.9.1. Company Overview
- 12.1.9.2. Products
- 12.1.9.3. Company Financials
- 12.1.9.4. SWOT Analysis
- 12.1.10 Knoll
- 12.1.10.1. Company Overview
- 12.1.10.2. Products
- 12.1.10.3. Company Financials
- 12.1.10.4. SWOT Analysis
- 12.1.11 Metric Office Furniture
- 12.1.11.1. Company Overview
- 12.1.11.2. Products
- 12.1.11.3. Company Financials
- 12.1.11.4. SWOT Analysis
- 12.1.12 HumanScale
- 12.1.12.1. Company Overview
- 12.1.12.2. Products
- 12.1.12.3. Company Financials
- 12.1.12.4. SWOT Analysis
- 12.1.13 Urban Office
- 12.1.13.1. Company Overview
- 12.1.13.2. Products
- 12.1.13.3. Company Financials
- 12.1.13.4. SWOT Analysis
- 12.1.1 Tangent Office Furniture
- 12.2. Market Entropy
- 12.2.1 Company's Key Areas Served
- 12.2.2 Recent Developments
- 12.3. Company Market Share Analysis 2025
- 12.3.1 Top 5 Companies Market Share Analysis
- 12.3.2 Top 3 Companies Market Share Analysis
- 12.4. List of Potential Customers
- 13. Research Methodology
List of Figures
- Figure 1: Global UK Office Furniture Industry Revenue Breakdown (Million, %) by Region 2025 & 2033
- Figure 2: Global UK Office Furniture Industry Volume Breakdown (K Unit, %) by Region 2025 & 2033
- Figure 3: North America UK Office Furniture Industry Revenue (Million), by Type 2025 & 2033
- Figure 4: North America UK Office Furniture Industry Volume (K Unit), by Type 2025 & 2033
- Figure 5: North America UK Office Furniture Industry Revenue Share (%), by Type 2025 & 2033
- Figure 6: North America UK Office Furniture Industry Volume Share (%), by Type 2025 & 2033
- Figure 7: North America UK Office Furniture Industry Revenue (Million), by Distribution Channel 2025 & 2033
- Figure 8: North America UK Office Furniture Industry Volume (K Unit), by Distribution Channel 2025 & 2033
- Figure 9: North America UK Office Furniture Industry Revenue Share (%), by Distribution Channel 2025 & 2033
- Figure 10: North America UK Office Furniture Industry Volume Share (%), by Distribution Channel 2025 & 2033
- Figure 11: North America UK Office Furniture Industry Revenue (Million), by Country 2025 & 2033
- Figure 12: North America UK Office Furniture Industry Volume (K Unit), by Country 2025 & 2033
- Figure 13: North America UK Office Furniture Industry Revenue Share (%), by Country 2025 & 2033
- Figure 14: North America UK Office Furniture Industry Volume Share (%), by Country 2025 & 2033
- Figure 15: South America UK Office Furniture Industry Revenue (Million), by Type 2025 & 2033
- Figure 16: South America UK Office Furniture Industry Volume (K Unit), by Type 2025 & 2033
- Figure 17: South America UK Office Furniture Industry Revenue Share (%), by Type 2025 & 2033
- Figure 18: South America UK Office Furniture Industry Volume Share (%), by Type 2025 & 2033
- Figure 19: South America UK Office Furniture Industry Revenue (Million), by Distribution Channel 2025 & 2033
- Figure 20: South America UK Office Furniture Industry Volume (K Unit), by Distribution Channel 2025 & 2033
- Figure 21: South America UK Office Furniture Industry Revenue Share (%), by Distribution Channel 2025 & 2033
- Figure 22: South America UK Office Furniture Industry Volume Share (%), by Distribution Channel 2025 & 2033
- Figure 23: South America UK Office Furniture Industry Revenue (Million), by Country 2025 & 2033
- Figure 24: South America UK Office Furniture Industry Volume (K Unit), by Country 2025 & 2033
- Figure 25: South America UK Office Furniture Industry Revenue Share (%), by Country 2025 & 2033
- Figure 26: South America UK Office Furniture Industry Volume Share (%), by Country 2025 & 2033
- Figure 27: Europe UK Office Furniture Industry Revenue (Million), by Type 2025 & 2033
- Figure 28: Europe UK Office Furniture Industry Volume (K Unit), by Type 2025 & 2033
- Figure 29: Europe UK Office Furniture Industry Revenue Share (%), by Type 2025 & 2033
- Figure 30: Europe UK Office Furniture Industry Volume Share (%), by Type 2025 & 2033
- Figure 31: Europe UK Office Furniture Industry Revenue (Million), by Distribution Channel 2025 & 2033
- Figure 32: Europe UK Office Furniture Industry Volume (K Unit), by Distribution Channel 2025 & 2033
- Figure 33: Europe UK Office Furniture Industry Revenue Share (%), by Distribution Channel 2025 & 2033
- Figure 34: Europe UK Office Furniture Industry Volume Share (%), by Distribution Channel 2025 & 2033
- Figure 35: Europe UK Office Furniture Industry Revenue (Million), by Country 2025 & 2033
- Figure 36: Europe UK Office Furniture Industry Volume (K Unit), by Country 2025 & 2033
- Figure 37: Europe UK Office Furniture Industry Revenue Share (%), by Country 2025 & 2033
- Figure 38: Europe UK Office Furniture Industry Volume Share (%), by Country 2025 & 2033
- Figure 39: Middle East & Africa UK Office Furniture Industry Revenue (Million), by Type 2025 & 2033
- Figure 40: Middle East & Africa UK Office Furniture Industry Volume (K Unit), by Type 2025 & 2033
- Figure 41: Middle East & Africa UK Office Furniture Industry Revenue Share (%), by Type 2025 & 2033
- Figure 42: Middle East & Africa UK Office Furniture Industry Volume Share (%), by Type 2025 & 2033
- Figure 43: Middle East & Africa UK Office Furniture Industry Revenue (Million), by Distribution Channel 2025 & 2033
- Figure 44: Middle East & Africa UK Office Furniture Industry Volume (K Unit), by Distribution Channel 2025 & 2033
- Figure 45: Middle East & Africa UK Office Furniture Industry Revenue Share (%), by Distribution Channel 2025 & 2033
- Figure 46: Middle East & Africa UK Office Furniture Industry Volume Share (%), by Distribution Channel 2025 & 2033
- Figure 47: Middle East & Africa UK Office Furniture Industry Revenue (Million), by Country 2025 & 2033
- Figure 48: Middle East & Africa UK Office Furniture Industry Volume (K Unit), by Country 2025 & 2033
- Figure 49: Middle East & Africa UK Office Furniture Industry Revenue Share (%), by Country 2025 & 2033
- Figure 50: Middle East & Africa UK Office Furniture Industry Volume Share (%), by Country 2025 & 2033
- Figure 51: Asia Pacific UK Office Furniture Industry Revenue (Million), by Type 2025 & 2033
- Figure 52: Asia Pacific UK Office Furniture Industry Volume (K Unit), by Type 2025 & 2033
- Figure 53: Asia Pacific UK Office Furniture Industry Revenue Share (%), by Type 2025 & 2033
- Figure 54: Asia Pacific UK Office Furniture Industry Volume Share (%), by Type 2025 & 2033
- Figure 55: Asia Pacific UK Office Furniture Industry Revenue (Million), by Distribution Channel 2025 & 2033
- Figure 56: Asia Pacific UK Office Furniture Industry Volume (K Unit), by Distribution Channel 2025 & 2033
- Figure 57: Asia Pacific UK Office Furniture Industry Revenue Share (%), by Distribution Channel 2025 & 2033
- Figure 58: Asia Pacific UK Office Furniture Industry Volume Share (%), by Distribution Channel 2025 & 2033
- Figure 59: Asia Pacific UK Office Furniture Industry Revenue (Million), by Country 2025 & 2033
- Figure 60: Asia Pacific UK Office Furniture Industry Volume (K Unit), by Country 2025 & 2033
- Figure 61: Asia Pacific UK Office Furniture Industry Revenue Share (%), by Country 2025 & 2033
- Figure 62: Asia Pacific UK Office Furniture Industry Volume Share (%), by Country 2025 & 2033
List of Tables
- Table 1: Global UK Office Furniture Industry Revenue Million Forecast, by Type 2020 & 2033
- Table 2: Global UK Office Furniture Industry Volume K Unit Forecast, by Type 2020 & 2033
- Table 3: Global UK Office Furniture Industry Revenue Million Forecast, by Distribution Channel 2020 & 2033
- Table 4: Global UK Office Furniture Industry Volume K Unit Forecast, by Distribution Channel 2020 & 2033
- Table 5: Global UK Office Furniture Industry Revenue Million Forecast, by Region 2020 & 2033
- Table 6: Global UK Office Furniture Industry Volume K Unit Forecast, by Region 2020 & 2033
- Table 7: Global UK Office Furniture Industry Revenue Million Forecast, by Type 2020 & 2033
- Table 8: Global UK Office Furniture Industry Volume K Unit Forecast, by Type 2020 & 2033
- Table 9: Global UK Office Furniture Industry Revenue Million Forecast, by Distribution Channel 2020 & 2033
- Table 10: Global UK Office Furniture Industry Volume K Unit Forecast, by Distribution Channel 2020 & 2033
- Table 11: Global UK Office Furniture Industry Revenue Million Forecast, by Country 2020 & 2033
- Table 12: Global UK Office Furniture Industry Volume K Unit Forecast, by Country 2020 & 2033
- Table 13: United States UK Office Furniture Industry Revenue (Million) Forecast, by Application 2020 & 2033
- Table 14: United States UK Office Furniture Industry Volume (K Unit) Forecast, by Application 2020 & 2033
- Table 15: Canada UK Office Furniture Industry Revenue (Million) Forecast, by Application 2020 & 2033
- Table 16: Canada UK Office Furniture Industry Volume (K Unit) Forecast, by Application 2020 & 2033
- Table 17: Mexico UK Office Furniture Industry Revenue (Million) Forecast, by Application 2020 & 2033
- Table 18: Mexico UK Office Furniture Industry Volume (K Unit) Forecast, by Application 2020 & 2033
- Table 19: Global UK Office Furniture Industry Revenue Million Forecast, by Type 2020 & 2033
- Table 20: Global UK Office Furniture Industry Volume K Unit Forecast, by Type 2020 & 2033
- Table 21: Global UK Office Furniture Industry Revenue Million Forecast, by Distribution Channel 2020 & 2033
- Table 22: Global UK Office Furniture Industry Volume K Unit Forecast, by Distribution Channel 2020 & 2033
- Table 23: Global UK Office Furniture Industry Revenue Million Forecast, by Country 2020 & 2033
- Table 24: Global UK Office Furniture Industry Volume K Unit Forecast, by Country 2020 & 2033
- Table 25: Brazil UK Office Furniture Industry Revenue (Million) Forecast, by Application 2020 & 2033
- Table 26: Brazil UK Office Furniture Industry Volume (K Unit) Forecast, by Application 2020 & 2033
- Table 27: Argentina UK Office Furniture Industry Revenue (Million) Forecast, by Application 2020 & 2033
- Table 28: Argentina UK Office Furniture Industry Volume (K Unit) Forecast, by Application 2020 & 2033
- Table 29: Rest of South America UK Office Furniture Industry Revenue (Million) Forecast, by Application 2020 & 2033
- Table 30: Rest of South America UK Office Furniture Industry Volume (K Unit) Forecast, by Application 2020 & 2033
- Table 31: Global UK Office Furniture Industry Revenue Million Forecast, by Type 2020 & 2033
- Table 32: Global UK Office Furniture Industry Volume K Unit Forecast, by Type 2020 & 2033
- Table 33: Global UK Office Furniture Industry Revenue Million Forecast, by Distribution Channel 2020 & 2033
- Table 34: Global UK Office Furniture Industry Volume K Unit Forecast, by Distribution Channel 2020 & 2033
- Table 35: Global UK Office Furniture Industry Revenue Million Forecast, by Country 2020 & 2033
- Table 36: Global UK Office Furniture Industry Volume K Unit Forecast, by Country 2020 & 2033
- Table 37: United Kingdom UK Office Furniture Industry Revenue (Million) Forecast, by Application 2020 & 2033
- Table 38: United Kingdom UK Office Furniture Industry Volume (K Unit) Forecast, by Application 2020 & 2033
- Table 39: Germany UK Office Furniture Industry Revenue (Million) Forecast, by Application 2020 & 2033
- Table 40: Germany UK Office Furniture Industry Volume (K Unit) Forecast, by Application 2020 & 2033
- Table 41: France UK Office Furniture Industry Revenue (Million) Forecast, by Application 2020 & 2033
- Table 42: France UK Office Furniture Industry Volume (K Unit) Forecast, by Application 2020 & 2033
- Table 43: Italy UK Office Furniture Industry Revenue (Million) Forecast, by Application 2020 & 2033
- Table 44: Italy UK Office Furniture Industry Volume (K Unit) Forecast, by Application 2020 & 2033
- Table 45: Spain UK Office Furniture Industry Revenue (Million) Forecast, by Application 2020 & 2033
- Table 46: Spain UK Office Furniture Industry Volume (K Unit) Forecast, by Application 2020 & 2033
- Table 47: Russia UK Office Furniture Industry Revenue (Million) Forecast, by Application 2020 & 2033
- Table 48: Russia UK Office Furniture Industry Volume (K Unit) Forecast, by Application 2020 & 2033
- Table 49: Benelux UK Office Furniture Industry Revenue (Million) Forecast, by Application 2020 & 2033
- Table 50: Benelux UK Office Furniture Industry Volume (K Unit) Forecast, by Application 2020 & 2033
- Table 51: Nordics UK Office Furniture Industry Revenue (Million) Forecast, by Application 2020 & 2033
- Table 52: Nordics UK Office Furniture Industry Volume (K Unit) Forecast, by Application 2020 & 2033
- Table 53: Rest of Europe UK Office Furniture Industry Revenue (Million) Forecast, by Application 2020 & 2033
- Table 54: Rest of Europe UK Office Furniture Industry Volume (K Unit) Forecast, by Application 2020 & 2033
- Table 55: Global UK Office Furniture Industry Revenue Million Forecast, by Type 2020 & 2033
- Table 56: Global UK Office Furniture Industry Volume K Unit Forecast, by Type 2020 & 2033
- Table 57: Global UK Office Furniture Industry Revenue Million Forecast, by Distribution Channel 2020 & 2033
- Table 58: Global UK Office Furniture Industry Volume K Unit Forecast, by Distribution Channel 2020 & 2033
- Table 59: Global UK Office Furniture Industry Revenue Million Forecast, by Country 2020 & 2033
- Table 60: Global UK Office Furniture Industry Volume K Unit Forecast, by Country 2020 & 2033
- Table 61: Turkey UK Office Furniture Industry Revenue (Million) Forecast, by Application 2020 & 2033
- Table 62: Turkey UK Office Furniture Industry Volume (K Unit) Forecast, by Application 2020 & 2033
- Table 63: Israel UK Office Furniture Industry Revenue (Million) Forecast, by Application 2020 & 2033
- Table 64: Israel UK Office Furniture Industry Volume (K Unit) Forecast, by Application 2020 & 2033
- Table 65: GCC UK Office Furniture Industry Revenue (Million) Forecast, by Application 2020 & 2033
- Table 66: GCC UK Office Furniture Industry Volume (K Unit) Forecast, by Application 2020 & 2033
- Table 67: North Africa UK Office Furniture Industry Revenue (Million) Forecast, by Application 2020 & 2033
- Table 68: North Africa UK Office Furniture Industry Volume (K Unit) Forecast, by Application 2020 & 2033
- Table 69: South Africa UK Office Furniture Industry Revenue (Million) Forecast, by Application 2020 & 2033
- Table 70: South Africa UK Office Furniture Industry Volume (K Unit) Forecast, by Application 2020 & 2033
- Table 71: Rest of Middle East & Africa UK Office Furniture Industry Revenue (Million) Forecast, by Application 2020 & 2033
- Table 72: Rest of Middle East & Africa UK Office Furniture Industry Volume (K Unit) Forecast, by Application 2020 & 2033
- Table 73: Global UK Office Furniture Industry Revenue Million Forecast, by Type 2020 & 2033
- Table 74: Global UK Office Furniture Industry Volume K Unit Forecast, by Type 2020 & 2033
- Table 75: Global UK Office Furniture Industry Revenue Million Forecast, by Distribution Channel 2020 & 2033
- Table 76: Global UK Office Furniture Industry Volume K Unit Forecast, by Distribution Channel 2020 & 2033
- Table 77: Global UK Office Furniture Industry Revenue Million Forecast, by Country 2020 & 2033
- Table 78: Global UK Office Furniture Industry Volume K Unit Forecast, by Country 2020 & 2033
- Table 79: China UK Office Furniture Industry Revenue (Million) Forecast, by Application 2020 & 2033
- Table 80: China UK Office Furniture Industry Volume (K Unit) Forecast, by Application 2020 & 2033
- Table 81: India UK Office Furniture Industry Revenue (Million) Forecast, by Application 2020 & 2033
- Table 82: India UK Office Furniture Industry Volume (K Unit) Forecast, by Application 2020 & 2033
- Table 83: Japan UK Office Furniture Industry Revenue (Million) Forecast, by Application 2020 & 2033
- Table 84: Japan UK Office Furniture Industry Volume (K Unit) Forecast, by Application 2020 & 2033
- Table 85: South Korea UK Office Furniture Industry Revenue (Million) Forecast, by Application 2020 & 2033
- Table 86: South Korea UK Office Furniture Industry Volume (K Unit) Forecast, by Application 2020 & 2033
- Table 87: ASEAN UK Office Furniture Industry Revenue (Million) Forecast, by Application 2020 & 2033
- Table 88: ASEAN UK Office Furniture Industry Volume (K Unit) Forecast, by Application 2020 & 2033
- Table 89: Oceania UK Office Furniture Industry Revenue (Million) Forecast, by Application 2020 & 2033
- Table 90: Oceania UK Office Furniture Industry Volume (K Unit) Forecast, by Application 2020 & 2033
- Table 91: Rest of Asia Pacific UK Office Furniture Industry Revenue (Million) Forecast, by Application 2020 & 2033
- Table 92: Rest of Asia Pacific UK Office Furniture Industry Volume (K Unit) Forecast, by Application 2020 & 2033
Frequently Asked Questions
1. What is the projected Compound Annual Growth Rate (CAGR) of the UK Office Furniture Industry?
The projected CAGR is approximately 2.78%.
2. Which companies are prominent players in the UK Office Furniture Industry?
Key companies in the market include Tangent Office Furniture, SteelCase, Verve Workspace, Flexiform Office Furniture, Herman Miller, Verco Office Furniture, Lee & Plumpton, The Frem Group, Margolis Furniture, Knoll, Metric Office Furniture, HumanScale, Urban Office.
3. What are the main segments of the UK Office Furniture Industry?
The market segments include Type, Distribution Channel.
4. Can you provide details about the market size?
The market size is estimated to be USD 5.21 Million as of 2022.
5. What are some drivers contributing to market growth?
Tech-Integrated Furniture are Helping to Grow the Market.
6. What are the notable trends driving market growth?
Growing Flexible Office Spaces in the Country.
7. Are there any restraints impacting market growth?
Raw Material Cost Barrier to Growth.
8. Can you provide examples of recent developments in the market?
In 2022, Steelcase Inc. reported first-quarter revenue of USD 740.7 million, a net loss of USD 11.4 million, and an adjusted loss per share of USD 0.05. Steelcase Inc. acquired Halcon, a Minnesota-based designer and manufacturer of tailored wood furniture for the workplace, for USD 127.5 million in May 2022.
9. What pricing options are available for accessing the report?
Pricing options include single-user, multi-user, and enterprise licenses priced at USD 3800, USD 4500, and USD 5800 respectively.
10. Is the market size provided in terms of value or volume?
The market size is provided in terms of value, measured in Million and volume, measured in K Unit.
11. Are there any specific market keywords associated with the report?
Yes, the market keyword associated with the report is "UK Office Furniture Industry," which aids in identifying and referencing the specific market segment covered.
12. How do I determine which pricing option suits my needs best?
The pricing options vary based on user requirements and access needs. Individual users may opt for single-user licenses, while businesses requiring broader access may choose multi-user or enterprise licenses for cost-effective access to the report.
13. Are there any additional resources or data provided in the UK Office Furniture Industry report?
While the report offers comprehensive insights, it's advisable to review the specific contents or supplementary materials provided to ascertain if additional resources or data are available.
14. How can I stay updated on further developments or reports in the UK Office Furniture Industry?
To stay informed about further developments, trends, and reports in the UK Office Furniture Industry, consider subscribing to industry newsletters, following relevant companies and organizations, or regularly checking reputable industry news sources and publications.
Methodology
Step 1 - Identification of Relevant Samples Size from Population Database


Step 2 - Approaches for Defining Global Market Size (Value, Volume* & Price*)

Note*: In applicable scenarios
Step 3 - Data Sources
Primary Research
- Web Analytics
- Survey Reports
- Research Institute
- Latest Research Reports
- Opinion Leaders
Secondary Research
- Annual Reports
- White Paper
- Latest Press Release
- Industry Association
- Paid Database
- Investor Presentations

Step 4 - Data Triangulation
Involves using different sources of information in order to increase the validity of a study
These sources are likely to be stakeholders in a program - participants, other researchers, program staff, other community members, and so on.
Then we put all data in single framework & apply various statistical tools to find out the dynamic on the market.
During the analysis stage, feedback from the stakeholder groups would be compared to determine areas of agreement as well as areas of divergence