

Key Insights
The global used smartphone market is poised for substantial expansion, driven by increasing demand for cost-effective devices and growing environmental consciousness. The market is projected to achieve a Compound Annual Growth Rate (CAGR) of 22.6%. With a current market size of 42.33 billion in the base year 2025, the market is set for significant growth. Key growth drivers include the rising cost of new smartphones, driving consumers towards pre-owned options, and the growing availability and trust in certified pre-owned and refurbished programs. Furthermore, heightened awareness of e-waste contributes to the demand for sustainable mobile solutions. The online channel currently leads sales, with the "Used-Like New" condition commanding higher value than "Used-Good." Devices priced between $200-$500 represent the most popular segment, balancing affordability with performance. Android's continued dominance in operating systems reflects its widespread adoption. Major industry players such as Alibaba, Amazon, and Best Buy are instrumental in shaping the market through their extensive online platforms and refurbishment initiatives. Geographically, North America and Asia-Pacific are the leading markets, owing to high smartphone penetration and robust consumer spending.
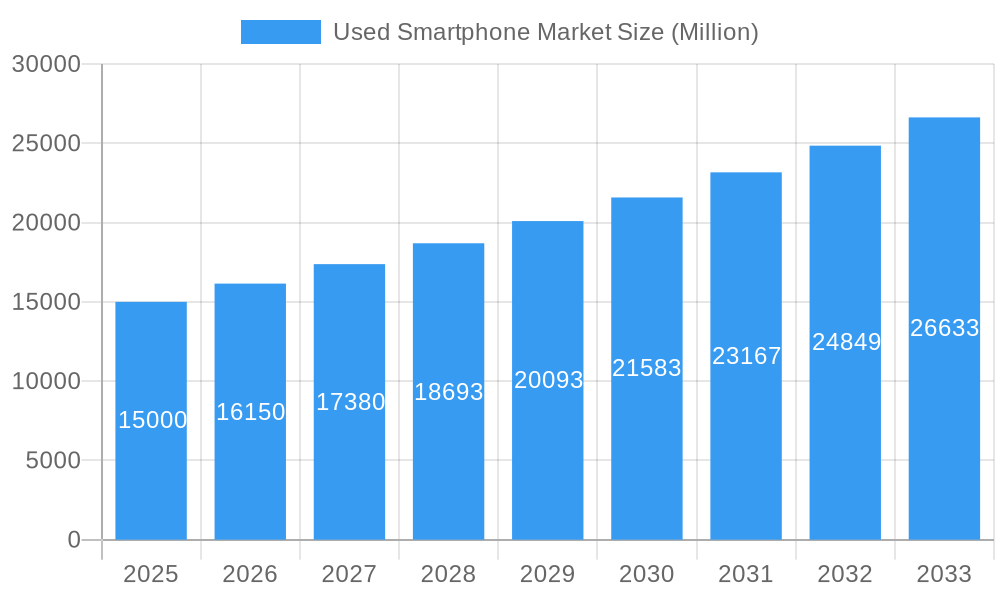
Used Smartphone Market Market Size (In Billion)
Future market expansion will be shaped by technological advancements, shifting consumer preferences, and a stronger emphasis on sustainable consumption. The development of more durable smartphones will naturally extend device lifespans, benefiting the used market. Addressing data security and privacy concerns through advanced authentication and data wiping technologies will be crucial. Efficient logistics and distribution networks will be vital for meeting growing demand, particularly in emerging economies. Companies are expected to invest in enhancing refurbishment processes and expanding their online presence to maintain a competitive edge. The market is anticipated to undergo further consolidation as larger entities acquire smaller competitors, leading to increased economies of scale and market share.
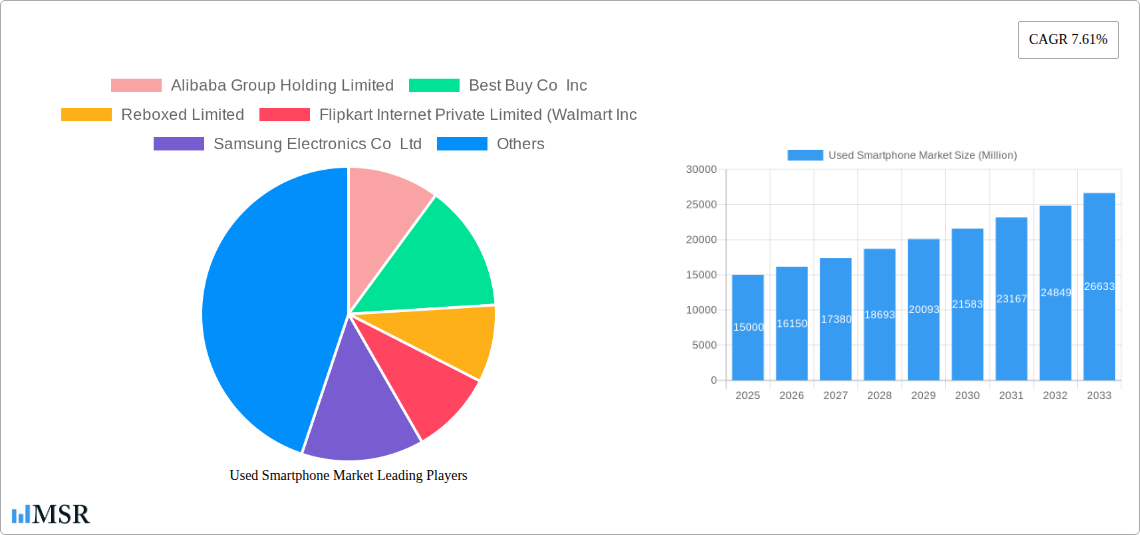
Used Smartphone Market Company Market Share
Used Smartphone Market: A Comprehensive Report (2019-2033)
This in-depth report provides a comprehensive analysis of the global used smartphone market, covering market dynamics, industry trends, key segments, leading players, and future growth opportunities. The study period spans from 2019 to 2033, with 2025 as the base and estimated year. The forecast period is 2025-2033, and the historical period is 2019-2024. This report is essential for industry stakeholders, investors, and businesses seeking to understand and capitalize on the burgeoning used smartphone market, valued at xx Million in 2025 and projected to reach xx Million by 2033, exhibiting a CAGR of xx%.
Used Smartphone Market Concentration & Dynamics
The used smartphone market exhibits a moderately concentrated landscape, with several key players vying for market share. While giants like Apple Inc, Amazon.com Inc, and Samsung Electronics Co Ltd hold significant positions, numerous smaller players and specialized refurbishers are also active. Market share data for 2025 suggests that Apple holds approximately xx%, while Samsung holds xx%, and Amazon holds xx%. The remaining share is distributed amongst other players including Alibaba Group Holding Limited, Best Buy Co Inc, Reboxed Limited, Flipkart Internet Private Limited (Walmart Inc), Verizon Communications Inc, FoneGiant, Paytm (One97 Communications Limited), Nippon Telephone Inc, Back Market, and AT&T Inc.
- Innovation Ecosystems: A robust ecosystem of refurbishing companies, third-party repair shops, and online marketplaces supports market growth. Continuous advancements in battery technology and repair techniques further fuel the market.
- Regulatory Frameworks: Regulations concerning data privacy, e-waste management, and product warranties impact market dynamics. Variations in regulations across different geographies introduce complexities.
- Substitute Products: The emergence of affordable new smartphone models and alternative communication devices presents a level of substitution, although the cost advantage of used smartphones remains significant.
- End-User Trends: Growing environmental awareness and increasing affordability are key drivers pushing consumers toward the used smartphone market. The demand for budget-friendly options, particularly in developing economies, is robust.
- M&A Activities: The past five years have witnessed xx mergers and acquisitions in the used smartphone market, indicating significant consolidation and investment in the sector. Examples include the recent REFURBED Series C investment.
Used Smartphone Market Industry Insights & Trends
The global used smartphone market is experiencing robust growth, driven by a multitude of factors. The increasing affordability of used smartphones compared to new ones is a significant driver, particularly in emerging markets. Environmental concerns regarding e-waste are also pushing consumers towards more sustainable options. Additionally, advancements in refurbishment technology allow for improved quality and longer lifespans of used devices. The market size in 2025 is estimated at xx Million, with a projected growth to xx Million by 2033, representing a considerable opportunity for businesses and investors. Technological disruptions, such as improvements in battery technology and repair techniques, further enhance the appeal and longevity of refurbished devices. Evolving consumer behaviors, driven by cost consciousness and sustainability, are key factors fueling this market expansion.
Key Markets & Segments Leading Used Smartphone Market
Dominant Region/Country: The Asia-Pacific region dominates the used smartphone market, driven by high smartphone penetration and a large population with budget constraints. Within the region, India and China are particularly significant.
Dominant Segments:
- Condition: The "Used-Good" segment holds the largest market share due to its balance of cost and functionality.
- Channel: Online channels account for a greater share, driven by convenience and wider reach.
- Price Range: The "$200-$500" price range is the most popular segment, catering to a large segment of budget-conscious consumers.
- Operating System: The Android OS maintains a dominant share, reflecting its global popularity.
Drivers:
- Economic Growth: Rising disposable incomes in developing economies fuel market expansion.
- Infrastructure Development: Improved internet connectivity enhances online sales.
- Environmental Concerns: Growing awareness of e-waste encourages sustainable consumption.
Used Smartphone Market Product Developments
Recent product innovations include advancements in battery technology, improved repair techniques, and extended warranties for refurbished devices. These advancements enhance the quality, reliability, and longevity of used smartphones, directly impacting their market relevance and competitive positioning. Manufacturers are increasingly focusing on enhancing the user experience and providing better value propositions to compete effectively in this growing market.
Challenges in the Used Smartphone Market Market
The used smartphone market faces several challenges. These include the inconsistent quality of refurbished devices, concerns related to data security and privacy, and the complexities of managing global supply chains. Furthermore, the market faces regulatory hurdles regarding e-waste management and warranty regulations. The overall impact of these challenges is estimated to reduce market growth by approximately xx% annually.
Forces Driving Used Smartphone Market Growth
Several factors propel the used smartphone market's growth, including rising affordability, expanding internet access, and increasing environmental consciousness. The growing demand for budget-friendly options, especially in emerging markets, is a major driver. Furthermore, advancements in refurbishment technologies enhance the quality and reliability of used devices. Government initiatives promoting e-waste management and circular economy practices further contribute to the market's expansion.
Challenges in the Used Smartphone Market Market (Long-Term Growth Catalysts)
Long-term growth will be driven by innovation in refurbishment technologies, strategic partnerships between manufacturers and refurbishers, and expansion into new markets. Development of advanced diagnostics and repair processes to address concerns around quality and reliability are crucial.
Emerging Opportunities in Used Smartphone Market
Emerging opportunities lie in expanding into underserved markets, developing specialized refurbishment services for specific brands or models, and incorporating advanced technologies like AI-powered diagnostics into the process. The focus on sustainability and circular economy models presents significant opportunities for businesses that prioritize ethical and environmentally responsible practices.
Leading Players in the Used Smartphone Market Sector
- Alibaba Group Holding Limited
- Best Buy Co Inc
- Reboxed Limited
- Flipkart Internet Private Limited (Walmart Inc)
- Samsung Electronics Co Ltd
- Verizon Communications Inc
- FoneGiant
- Paytm (One97 Communications Limited)
- Amazon.com Inc
- Nippon Telephone Inc
- Back Market
- AT&T Inc
- Apple Inc
Key Milestones in Used Smartphone Market Industry
- December 2023: ControlZ, a smartphone refurbishing startup, plans to invest nearly USD 2 million in its Gurugram repair facility in 2024, aiming to repair 1 lakh units in 2024 and scale to 5 lakh units by 2025. This signifies increased investment in the refurbishment sector.
- September 2023: REFURBED, a portfolio company of Expon Capital, secured USD 57 million in Series C funding. This significant investment highlights the growing investor confidence in the sustainable technology sector and the used smartphone market.
Strategic Outlook for Used Smartphone Market Market
The future of the used smartphone market looks promising. Continued growth is anticipated, driven by increasing affordability, sustainability concerns, and technological advancements. Strategic partnerships and investments in advanced refurbishment technologies will be crucial for market leaders to maintain their competitiveness. Expanding into new markets and offering innovative services will further enhance market potential.
Used Smartphone Market Segmentation
- 1. Production Analysis
- 2. Consumption Analysis
- 3. Import Market Analysis (Value & Volume)
- 4. Export Market Analysis (Value & Volume)
- 5. Price Trend Analysis
Used Smartphone Market Segmentation By Geography
- 1. North America
- 2. Europe
- 3. Asia Pacific
- 4. Rest of the World
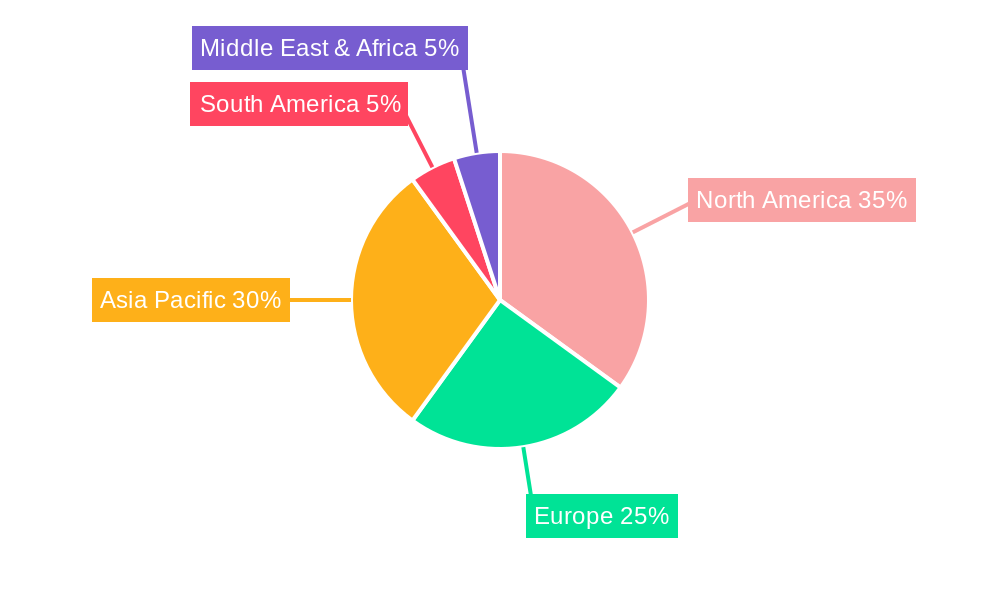
Used Smartphone Market Regional Market Share
Geographic Coverage of Used Smartphone Market
Used Smartphone Market REPORT HIGHLIGHTS
| Aspects | Details |
|---|---|
| Study Period | 2020-2034 |
| Base Year | 2025 |
| Estimated Year | 2026 |
| Forecast Period | 2026-2034 |
| Historical Period | 2020-2025 |
| Growth Rate | CAGR of 22.6% from 2020-2034 |
| Segmentation |
|
Table of Contents
- 1. Introduction
- 1.1. Research Scope
- 1.2. Market Segmentation
- 1.3. Research Objective
- 1.4. Definitions and Assumptions
- 2. Executive Summary
- 2.1. Market Snapshot
- 3. Market Dynamics
- 3.1. Market Drivers
- 3.2. Market Restrains
- 3.3. Market Trends
- 3.4. Market Opportunities
- 4. Market Factor Analysis
- 4.1. Porters Five Forces
- 4.1.1. Bargaining Power of Suppliers
- 4.1.2. Bargaining Power of Buyers
- 4.1.3. Threat of New Entrants
- 4.1.4. Threat of Substitutes
- 4.1.5. Competitive Rivalry
- 4.2. PESTEL analysis
- 4.3. BCG Analysis
- 4.3.1. Stars (High Growth, High Market Share)
- 4.3.2. Cash Cows (Low Growth, High Market Share)
- 4.3.3. Question Mark (High Growth, Low Market Share)
- 4.3.4. Dogs (Low Growth, Low Market Share)
- 4.4. Ansoff Matrix Analysis
- 4.5. Supply Chain Analysis
- 4.6. Regulatory Landscape
- 4.7. Current Market Potential and Opportunity Assessment (TAM–SAM–SOM Framework)
- 4.8. MSR Analyst Note
- 4.1. Porters Five Forces
- 5. Market Analysis, Insights and Forecast 2021-2033
- 5.1. Market Analysis, Insights and Forecast - by Production Analysis
- 5.2. Market Analysis, Insights and Forecast - by Consumption Analysis
- 5.3. Market Analysis, Insights and Forecast - by Import Market Analysis (Value & Volume)
- 5.4. Market Analysis, Insights and Forecast - by Export Market Analysis (Value & Volume)
- 5.5. Market Analysis, Insights and Forecast - by Price Trend Analysis
- 5.6. Market Analysis, Insights and Forecast - by Region
- 5.6.1. North America
- 5.6.2. Europe
- 5.6.3. Asia Pacific
- 5.6.4. Rest of the World
- 6. Global Used Smartphone Market Analysis, Insights and Forecast, 2021-2033
- 6.1. Market Analysis, Insights and Forecast - by Production Analysis
- 6.2. Market Analysis, Insights and Forecast - by Consumption Analysis
- 6.3. Market Analysis, Insights and Forecast - by Import Market Analysis (Value & Volume)
- 6.4. Market Analysis, Insights and Forecast - by Export Market Analysis (Value & Volume)
- 6.5. Market Analysis, Insights and Forecast - by Price Trend Analysis
- 7. North America Used Smartphone Market Analysis, Insights and Forecast, 2020-2032
- 7.1. Market Analysis, Insights and Forecast - by Production Analysis
- 7.2. Market Analysis, Insights and Forecast - by Consumption Analysis
- 7.3. Market Analysis, Insights and Forecast - by Import Market Analysis (Value & Volume)
- 7.4. Market Analysis, Insights and Forecast - by Export Market Analysis (Value & Volume)
- 7.5. Market Analysis, Insights and Forecast - by Price Trend Analysis
- 8. Europe Used Smartphone Market Analysis, Insights and Forecast, 2020-2032
- 8.1. Market Analysis, Insights and Forecast - by Production Analysis
- 8.2. Market Analysis, Insights and Forecast - by Consumption Analysis
- 8.3. Market Analysis, Insights and Forecast - by Import Market Analysis (Value & Volume)
- 8.4. Market Analysis, Insights and Forecast - by Export Market Analysis (Value & Volume)
- 8.5. Market Analysis, Insights and Forecast - by Price Trend Analysis
- 9. Asia Pacific Used Smartphone Market Analysis, Insights and Forecast, 2020-2032
- 9.1. Market Analysis, Insights and Forecast - by Production Analysis
- 9.2. Market Analysis, Insights and Forecast - by Consumption Analysis
- 9.3. Market Analysis, Insights and Forecast - by Import Market Analysis (Value & Volume)
- 9.4. Market Analysis, Insights and Forecast - by Export Market Analysis (Value & Volume)
- 9.5. Market Analysis, Insights and Forecast - by Price Trend Analysis
- 10. Rest of the World Used Smartphone Market Analysis, Insights and Forecast, 2020-2032
- 10.1. Market Analysis, Insights and Forecast - by Production Analysis
- 10.2. Market Analysis, Insights and Forecast - by Consumption Analysis
- 10.3. Market Analysis, Insights and Forecast - by Import Market Analysis (Value & Volume)
- 10.4. Market Analysis, Insights and Forecast - by Export Market Analysis (Value & Volume)
- 10.5. Market Analysis, Insights and Forecast - by Price Trend Analysis
- 11. Competitive Analysis
- 11.1. Company Profiles
- 11.1.1 Alibaba Group Holding Limited
- 11.1.1.1. Company Overview
- 11.1.1.2. Products
- 11.1.1.3. Company Financials
- 11.1.1.4. SWOT Analysis
- 11.1.2 Best Buy Co Inc
- 11.1.2.1. Company Overview
- 11.1.2.2. Products
- 11.1.2.3. Company Financials
- 11.1.2.4. SWOT Analysis
- 11.1.3 Reboxed Limited
- 11.1.3.1. Company Overview
- 11.1.3.2. Products
- 11.1.3.3. Company Financials
- 11.1.3.4. SWOT Analysis
- 11.1.4 Flipkart Internet Private Limited (Walmart Inc
- 11.1.4.1. Company Overview
- 11.1.4.2. Products
- 11.1.4.3. Company Financials
- 11.1.4.4. SWOT Analysis
- 11.1.5 Samsung Electronics Co Ltd
- 11.1.5.1. Company Overview
- 11.1.5.2. Products
- 11.1.5.3. Company Financials
- 11.1.5.4. SWOT Analysis
- 11.1.6 Verizon Communications Inc
- 11.1.6.1. Company Overview
- 11.1.6.2. Products
- 11.1.6.3. Company Financials
- 11.1.6.4. SWOT Analysis
- 11.1.7 FoneGiant
- 11.1.7.1. Company Overview
- 11.1.7.2. Products
- 11.1.7.3. Company Financials
- 11.1.7.4. SWOT Analysis
- 11.1.8 Paytm (One97 Communications Limited)
- 11.1.8.1. Company Overview
- 11.1.8.2. Products
- 11.1.8.3. Company Financials
- 11.1.8.4. SWOT Analysis
- 11.1.9 Amazon com Inc
- 11.1.9.1. Company Overview
- 11.1.9.2. Products
- 11.1.9.3. Company Financials
- 11.1.9.4. SWOT Analysis
- 11.1.10 Nippon Telephone Inc
- 11.1.10.1. Company Overview
- 11.1.10.2. Products
- 11.1.10.3. Company Financials
- 11.1.10.4. SWOT Analysis
- 11.1.11 Back Market
- 11.1.11.1. Company Overview
- 11.1.11.2. Products
- 11.1.11.3. Company Financials
- 11.1.11.4. SWOT Analysis
- 11.1.12 AT&T Inc
- 11.1.12.1. Company Overview
- 11.1.12.2. Products
- 11.1.12.3. Company Financials
- 11.1.12.4. SWOT Analysis
- 11.1.13 Apple Inc
- 11.1.13.1. Company Overview
- 11.1.13.2. Products
- 11.1.13.3. Company Financials
- 11.1.13.4. SWOT Analysis
- 11.1.1 Alibaba Group Holding Limited
- 11.2. Market Entropy
- 11.2.1 Company's Key Areas Served
- 11.2.2 Recent Developments
- 11.3. Company Market Share Analysis 2025
- 11.3.1 Top 5 Companies Market Share Analysis
- 11.3.2 Top 3 Companies Market Share Analysis
- 11.4. List of Potential Customers
- 12. Research Methodology
List of Figures
- Figure 1: Global Used Smartphone Market Revenue Breakdown (billion, %) by Region 2025 & 2033
- Figure 2: Global Used Smartphone Market Volume Breakdown (Million, %) by Region 2025 & 2033
- Figure 3: North America Used Smartphone Market Revenue (billion), by Production Analysis 2025 & 2033
- Figure 4: North America Used Smartphone Market Volume (Million), by Production Analysis 2025 & 2033
- Figure 5: North America Used Smartphone Market Revenue Share (%), by Production Analysis 2025 & 2033
- Figure 6: North America Used Smartphone Market Volume Share (%), by Production Analysis 2025 & 2033
- Figure 7: North America Used Smartphone Market Revenue (billion), by Consumption Analysis 2025 & 2033
- Figure 8: North America Used Smartphone Market Volume (Million), by Consumption Analysis 2025 & 2033
- Figure 9: North America Used Smartphone Market Revenue Share (%), by Consumption Analysis 2025 & 2033
- Figure 10: North America Used Smartphone Market Volume Share (%), by Consumption Analysis 2025 & 2033
- Figure 11: North America Used Smartphone Market Revenue (billion), by Import Market Analysis (Value & Volume) 2025 & 2033
- Figure 12: North America Used Smartphone Market Volume (Million), by Import Market Analysis (Value & Volume) 2025 & 2033
- Figure 13: North America Used Smartphone Market Revenue Share (%), by Import Market Analysis (Value & Volume) 2025 & 2033
- Figure 14: North America Used Smartphone Market Volume Share (%), by Import Market Analysis (Value & Volume) 2025 & 2033
- Figure 15: North America Used Smartphone Market Revenue (billion), by Export Market Analysis (Value & Volume) 2025 & 2033
- Figure 16: North America Used Smartphone Market Volume (Million), by Export Market Analysis (Value & Volume) 2025 & 2033
- Figure 17: North America Used Smartphone Market Revenue Share (%), by Export Market Analysis (Value & Volume) 2025 & 2033
- Figure 18: North America Used Smartphone Market Volume Share (%), by Export Market Analysis (Value & Volume) 2025 & 2033
- Figure 19: North America Used Smartphone Market Revenue (billion), by Price Trend Analysis 2025 & 2033
- Figure 20: North America Used Smartphone Market Volume (Million), by Price Trend Analysis 2025 & 2033
- Figure 21: North America Used Smartphone Market Revenue Share (%), by Price Trend Analysis 2025 & 2033
- Figure 22: North America Used Smartphone Market Volume Share (%), by Price Trend Analysis 2025 & 2033
- Figure 23: North America Used Smartphone Market Revenue (billion), by Country 2025 & 2033
- Figure 24: North America Used Smartphone Market Volume (Million), by Country 2025 & 2033
- Figure 25: North America Used Smartphone Market Revenue Share (%), by Country 2025 & 2033
- Figure 26: North America Used Smartphone Market Volume Share (%), by Country 2025 & 2033
- Figure 27: Europe Used Smartphone Market Revenue (billion), by Production Analysis 2025 & 2033
- Figure 28: Europe Used Smartphone Market Volume (Million), by Production Analysis 2025 & 2033
- Figure 29: Europe Used Smartphone Market Revenue Share (%), by Production Analysis 2025 & 2033
- Figure 30: Europe Used Smartphone Market Volume Share (%), by Production Analysis 2025 & 2033
- Figure 31: Europe Used Smartphone Market Revenue (billion), by Consumption Analysis 2025 & 2033
- Figure 32: Europe Used Smartphone Market Volume (Million), by Consumption Analysis 2025 & 2033
- Figure 33: Europe Used Smartphone Market Revenue Share (%), by Consumption Analysis 2025 & 2033
- Figure 34: Europe Used Smartphone Market Volume Share (%), by Consumption Analysis 2025 & 2033
- Figure 35: Europe Used Smartphone Market Revenue (billion), by Import Market Analysis (Value & Volume) 2025 & 2033
- Figure 36: Europe Used Smartphone Market Volume (Million), by Import Market Analysis (Value & Volume) 2025 & 2033
- Figure 37: Europe Used Smartphone Market Revenue Share (%), by Import Market Analysis (Value & Volume) 2025 & 2033
- Figure 38: Europe Used Smartphone Market Volume Share (%), by Import Market Analysis (Value & Volume) 2025 & 2033
- Figure 39: Europe Used Smartphone Market Revenue (billion), by Export Market Analysis (Value & Volume) 2025 & 2033
- Figure 40: Europe Used Smartphone Market Volume (Million), by Export Market Analysis (Value & Volume) 2025 & 2033
- Figure 41: Europe Used Smartphone Market Revenue Share (%), by Export Market Analysis (Value & Volume) 2025 & 2033
- Figure 42: Europe Used Smartphone Market Volume Share (%), by Export Market Analysis (Value & Volume) 2025 & 2033
- Figure 43: Europe Used Smartphone Market Revenue (billion), by Price Trend Analysis 2025 & 2033
- Figure 44: Europe Used Smartphone Market Volume (Million), by Price Trend Analysis 2025 & 2033
- Figure 45: Europe Used Smartphone Market Revenue Share (%), by Price Trend Analysis 2025 & 2033
- Figure 46: Europe Used Smartphone Market Volume Share (%), by Price Trend Analysis 2025 & 2033
- Figure 47: Europe Used Smartphone Market Revenue (billion), by Country 2025 & 2033
- Figure 48: Europe Used Smartphone Market Volume (Million), by Country 2025 & 2033
- Figure 49: Europe Used Smartphone Market Revenue Share (%), by Country 2025 & 2033
- Figure 50: Europe Used Smartphone Market Volume Share (%), by Country 2025 & 2033
- Figure 51: Asia Pacific Used Smartphone Market Revenue (billion), by Production Analysis 2025 & 2033
- Figure 52: Asia Pacific Used Smartphone Market Volume (Million), by Production Analysis 2025 & 2033
- Figure 53: Asia Pacific Used Smartphone Market Revenue Share (%), by Production Analysis 2025 & 2033
- Figure 54: Asia Pacific Used Smartphone Market Volume Share (%), by Production Analysis 2025 & 2033
- Figure 55: Asia Pacific Used Smartphone Market Revenue (billion), by Consumption Analysis 2025 & 2033
- Figure 56: Asia Pacific Used Smartphone Market Volume (Million), by Consumption Analysis 2025 & 2033
- Figure 57: Asia Pacific Used Smartphone Market Revenue Share (%), by Consumption Analysis 2025 & 2033
- Figure 58: Asia Pacific Used Smartphone Market Volume Share (%), by Consumption Analysis 2025 & 2033
- Figure 59: Asia Pacific Used Smartphone Market Revenue (billion), by Import Market Analysis (Value & Volume) 2025 & 2033
- Figure 60: Asia Pacific Used Smartphone Market Volume (Million), by Import Market Analysis (Value & Volume) 2025 & 2033
- Figure 61: Asia Pacific Used Smartphone Market Revenue Share (%), by Import Market Analysis (Value & Volume) 2025 & 2033
- Figure 62: Asia Pacific Used Smartphone Market Volume Share (%), by Import Market Analysis (Value & Volume) 2025 & 2033
- Figure 63: Asia Pacific Used Smartphone Market Revenue (billion), by Export Market Analysis (Value & Volume) 2025 & 2033
- Figure 64: Asia Pacific Used Smartphone Market Volume (Million), by Export Market Analysis (Value & Volume) 2025 & 2033
- Figure 65: Asia Pacific Used Smartphone Market Revenue Share (%), by Export Market Analysis (Value & Volume) 2025 & 2033
- Figure 66: Asia Pacific Used Smartphone Market Volume Share (%), by Export Market Analysis (Value & Volume) 2025 & 2033
- Figure 67: Asia Pacific Used Smartphone Market Revenue (billion), by Price Trend Analysis 2025 & 2033
- Figure 68: Asia Pacific Used Smartphone Market Volume (Million), by Price Trend Analysis 2025 & 2033
- Figure 69: Asia Pacific Used Smartphone Market Revenue Share (%), by Price Trend Analysis 2025 & 2033
- Figure 70: Asia Pacific Used Smartphone Market Volume Share (%), by Price Trend Analysis 2025 & 2033
- Figure 71: Asia Pacific Used Smartphone Market Revenue (billion), by Country 2025 & 2033
- Figure 72: Asia Pacific Used Smartphone Market Volume (Million), by Country 2025 & 2033
- Figure 73: Asia Pacific Used Smartphone Market Revenue Share (%), by Country 2025 & 2033
- Figure 74: Asia Pacific Used Smartphone Market Volume Share (%), by Country 2025 & 2033
- Figure 75: Rest of the World Used Smartphone Market Revenue (billion), by Production Analysis 2025 & 2033
- Figure 76: Rest of the World Used Smartphone Market Volume (Million), by Production Analysis 2025 & 2033
- Figure 77: Rest of the World Used Smartphone Market Revenue Share (%), by Production Analysis 2025 & 2033
- Figure 78: Rest of the World Used Smartphone Market Volume Share (%), by Production Analysis 2025 & 2033
- Figure 79: Rest of the World Used Smartphone Market Revenue (billion), by Consumption Analysis 2025 & 2033
- Figure 80: Rest of the World Used Smartphone Market Volume (Million), by Consumption Analysis 2025 & 2033
- Figure 81: Rest of the World Used Smartphone Market Revenue Share (%), by Consumption Analysis 2025 & 2033
- Figure 82: Rest of the World Used Smartphone Market Volume Share (%), by Consumption Analysis 2025 & 2033
- Figure 83: Rest of the World Used Smartphone Market Revenue (billion), by Import Market Analysis (Value & Volume) 2025 & 2033
- Figure 84: Rest of the World Used Smartphone Market Volume (Million), by Import Market Analysis (Value & Volume) 2025 & 2033
- Figure 85: Rest of the World Used Smartphone Market Revenue Share (%), by Import Market Analysis (Value & Volume) 2025 & 2033
- Figure 86: Rest of the World Used Smartphone Market Volume Share (%), by Import Market Analysis (Value & Volume) 2025 & 2033
- Figure 87: Rest of the World Used Smartphone Market Revenue (billion), by Export Market Analysis (Value & Volume) 2025 & 2033
- Figure 88: Rest of the World Used Smartphone Market Volume (Million), by Export Market Analysis (Value & Volume) 2025 & 2033
- Figure 89: Rest of the World Used Smartphone Market Revenue Share (%), by Export Market Analysis (Value & Volume) 2025 & 2033
- Figure 90: Rest of the World Used Smartphone Market Volume Share (%), by Export Market Analysis (Value & Volume) 2025 & 2033
- Figure 91: Rest of the World Used Smartphone Market Revenue (billion), by Price Trend Analysis 2025 & 2033
- Figure 92: Rest of the World Used Smartphone Market Volume (Million), by Price Trend Analysis 2025 & 2033
- Figure 93: Rest of the World Used Smartphone Market Revenue Share (%), by Price Trend Analysis 2025 & 2033
- Figure 94: Rest of the World Used Smartphone Market Volume Share (%), by Price Trend Analysis 2025 & 2033
- Figure 95: Rest of the World Used Smartphone Market Revenue (billion), by Country 2025 & 2033
- Figure 96: Rest of the World Used Smartphone Market Volume (Million), by Country 2025 & 2033
- Figure 97: Rest of the World Used Smartphone Market Revenue Share (%), by Country 2025 & 2033
- Figure 98: Rest of the World Used Smartphone Market Volume Share (%), by Country 2025 & 2033
List of Tables
- Table 1: Global Used Smartphone Market Revenue billion Forecast, by Production Analysis 2020 & 2033
- Table 2: Global Used Smartphone Market Volume Million Forecast, by Production Analysis 2020 & 2033
- Table 3: Global Used Smartphone Market Revenue billion Forecast, by Consumption Analysis 2020 & 2033
- Table 4: Global Used Smartphone Market Volume Million Forecast, by Consumption Analysis 2020 & 2033
- Table 5: Global Used Smartphone Market Revenue billion Forecast, by Import Market Analysis (Value & Volume) 2020 & 2033
- Table 6: Global Used Smartphone Market Volume Million Forecast, by Import Market Analysis (Value & Volume) 2020 & 2033
- Table 7: Global Used Smartphone Market Revenue billion Forecast, by Export Market Analysis (Value & Volume) 2020 & 2033
- Table 8: Global Used Smartphone Market Volume Million Forecast, by Export Market Analysis (Value & Volume) 2020 & 2033
- Table 9: Global Used Smartphone Market Revenue billion Forecast, by Price Trend Analysis 2020 & 2033
- Table 10: Global Used Smartphone Market Volume Million Forecast, by Price Trend Analysis 2020 & 2033
- Table 11: Global Used Smartphone Market Revenue billion Forecast, by Region 2020 & 2033
- Table 12: Global Used Smartphone Market Volume Million Forecast, by Region 2020 & 2033
- Table 13: Global Used Smartphone Market Revenue billion Forecast, by Production Analysis 2020 & 2033
- Table 14: Global Used Smartphone Market Volume Million Forecast, by Production Analysis 2020 & 2033
- Table 15: Global Used Smartphone Market Revenue billion Forecast, by Consumption Analysis 2020 & 2033
- Table 16: Global Used Smartphone Market Volume Million Forecast, by Consumption Analysis 2020 & 2033
- Table 17: Global Used Smartphone Market Revenue billion Forecast, by Import Market Analysis (Value & Volume) 2020 & 2033
- Table 18: Global Used Smartphone Market Volume Million Forecast, by Import Market Analysis (Value & Volume) 2020 & 2033
- Table 19: Global Used Smartphone Market Revenue billion Forecast, by Export Market Analysis (Value & Volume) 2020 & 2033
- Table 20: Global Used Smartphone Market Volume Million Forecast, by Export Market Analysis (Value & Volume) 2020 & 2033
- Table 21: Global Used Smartphone Market Revenue billion Forecast, by Price Trend Analysis 2020 & 2033
- Table 22: Global Used Smartphone Market Volume Million Forecast, by Price Trend Analysis 2020 & 2033
- Table 23: Global Used Smartphone Market Revenue billion Forecast, by Country 2020 & 2033
- Table 24: Global Used Smartphone Market Volume Million Forecast, by Country 2020 & 2033
- Table 25: Global Used Smartphone Market Revenue billion Forecast, by Production Analysis 2020 & 2033
- Table 26: Global Used Smartphone Market Volume Million Forecast, by Production Analysis 2020 & 2033
- Table 27: Global Used Smartphone Market Revenue billion Forecast, by Consumption Analysis 2020 & 2033
- Table 28: Global Used Smartphone Market Volume Million Forecast, by Consumption Analysis 2020 & 2033
- Table 29: Global Used Smartphone Market Revenue billion Forecast, by Import Market Analysis (Value & Volume) 2020 & 2033
- Table 30: Global Used Smartphone Market Volume Million Forecast, by Import Market Analysis (Value & Volume) 2020 & 2033
- Table 31: Global Used Smartphone Market Revenue billion Forecast, by Export Market Analysis (Value & Volume) 2020 & 2033
- Table 32: Global Used Smartphone Market Volume Million Forecast, by Export Market Analysis (Value & Volume) 2020 & 2033
- Table 33: Global Used Smartphone Market Revenue billion Forecast, by Price Trend Analysis 2020 & 2033
- Table 34: Global Used Smartphone Market Volume Million Forecast, by Price Trend Analysis 2020 & 2033
- Table 35: Global Used Smartphone Market Revenue billion Forecast, by Country 2020 & 2033
- Table 36: Global Used Smartphone Market Volume Million Forecast, by Country 2020 & 2033
- Table 37: Global Used Smartphone Market Revenue billion Forecast, by Production Analysis 2020 & 2033
- Table 38: Global Used Smartphone Market Volume Million Forecast, by Production Analysis 2020 & 2033
- Table 39: Global Used Smartphone Market Revenue billion Forecast, by Consumption Analysis 2020 & 2033
- Table 40: Global Used Smartphone Market Volume Million Forecast, by Consumption Analysis 2020 & 2033
- Table 41: Global Used Smartphone Market Revenue billion Forecast, by Import Market Analysis (Value & Volume) 2020 & 2033
- Table 42: Global Used Smartphone Market Volume Million Forecast, by Import Market Analysis (Value & Volume) 2020 & 2033
- Table 43: Global Used Smartphone Market Revenue billion Forecast, by Export Market Analysis (Value & Volume) 2020 & 2033
- Table 44: Global Used Smartphone Market Volume Million Forecast, by Export Market Analysis (Value & Volume) 2020 & 2033
- Table 45: Global Used Smartphone Market Revenue billion Forecast, by Price Trend Analysis 2020 & 2033
- Table 46: Global Used Smartphone Market Volume Million Forecast, by Price Trend Analysis 2020 & 2033
- Table 47: Global Used Smartphone Market Revenue billion Forecast, by Country 2020 & 2033
- Table 48: Global Used Smartphone Market Volume Million Forecast, by Country 2020 & 2033
- Table 49: Global Used Smartphone Market Revenue billion Forecast, by Production Analysis 2020 & 2033
- Table 50: Global Used Smartphone Market Volume Million Forecast, by Production Analysis 2020 & 2033
- Table 51: Global Used Smartphone Market Revenue billion Forecast, by Consumption Analysis 2020 & 2033
- Table 52: Global Used Smartphone Market Volume Million Forecast, by Consumption Analysis 2020 & 2033
- Table 53: Global Used Smartphone Market Revenue billion Forecast, by Import Market Analysis (Value & Volume) 2020 & 2033
- Table 54: Global Used Smartphone Market Volume Million Forecast, by Import Market Analysis (Value & Volume) 2020 & 2033
- Table 55: Global Used Smartphone Market Revenue billion Forecast, by Export Market Analysis (Value & Volume) 2020 & 2033
- Table 56: Global Used Smartphone Market Volume Million Forecast, by Export Market Analysis (Value & Volume) 2020 & 2033
- Table 57: Global Used Smartphone Market Revenue billion Forecast, by Price Trend Analysis 2020 & 2033
- Table 58: Global Used Smartphone Market Volume Million Forecast, by Price Trend Analysis 2020 & 2033
- Table 59: Global Used Smartphone Market Revenue billion Forecast, by Country 2020 & 2033
- Table 60: Global Used Smartphone Market Volume Million Forecast, by Country 2020 & 2033
Frequently Asked Questions
1. What is the projected Compound Annual Growth Rate (CAGR) of the Used Smartphone Market?
The projected CAGR is approximately 22.6%.
2. Which companies are prominent players in the Used Smartphone Market?
Key companies in the market include Alibaba Group Holding Limited, Best Buy Co Inc, Reboxed Limited, Flipkart Internet Private Limited (Walmart Inc, Samsung Electronics Co Ltd, Verizon Communications Inc, FoneGiant, Paytm (One97 Communications Limited), Amazon com Inc, Nippon Telephone Inc, Back Market, AT&T Inc, Apple Inc.
3. What are the main segments of the Used Smartphone Market?
The market segments include Production Analysis, Consumption Analysis, Import Market Analysis (Value & Volume), Export Market Analysis (Value & Volume), Price Trend Analysis.
4. Can you provide details about the market size?
The market size is estimated to be USD 42.33 billion as of 2022.
5. What are some drivers contributing to market growth?
Trend Toward Premium Phones (Rise in Upgrade Costs); Growing Popularity of E-commerce Platforms for Used and Refurbished Smartphones; Telecom Operators Focusing on Used Phones with Attractive Plans.
6. What are the notable trends driving market growth?
Growing Popularity of E-commerce Platforms for Used and Refurbished Smartphones to Drive the Market.
7. Are there any restraints impacting market growth?
Short term supply chain challenges due to the pandemic scenario and the US-China Trade war scenario.
8. Can you provide examples of recent developments in the market?
December 2023 - Smartphone refurbishing startup ControlZ aims to invest nearly USD 2 million in its Gurugram repair facility again in 2024. The company aims to repair 1 lakh units at the facility in 2024 and scale it to 5 lakh units by 2025.
9. What pricing options are available for accessing the report?
Pricing options include single-user, multi-user, and enterprise licenses priced at USD 4750, USD 5250, and USD 8750 respectively.
10. Is the market size provided in terms of value or volume?
The market size is provided in terms of value, measured in billion and volume, measured in Million.
11. Are there any specific market keywords associated with the report?
Yes, the market keyword associated with the report is "Used Smartphone Market," which aids in identifying and referencing the specific market segment covered.
12. How do I determine which pricing option suits my needs best?
The pricing options vary based on user requirements and access needs. Individual users may opt for single-user licenses, while businesses requiring broader access may choose multi-user or enterprise licenses for cost-effective access to the report.
13. Are there any additional resources or data provided in the Used Smartphone Market report?
While the report offers comprehensive insights, it's advisable to review the specific contents or supplementary materials provided to ascertain if additional resources or data are available.
14. How can I stay updated on further developments or reports in the Used Smartphone Market?
To stay informed about further developments, trends, and reports in the Used Smartphone Market, consider subscribing to industry newsletters, following relevant companies and organizations, or regularly checking reputable industry news sources and publications.
Methodology
Step 1 - Identification of Relevant Samples Size from Population Database


Step 2 - Approaches for Defining Global Market Size (Value, Volume* & Price*)

Note*: In applicable scenarios
Step 3 - Data Sources
Primary Research
- Web Analytics
- Survey Reports
- Research Institute
- Latest Research Reports
- Opinion Leaders
Secondary Research
- Annual Reports
- White Paper
- Latest Press Release
- Industry Association
- Paid Database
- Investor Presentations

Step 4 - Data Triangulation
Involves using different sources of information in order to increase the validity of a study
These sources are likely to be stakeholders in a program - participants, other researchers, program staff, other community members, and so on.
Then we put all data in single framework & apply various statistical tools to find out the dynamic on the market.
During the analysis stage, feedback from the stakeholder groups would be compared to determine areas of agreement as well as areas of divergence