

Key Insights
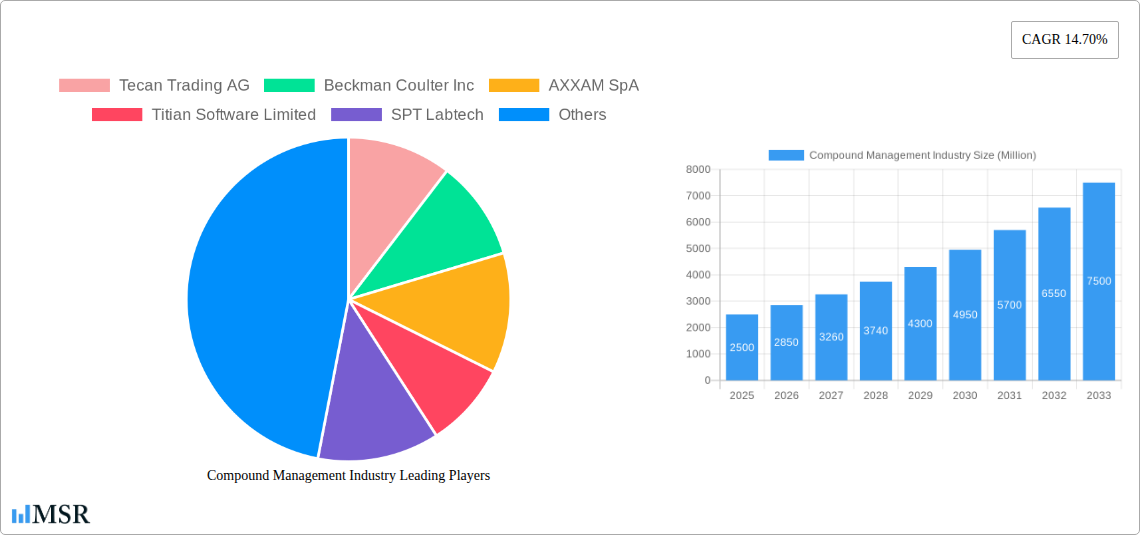
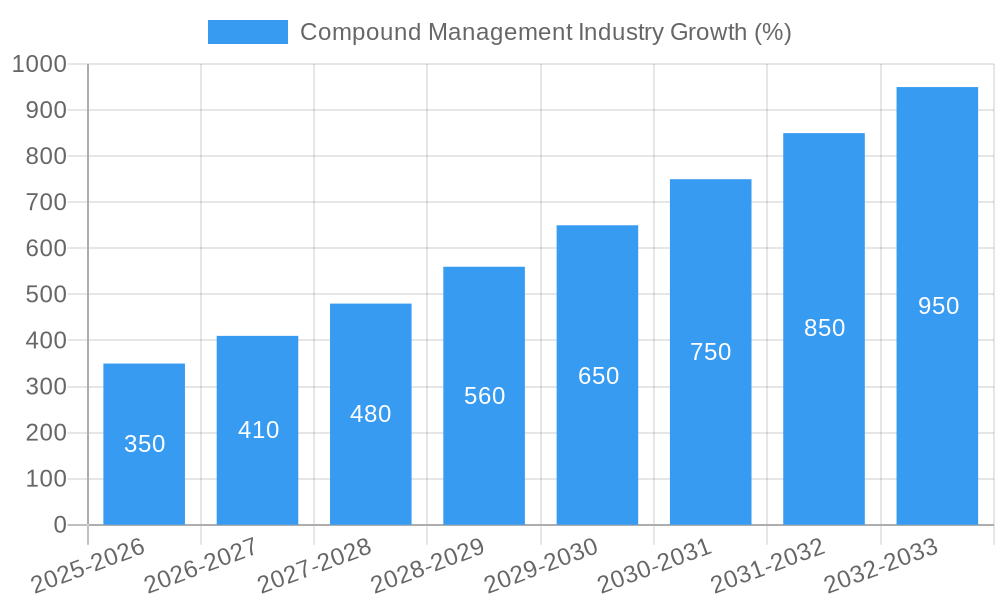
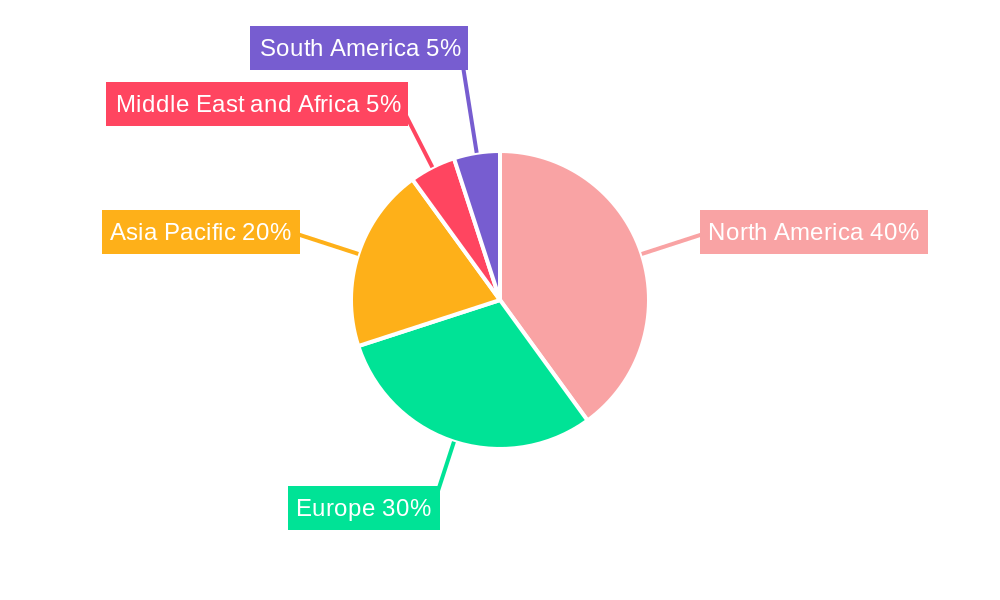
The compound management industry, encompassing the storage, management, and handling of chemical compounds and biological samples for research purposes, is experiencing robust growth. Driven by the expanding pharmaceutical and biotechnology sectors, particularly in drug discovery and gene synthesis, the market is projected to maintain a significant Compound Annual Growth Rate (CAGR) of 14.70% from 2025 to 2033. This growth is fueled by increasing investments in research and development, the rising demand for high-throughput screening technologies, and the growing need for efficient and reliable sample management solutions across various applications, including biobanking and personalized medicine. The market is segmented by service type (e.g., storage, management software), sample type (chemical compounds, bio samples), application (drug discovery, gene synthesis, biobanking), and product type (hardware, software). While North America currently holds a leading market share due to established research infrastructure and technological advancements, the Asia-Pacific region is expected to witness significant growth, driven by increasing research activities and expanding pharmaceutical industries in countries like China and India. Key players in this competitive landscape include Tecan Trading AG, Beckman Coulter Inc., AXXAM SpA, and others, constantly innovating to offer advanced technologies and integrated solutions.
The industry faces some challenges. The high cost of specialized equipment and software can present a barrier to entry for smaller research organizations. Furthermore, stringent regulatory requirements related to sample handling and data management impose compliance costs. However, these challenges are likely to be offset by the long-term growth drivers, namely the continued expansion of the pharmaceutical and biotechnology industries and the increasing adoption of automation and artificial intelligence in compound management workflows. The market's future trajectory is expected to be shaped by advancements in robotics, artificial intelligence-driven data analytics, and the development of novel sample storage technologies, promising to further enhance efficiency and reduce operational costs within the industry. The growing focus on personalized medicine and the increasing need for efficient sample tracking and management will also bolster market expansion in the coming years.
Compound Management Industry Market Report: 2019-2033
This comprehensive report provides an in-depth analysis of the Compound Management Industry, offering actionable insights for stakeholders across the value chain. With a study period spanning 2019-2033, a base year of 2025, and a forecast period of 2025-2033, this report leverages extensive data analysis to present a clear picture of market dynamics, key players, and future growth potential. The report covers a market valued at $XX Million in 2025, exhibiting a Compound Annual Growth Rate (CAGR) of XX% during the forecast period. Key segments analyzed include Other Compounds/Sample Storage Systems (Service), Chemical Compounds and Bio Samples (Sample Type), Drug Discovery, Gene Synthesis, Bio Banking, and Other Applications (Application), and Product (Type).
Compound Management Industry Market Concentration & Dynamics
The Compound Management Industry is characterized by a moderately concentrated market structure, with a few large players holding significant market share. Tecan Trading AG, Beckman Coulter Inc., and Hamilton Company, among others, are key players, each commanding a significant portion of the overall market. However, the market also features a number of smaller, specialized companies catering to niche applications. The industry witnesses continuous innovation, driven by advancements in automation, robotics, and software solutions for sample and compound management. Regulatory frameworks, particularly those related to data security and quality control, significantly influence industry practices. Substitute products, while limited, include manual sample handling methods, but the increasing demand for efficiency and high-throughput screening drives the adoption of automated systems. End-user trends show a growing preference for integrated solutions, offering seamless workflow management from sample preparation to data analysis. The historical period (2019-2024) saw approximately XX M&A deals, contributing to market consolidation. The estimated number of M&A deals for 2025 is predicted to be XX.
Compound Management Industry Industry Insights & Trends
The Compound Management Industry is experiencing robust growth, fueled by the increasing demand for efficient and reliable sample management solutions across various life science applications. The market size is estimated to reach $XX Million by 2025. The burgeoning pharmaceutical and biotechnology industries are key drivers, as researchers increasingly rely on high-throughput screening and automation to accelerate drug discovery and development processes. Technological advancements such as artificial intelligence (AI) and machine learning are creating new opportunities for improved data analysis and predictive modeling, further enhancing efficiency and accuracy. Furthermore, the growing adoption of cloud-based solutions for data management is transforming how researchers manage and access crucial information, contributing to greater collaboration and accessibility. Evolving consumer behavior leans toward integrated, modular systems that provide flexibility and scalability, allowing for customization based on specific research needs.
Key Markets & Segments Leading Compound Management Industry
The North American region holds a dominant position in the Compound Management Industry, accounting for approximately XX% of the global market share in 2025. This dominance is primarily driven by:
- Robust pharmaceutical and biotechnology sectors: High R&D spending and a strong focus on innovation fuel demand.
- Well-established infrastructure: Advanced research facilities and a skilled workforce provide a conducive environment.
- Favorable regulatory landscape: Supportive regulations promote technological advancements and market growth.
Europe is another significant market, with a strong presence of pharmaceutical companies and research institutions. Within the segment breakdown, Drug Discovery represents the largest application area, followed by BioBanking. The 'Product' type dominates the market, with services playing a supporting role. The Chemical Compounds sample type leads in terms of volume handled due to its extensive use in drug discovery.
Compound Management Industry Product Developments
Significant advancements in compound management technologies have led to the introduction of high-throughput systems, improved data management software, and integrated platforms. These innovations enable faster and more efficient workflows, enhanced data security, and better tracking of samples. Companies are focusing on developing user-friendly interfaces, robust data analytics capabilities, and cloud-based solutions to improve accessibility and collaborative efforts. This trend is key in enhancing competitiveness within the sector.
Challenges in the Compound Management Industry Market
The Compound Management Industry faces several challenges. Stringent regulatory requirements related to data integrity and sample handling necessitate significant investments in compliance measures. Supply chain disruptions, particularly related to specialized components and consumables, can impact the availability of products and services. Intense competition among established players and new entrants puts pressure on pricing and profitability, requiring companies to differentiate through innovative products and services. The overall impact of these challenges can be estimated as approximately a XX% reduction in overall growth each year, though this fluctuates according to external factors.
Forces Driving Compound Management Industry Growth
Several factors are driving the growth of the Compound Management Industry. Technological advancements in automation and robotics continuously improve efficiency and throughput. The increasing need for high-throughput screening and automation in drug discovery and development processes boosts market demand. Favorable government regulations and funding for research and development activities support industry expansion. Examples include grants for novel technologies within the BioBanking sector.
Challenges in the Compound Management Industry Market
Long-term growth will be propelled by strategic partnerships between compound management providers and pharmaceutical companies, enabling integration of solutions into larger research workflows. Continuous innovation, particularly in the area of AI-driven data analysis, will significantly improve the efficiency of research and development processes. Expansion into emerging markets, particularly in Asia-Pacific, presents significant growth opportunities.
Emerging Opportunities in Compound Management Industry
Emerging opportunities include the development of miniaturized systems for sample management, improving efficiency and reducing costs. The integration of artificial intelligence (AI) and machine learning offers promising avenues for automating data analysis and prediction, accelerating drug discovery. The growing demand for personalized medicine is creating a market for specialized sample management solutions tailored to individual patient needs.
Leading Players in the Compound Management Industry Sector
- Tecan Trading AG
- Beckman Coulter Inc.
- AXXAM SpA
- Titian Software Limited
- SPT Labtech
- Evotec
- LiCONiC AG
- Brooks Life Sciences
- Hamilton Company
- BioAscent
Key Milestones in Compound Management Industry Industry
- February 2021: SPT Labtech's acquisition of BioMicroLab strengthened its automation capabilities, impacting the competitive landscape.
- December 2020: Ziath's Datapaq 3.18 software launch improved sample management efficiency, enhancing workflow speed and accuracy.
Strategic Outlook for Compound Management Industry Market
The Compound Management Industry is poised for significant growth driven by ongoing technological advancements, increased R&D spending in the pharmaceutical and biotechnology sectors, and the growing demand for high-throughput screening and automation. Strategic partnerships, investments in innovative technologies, and expansion into new markets will be key to unlocking future growth potential. Companies focusing on integrated solutions and advanced data analytics will be well-positioned to capture significant market share in the years to come.
Compound Management Industry Segmentation
-
1. Type
-
1.1. Product
- 1.1.1. Automated Compounds/Sample Storage Systems
- 1.1.2. Automated Liquid Handling Systems
- 1.1.3. Other Compounds/Sample Storage Systems
- 1.2. Service
-
1.1. Product
-
2. Sample Type
- 2.1. Chemical Compounds
- 2.2. Bio Samples
-
3. Application
- 3.1. Drug Discovery
- 3.2. Gene Synthesis
- 3.3. Bio Banking
- 3.4. Other Applications
Compound Management Industry Segmentation By Geography
-
1. North America
- 1.1. United States
- 1.2. Canada
- 1.3. Mexico
-
2. Europe
- 2.1. Germany
- 2.2. United Kingdom
- 2.3. France
- 2.4. Italy
- 2.5. Spain
- 2.6. Rest of Europe
-
3. Asia Pacific
- 3.1. China
- 3.2. Japan
- 3.3. India
- 3.4. Australia
- 3.5. South Korea
- 3.6. Rest of Asia Pacific
-
4. Middle East and Africa
- 4.1. GCC
- 4.2. South Africa
- 4.3. Rest of Middle East and Africa
-
5. South America
- 5.1. Brazil
- 5.2. Argentina
- 5.3. Rest of South America
Compound Management Industry REPORT HIGHLIGHTS
| Aspects | Details |
|---|---|
| Study Period | 2019-2033 |
| Base Year | 2024 |
| Estimated Year | 2025 |
| Forecast Period | 2025-2033 |
| Historical Period | 2019-2024 |
| Growth Rate | CAGR of 14.70% from 2019-2033 |
| Segmentation |
|
Table of Contents
- 1. Introduction
- 1.1. Research Scope
- 1.2. Market Segmentation
- 1.3. Research Methodology
- 1.4. Definitions and Assumptions
- 2. Executive Summary
- 2.1. Introduction
- 3. Market Dynamics
- 3.1. Introduction
- 3.2. Market Drivers
- 3.2.1. Increasing Drug Discovery Activities; Growth in the Bio-pharmaceutical Industry; Technological Advancement and Favorable Reimbursement
- 3.3. Market Restrains
- 3.3.1. High Cost Associated with Compound Management
- 3.4. Market Trends
- 3.4.1. The Automated Storage Systems Segment is Expected to Dominate the Market Over the Forecast Period.
- 4. Market Factor Analysis
- 4.1. Porters Five Forces
- 4.2. Supply/Value Chain
- 4.3. PESTEL analysis
- 4.4. Market Entropy
- 4.5. Patent/Trademark Analysis
- 5. Global Compound Management Industry Analysis, Insights and Forecast, 2019-2031
- 5.1. Market Analysis, Insights and Forecast - by Type
- 5.1.1. Product
- 5.1.1.1. Automated Compounds/Sample Storage Systems
- 5.1.1.2. Automated Liquid Handling Systems
- 5.1.1.3. Other Compounds/Sample Storage Systems
- 5.1.2. Service
- 5.1.1. Product
- 5.2. Market Analysis, Insights and Forecast - by Sample Type
- 5.2.1. Chemical Compounds
- 5.2.2. Bio Samples
- 5.3. Market Analysis, Insights and Forecast - by Application
- 5.3.1. Drug Discovery
- 5.3.2. Gene Synthesis
- 5.3.3. Bio Banking
- 5.3.4. Other Applications
- 5.4. Market Analysis, Insights and Forecast - by Region
- 5.4.1. North America
- 5.4.2. Europe
- 5.4.3. Asia Pacific
- 5.4.4. Middle East and Africa
- 5.4.5. South America
- 5.1. Market Analysis, Insights and Forecast - by Type
- 6. North America Compound Management Industry Analysis, Insights and Forecast, 2019-2031
- 6.1. Market Analysis, Insights and Forecast - by Type
- 6.1.1. Product
- 6.1.1.1. Automated Compounds/Sample Storage Systems
- 6.1.1.2. Automated Liquid Handling Systems
- 6.1.1.3. Other Compounds/Sample Storage Systems
- 6.1.2. Service
- 6.1.1. Product
- 6.2. Market Analysis, Insights and Forecast - by Sample Type
- 6.2.1. Chemical Compounds
- 6.2.2. Bio Samples
- 6.3. Market Analysis, Insights and Forecast - by Application
- 6.3.1. Drug Discovery
- 6.3.2. Gene Synthesis
- 6.3.3. Bio Banking
- 6.3.4. Other Applications
- 6.1. Market Analysis, Insights and Forecast - by Type
- 7. Europe Compound Management Industry Analysis, Insights and Forecast, 2019-2031
- 7.1. Market Analysis, Insights and Forecast - by Type
- 7.1.1. Product
- 7.1.1.1. Automated Compounds/Sample Storage Systems
- 7.1.1.2. Automated Liquid Handling Systems
- 7.1.1.3. Other Compounds/Sample Storage Systems
- 7.1.2. Service
- 7.1.1. Product
- 7.2. Market Analysis, Insights and Forecast - by Sample Type
- 7.2.1. Chemical Compounds
- 7.2.2. Bio Samples
- 7.3. Market Analysis, Insights and Forecast - by Application
- 7.3.1. Drug Discovery
- 7.3.2. Gene Synthesis
- 7.3.3. Bio Banking
- 7.3.4. Other Applications
- 7.1. Market Analysis, Insights and Forecast - by Type
- 8. Asia Pacific Compound Management Industry Analysis, Insights and Forecast, 2019-2031
- 8.1. Market Analysis, Insights and Forecast - by Type
- 8.1.1. Product
- 8.1.1.1. Automated Compounds/Sample Storage Systems
- 8.1.1.2. Automated Liquid Handling Systems
- 8.1.1.3. Other Compounds/Sample Storage Systems
- 8.1.2. Service
- 8.1.1. Product
- 8.2. Market Analysis, Insights and Forecast - by Sample Type
- 8.2.1. Chemical Compounds
- 8.2.2. Bio Samples
- 8.3. Market Analysis, Insights and Forecast - by Application
- 8.3.1. Drug Discovery
- 8.3.2. Gene Synthesis
- 8.3.3. Bio Banking
- 8.3.4. Other Applications
- 8.1. Market Analysis, Insights and Forecast - by Type
- 9. Middle East and Africa Compound Management Industry Analysis, Insights and Forecast, 2019-2031
- 9.1. Market Analysis, Insights and Forecast - by Type
- 9.1.1. Product
- 9.1.1.1. Automated Compounds/Sample Storage Systems
- 9.1.1.2. Automated Liquid Handling Systems
- 9.1.1.3. Other Compounds/Sample Storage Systems
- 9.1.2. Service
- 9.1.1. Product
- 9.2. Market Analysis, Insights and Forecast - by Sample Type
- 9.2.1. Chemical Compounds
- 9.2.2. Bio Samples
- 9.3. Market Analysis, Insights and Forecast - by Application
- 9.3.1. Drug Discovery
- 9.3.2. Gene Synthesis
- 9.3.3. Bio Banking
- 9.3.4. Other Applications
- 9.1. Market Analysis, Insights and Forecast - by Type
- 10. South America Compound Management Industry Analysis, Insights and Forecast, 2019-2031
- 10.1. Market Analysis, Insights and Forecast - by Type
- 10.1.1. Product
- 10.1.1.1. Automated Compounds/Sample Storage Systems
- 10.1.1.2. Automated Liquid Handling Systems
- 10.1.1.3. Other Compounds/Sample Storage Systems
- 10.1.2. Service
- 10.1.1. Product
- 10.2. Market Analysis, Insights and Forecast - by Sample Type
- 10.2.1. Chemical Compounds
- 10.2.2. Bio Samples
- 10.3. Market Analysis, Insights and Forecast - by Application
- 10.3.1. Drug Discovery
- 10.3.2. Gene Synthesis
- 10.3.3. Bio Banking
- 10.3.4. Other Applications
- 10.1. Market Analysis, Insights and Forecast - by Type
- 11. North America Compound Management Industry Analysis, Insights and Forecast, 2019-2031
- 11.1. Market Analysis, Insights and Forecast - By Country/Sub-region
- 11.1.1. undefined
- 12. Europe Compound Management Industry Analysis, Insights and Forecast, 2019-2031
- 12.1. Market Analysis, Insights and Forecast - By Country/Sub-region
- 12.1.1. undefined
- 13. Asia Pacific Compound Management Industry Analysis, Insights and Forecast, 2019-2031
- 13.1. Market Analysis, Insights and Forecast - By Country/Sub-region
- 13.1.1. undefined
- 14. Middle East and Africa Compound Management Industry Analysis, Insights and Forecast, 2019-2031
- 14.1. Market Analysis, Insights and Forecast - By Country/Sub-region
- 14.1.1. undefined
- 15. South America Compound Management Industry Analysis, Insights and Forecast, 2019-2031
- 15.1. Market Analysis, Insights and Forecast - By Country/Sub-region
- 15.1.1. undefined
- 16. Competitive Analysis
- 16.1. Global Market Share Analysis 2024
- 16.2. Company Profiles
- 16.2.1 Tecan Trading AG
- 16.2.1.1. Overview
- 16.2.1.2. Products
- 16.2.1.3. SWOT Analysis
- 16.2.1.4. Recent Developments
- 16.2.1.5. Financials (Based on Availability)
- 16.2.2 Beckman Coulter Inc
- 16.2.2.1. Overview
- 16.2.2.2. Products
- 16.2.2.3. SWOT Analysis
- 16.2.2.4. Recent Developments
- 16.2.2.5. Financials (Based on Availability)
- 16.2.3 AXXAM SpA
- 16.2.3.1. Overview
- 16.2.3.2. Products
- 16.2.3.3. SWOT Analysis
- 16.2.3.4. Recent Developments
- 16.2.3.5. Financials (Based on Availability)
- 16.2.4 Titian Software Limited
- 16.2.4.1. Overview
- 16.2.4.2. Products
- 16.2.4.3. SWOT Analysis
- 16.2.4.4. Recent Developments
- 16.2.4.5. Financials (Based on Availability)
- 16.2.5 SPT Labtech
- 16.2.5.1. Overview
- 16.2.5.2. Products
- 16.2.5.3. SWOT Analysis
- 16.2.5.4. Recent Developments
- 16.2.5.5. Financials (Based on Availability)
- 16.2.6 Evotec
- 16.2.6.1. Overview
- 16.2.6.2. Products
- 16.2.6.3. SWOT Analysis
- 16.2.6.4. Recent Developments
- 16.2.6.5. Financials (Based on Availability)
- 16.2.7 LiCONiC AG
- 16.2.7.1. Overview
- 16.2.7.2. Products
- 16.2.7.3. SWOT Analysis
- 16.2.7.4. Recent Developments
- 16.2.7.5. Financials (Based on Availability)
- 16.2.8 Brooks Life Sciences
- 16.2.8.1. Overview
- 16.2.8.2. Products
- 16.2.8.3. SWOT Analysis
- 16.2.8.4. Recent Developments
- 16.2.8.5. Financials (Based on Availability)
- 16.2.9 Hamilton Company
- 16.2.9.1. Overview
- 16.2.9.2. Products
- 16.2.9.3. SWOT Analysis
- 16.2.9.4. Recent Developments
- 16.2.9.5. Financials (Based on Availability)
- 16.2.10 BioAscent
- 16.2.10.1. Overview
- 16.2.10.2. Products
- 16.2.10.3. SWOT Analysis
- 16.2.10.4. Recent Developments
- 16.2.10.5. Financials (Based on Availability)
- 16.2.1 Tecan Trading AG
List of Figures
- Figure 1: Global Compound Management Industry Revenue Breakdown (Million, %) by Region 2024 & 2032
- Figure 2: Global Compound Management Industry Volume Breakdown (K unit, %) by Region 2024 & 2032
- Figure 3: North America Compound Management Industry Revenue (Million), by Country 2024 & 2032
- Figure 4: North America Compound Management Industry Volume (K unit), by Country 2024 & 2032
- Figure 5: North America Compound Management Industry Revenue Share (%), by Country 2024 & 2032
- Figure 6: North America Compound Management Industry Volume Share (%), by Country 2024 & 2032
- Figure 7: Europe Compound Management Industry Revenue (Million), by Country 2024 & 2032
- Figure 8: Europe Compound Management Industry Volume (K unit), by Country 2024 & 2032
- Figure 9: Europe Compound Management Industry Revenue Share (%), by Country 2024 & 2032
- Figure 10: Europe Compound Management Industry Volume Share (%), by Country 2024 & 2032
- Figure 11: Asia Pacific Compound Management Industry Revenue (Million), by Country 2024 & 2032
- Figure 12: Asia Pacific Compound Management Industry Volume (K unit), by Country 2024 & 2032
- Figure 13: Asia Pacific Compound Management Industry Revenue Share (%), by Country 2024 & 2032
- Figure 14: Asia Pacific Compound Management Industry Volume Share (%), by Country 2024 & 2032
- Figure 15: Middle East and Africa Compound Management Industry Revenue (Million), by Country 2024 & 2032
- Figure 16: Middle East and Africa Compound Management Industry Volume (K unit), by Country 2024 & 2032
- Figure 17: Middle East and Africa Compound Management Industry Revenue Share (%), by Country 2024 & 2032
- Figure 18: Middle East and Africa Compound Management Industry Volume Share (%), by Country 2024 & 2032
- Figure 19: South America Compound Management Industry Revenue (Million), by Country 2024 & 2032
- Figure 20: South America Compound Management Industry Volume (K unit), by Country 2024 & 2032
- Figure 21: South America Compound Management Industry Revenue Share (%), by Country 2024 & 2032
- Figure 22: South America Compound Management Industry Volume Share (%), by Country 2024 & 2032
- Figure 23: North America Compound Management Industry Revenue (Million), by Type 2024 & 2032
- Figure 24: North America Compound Management Industry Volume (K unit), by Type 2024 & 2032
- Figure 25: North America Compound Management Industry Revenue Share (%), by Type 2024 & 2032
- Figure 26: North America Compound Management Industry Volume Share (%), by Type 2024 & 2032
- Figure 27: North America Compound Management Industry Revenue (Million), by Sample Type 2024 & 2032
- Figure 28: North America Compound Management Industry Volume (K unit), by Sample Type 2024 & 2032
- Figure 29: North America Compound Management Industry Revenue Share (%), by Sample Type 2024 & 2032
- Figure 30: North America Compound Management Industry Volume Share (%), by Sample Type 2024 & 2032
- Figure 31: North America Compound Management Industry Revenue (Million), by Application 2024 & 2032
- Figure 32: North America Compound Management Industry Volume (K unit), by Application 2024 & 2032
- Figure 33: North America Compound Management Industry Revenue Share (%), by Application 2024 & 2032
- Figure 34: North America Compound Management Industry Volume Share (%), by Application 2024 & 2032
- Figure 35: North America Compound Management Industry Revenue (Million), by Country 2024 & 2032
- Figure 36: North America Compound Management Industry Volume (K unit), by Country 2024 & 2032
- Figure 37: North America Compound Management Industry Revenue Share (%), by Country 2024 & 2032
- Figure 38: North America Compound Management Industry Volume Share (%), by Country 2024 & 2032
- Figure 39: Europe Compound Management Industry Revenue (Million), by Type 2024 & 2032
- Figure 40: Europe Compound Management Industry Volume (K unit), by Type 2024 & 2032
- Figure 41: Europe Compound Management Industry Revenue Share (%), by Type 2024 & 2032
- Figure 42: Europe Compound Management Industry Volume Share (%), by Type 2024 & 2032
- Figure 43: Europe Compound Management Industry Revenue (Million), by Sample Type 2024 & 2032
- Figure 44: Europe Compound Management Industry Volume (K unit), by Sample Type 2024 & 2032
- Figure 45: Europe Compound Management Industry Revenue Share (%), by Sample Type 2024 & 2032
- Figure 46: Europe Compound Management Industry Volume Share (%), by Sample Type 2024 & 2032
- Figure 47: Europe Compound Management Industry Revenue (Million), by Application 2024 & 2032
- Figure 48: Europe Compound Management Industry Volume (K unit), by Application 2024 & 2032
- Figure 49: Europe Compound Management Industry Revenue Share (%), by Application 2024 & 2032
- Figure 50: Europe Compound Management Industry Volume Share (%), by Application 2024 & 2032
- Figure 51: Europe Compound Management Industry Revenue (Million), by Country 2024 & 2032
- Figure 52: Europe Compound Management Industry Volume (K unit), by Country 2024 & 2032
- Figure 53: Europe Compound Management Industry Revenue Share (%), by Country 2024 & 2032
- Figure 54: Europe Compound Management Industry Volume Share (%), by Country 2024 & 2032
- Figure 55: Asia Pacific Compound Management Industry Revenue (Million), by Type 2024 & 2032
- Figure 56: Asia Pacific Compound Management Industry Volume (K unit), by Type 2024 & 2032
- Figure 57: Asia Pacific Compound Management Industry Revenue Share (%), by Type 2024 & 2032
- Figure 58: Asia Pacific Compound Management Industry Volume Share (%), by Type 2024 & 2032
- Figure 59: Asia Pacific Compound Management Industry Revenue (Million), by Sample Type 2024 & 2032
- Figure 60: Asia Pacific Compound Management Industry Volume (K unit), by Sample Type 2024 & 2032
- Figure 61: Asia Pacific Compound Management Industry Revenue Share (%), by Sample Type 2024 & 2032
- Figure 62: Asia Pacific Compound Management Industry Volume Share (%), by Sample Type 2024 & 2032
- Figure 63: Asia Pacific Compound Management Industry Revenue (Million), by Application 2024 & 2032
- Figure 64: Asia Pacific Compound Management Industry Volume (K unit), by Application 2024 & 2032
- Figure 65: Asia Pacific Compound Management Industry Revenue Share (%), by Application 2024 & 2032
- Figure 66: Asia Pacific Compound Management Industry Volume Share (%), by Application 2024 & 2032
- Figure 67: Asia Pacific Compound Management Industry Revenue (Million), by Country 2024 & 2032
- Figure 68: Asia Pacific Compound Management Industry Volume (K unit), by Country 2024 & 2032
- Figure 69: Asia Pacific Compound Management Industry Revenue Share (%), by Country 2024 & 2032
- Figure 70: Asia Pacific Compound Management Industry Volume Share (%), by Country 2024 & 2032
- Figure 71: Middle East and Africa Compound Management Industry Revenue (Million), by Type 2024 & 2032
- Figure 72: Middle East and Africa Compound Management Industry Volume (K unit), by Type 2024 & 2032
- Figure 73: Middle East and Africa Compound Management Industry Revenue Share (%), by Type 2024 & 2032
- Figure 74: Middle East and Africa Compound Management Industry Volume Share (%), by Type 2024 & 2032
- Figure 75: Middle East and Africa Compound Management Industry Revenue (Million), by Sample Type 2024 & 2032
- Figure 76: Middle East and Africa Compound Management Industry Volume (K unit), by Sample Type 2024 & 2032
- Figure 77: Middle East and Africa Compound Management Industry Revenue Share (%), by Sample Type 2024 & 2032
- Figure 78: Middle East and Africa Compound Management Industry Volume Share (%), by Sample Type 2024 & 2032
- Figure 79: Middle East and Africa Compound Management Industry Revenue (Million), by Application 2024 & 2032
- Figure 80: Middle East and Africa Compound Management Industry Volume (K unit), by Application 2024 & 2032
- Figure 81: Middle East and Africa Compound Management Industry Revenue Share (%), by Application 2024 & 2032
- Figure 82: Middle East and Africa Compound Management Industry Volume Share (%), by Application 2024 & 2032
- Figure 83: Middle East and Africa Compound Management Industry Revenue (Million), by Country 2024 & 2032
- Figure 84: Middle East and Africa Compound Management Industry Volume (K unit), by Country 2024 & 2032
- Figure 85: Middle East and Africa Compound Management Industry Revenue Share (%), by Country 2024 & 2032
- Figure 86: Middle East and Africa Compound Management Industry Volume Share (%), by Country 2024 & 2032
- Figure 87: South America Compound Management Industry Revenue (Million), by Type 2024 & 2032
- Figure 88: South America Compound Management Industry Volume (K unit), by Type 2024 & 2032
- Figure 89: South America Compound Management Industry Revenue Share (%), by Type 2024 & 2032
- Figure 90: South America Compound Management Industry Volume Share (%), by Type 2024 & 2032
- Figure 91: South America Compound Management Industry Revenue (Million), by Sample Type 2024 & 2032
- Figure 92: South America Compound Management Industry Volume (K unit), by Sample Type 2024 & 2032
- Figure 93: South America Compound Management Industry Revenue Share (%), by Sample Type 2024 & 2032
- Figure 94: South America Compound Management Industry Volume Share (%), by Sample Type 2024 & 2032
- Figure 95: South America Compound Management Industry Revenue (Million), by Application 2024 & 2032
- Figure 96: South America Compound Management Industry Volume (K unit), by Application 2024 & 2032
- Figure 97: South America Compound Management Industry Revenue Share (%), by Application 2024 & 2032
- Figure 98: South America Compound Management Industry Volume Share (%), by Application 2024 & 2032
- Figure 99: South America Compound Management Industry Revenue (Million), by Country 2024 & 2032
- Figure 100: South America Compound Management Industry Volume (K unit), by Country 2024 & 2032
- Figure 101: South America Compound Management Industry Revenue Share (%), by Country 2024 & 2032
- Figure 102: South America Compound Management Industry Volume Share (%), by Country 2024 & 2032
List of Tables
- Table 1: Global Compound Management Industry Revenue Million Forecast, by Region 2019 & 2032
- Table 2: Global Compound Management Industry Volume K unit Forecast, by Region 2019 & 2032
- Table 3: Global Compound Management Industry Revenue Million Forecast, by Type 2019 & 2032
- Table 4: Global Compound Management Industry Volume K unit Forecast, by Type 2019 & 2032
- Table 5: Global Compound Management Industry Revenue Million Forecast, by Sample Type 2019 & 2032
- Table 6: Global Compound Management Industry Volume K unit Forecast, by Sample Type 2019 & 2032
- Table 7: Global Compound Management Industry Revenue Million Forecast, by Application 2019 & 2032
- Table 8: Global Compound Management Industry Volume K unit Forecast, by Application 2019 & 2032
- Table 9: Global Compound Management Industry Revenue Million Forecast, by Region 2019 & 2032
- Table 10: Global Compound Management Industry Volume K unit Forecast, by Region 2019 & 2032
- Table 11: Global Compound Management Industry Revenue Million Forecast, by Country 2019 & 2032
- Table 12: Global Compound Management Industry Volume K unit Forecast, by Country 2019 & 2032
- Table 13: Global Compound Management Industry Revenue Million Forecast, by Country 2019 & 2032
- Table 14: Global Compound Management Industry Volume K unit Forecast, by Country 2019 & 2032
- Table 15: Global Compound Management Industry Revenue Million Forecast, by Country 2019 & 2032
- Table 16: Global Compound Management Industry Volume K unit Forecast, by Country 2019 & 2032
- Table 17: Global Compound Management Industry Revenue Million Forecast, by Country 2019 & 2032
- Table 18: Global Compound Management Industry Volume K unit Forecast, by Country 2019 & 2032
- Table 19: Global Compound Management Industry Revenue Million Forecast, by Country 2019 & 2032
- Table 20: Global Compound Management Industry Volume K unit Forecast, by Country 2019 & 2032
- Table 21: Global Compound Management Industry Revenue Million Forecast, by Type 2019 & 2032
- Table 22: Global Compound Management Industry Volume K unit Forecast, by Type 2019 & 2032
- Table 23: Global Compound Management Industry Revenue Million Forecast, by Sample Type 2019 & 2032
- Table 24: Global Compound Management Industry Volume K unit Forecast, by Sample Type 2019 & 2032
- Table 25: Global Compound Management Industry Revenue Million Forecast, by Application 2019 & 2032
- Table 26: Global Compound Management Industry Volume K unit Forecast, by Application 2019 & 2032
- Table 27: Global Compound Management Industry Revenue Million Forecast, by Country 2019 & 2032
- Table 28: Global Compound Management Industry Volume K unit Forecast, by Country 2019 & 2032
- Table 29: United States Compound Management Industry Revenue (Million) Forecast, by Application 2019 & 2032
- Table 30: United States Compound Management Industry Volume (K unit) Forecast, by Application 2019 & 2032
- Table 31: Canada Compound Management Industry Revenue (Million) Forecast, by Application 2019 & 2032
- Table 32: Canada Compound Management Industry Volume (K unit) Forecast, by Application 2019 & 2032
- Table 33: Mexico Compound Management Industry Revenue (Million) Forecast, by Application 2019 & 2032
- Table 34: Mexico Compound Management Industry Volume (K unit) Forecast, by Application 2019 & 2032
- Table 35: Global Compound Management Industry Revenue Million Forecast, by Type 2019 & 2032
- Table 36: Global Compound Management Industry Volume K unit Forecast, by Type 2019 & 2032
- Table 37: Global Compound Management Industry Revenue Million Forecast, by Sample Type 2019 & 2032
- Table 38: Global Compound Management Industry Volume K unit Forecast, by Sample Type 2019 & 2032
- Table 39: Global Compound Management Industry Revenue Million Forecast, by Application 2019 & 2032
- Table 40: Global Compound Management Industry Volume K unit Forecast, by Application 2019 & 2032
- Table 41: Global Compound Management Industry Revenue Million Forecast, by Country 2019 & 2032
- Table 42: Global Compound Management Industry Volume K unit Forecast, by Country 2019 & 2032
- Table 43: Germany Compound Management Industry Revenue (Million) Forecast, by Application 2019 & 2032
- Table 44: Germany Compound Management Industry Volume (K unit) Forecast, by Application 2019 & 2032
- Table 45: United Kingdom Compound Management Industry Revenue (Million) Forecast, by Application 2019 & 2032
- Table 46: United Kingdom Compound Management Industry Volume (K unit) Forecast, by Application 2019 & 2032
- Table 47: France Compound Management Industry Revenue (Million) Forecast, by Application 2019 & 2032
- Table 48: France Compound Management Industry Volume (K unit) Forecast, by Application 2019 & 2032
- Table 49: Italy Compound Management Industry Revenue (Million) Forecast, by Application 2019 & 2032
- Table 50: Italy Compound Management Industry Volume (K unit) Forecast, by Application 2019 & 2032
- Table 51: Spain Compound Management Industry Revenue (Million) Forecast, by Application 2019 & 2032
- Table 52: Spain Compound Management Industry Volume (K unit) Forecast, by Application 2019 & 2032
- Table 53: Rest of Europe Compound Management Industry Revenue (Million) Forecast, by Application 2019 & 2032
- Table 54: Rest of Europe Compound Management Industry Volume (K unit) Forecast, by Application 2019 & 2032
- Table 55: Global Compound Management Industry Revenue Million Forecast, by Type 2019 & 2032
- Table 56: Global Compound Management Industry Volume K unit Forecast, by Type 2019 & 2032
- Table 57: Global Compound Management Industry Revenue Million Forecast, by Sample Type 2019 & 2032
- Table 58: Global Compound Management Industry Volume K unit Forecast, by Sample Type 2019 & 2032
- Table 59: Global Compound Management Industry Revenue Million Forecast, by Application 2019 & 2032
- Table 60: Global Compound Management Industry Volume K unit Forecast, by Application 2019 & 2032
- Table 61: Global Compound Management Industry Revenue Million Forecast, by Country 2019 & 2032
- Table 62: Global Compound Management Industry Volume K unit Forecast, by Country 2019 & 2032
- Table 63: China Compound Management Industry Revenue (Million) Forecast, by Application 2019 & 2032
- Table 64: China Compound Management Industry Volume (K unit) Forecast, by Application 2019 & 2032
- Table 65: Japan Compound Management Industry Revenue (Million) Forecast, by Application 2019 & 2032
- Table 66: Japan Compound Management Industry Volume (K unit) Forecast, by Application 2019 & 2032
- Table 67: India Compound Management Industry Revenue (Million) Forecast, by Application 2019 & 2032
- Table 68: India Compound Management Industry Volume (K unit) Forecast, by Application 2019 & 2032
- Table 69: Australia Compound Management Industry Revenue (Million) Forecast, by Application 2019 & 2032
- Table 70: Australia Compound Management Industry Volume (K unit) Forecast, by Application 2019 & 2032
- Table 71: South Korea Compound Management Industry Revenue (Million) Forecast, by Application 2019 & 2032
- Table 72: South Korea Compound Management Industry Volume (K unit) Forecast, by Application 2019 & 2032
- Table 73: Rest of Asia Pacific Compound Management Industry Revenue (Million) Forecast, by Application 2019 & 2032
- Table 74: Rest of Asia Pacific Compound Management Industry Volume (K unit) Forecast, by Application 2019 & 2032
- Table 75: Global Compound Management Industry Revenue Million Forecast, by Type 2019 & 2032
- Table 76: Global Compound Management Industry Volume K unit Forecast, by Type 2019 & 2032
- Table 77: Global Compound Management Industry Revenue Million Forecast, by Sample Type 2019 & 2032
- Table 78: Global Compound Management Industry Volume K unit Forecast, by Sample Type 2019 & 2032
- Table 79: Global Compound Management Industry Revenue Million Forecast, by Application 2019 & 2032
- Table 80: Global Compound Management Industry Volume K unit Forecast, by Application 2019 & 2032
- Table 81: Global Compound Management Industry Revenue Million Forecast, by Country 2019 & 2032
- Table 82: Global Compound Management Industry Volume K unit Forecast, by Country 2019 & 2032
- Table 83: GCC Compound Management Industry Revenue (Million) Forecast, by Application 2019 & 2032
- Table 84: GCC Compound Management Industry Volume (K unit) Forecast, by Application 2019 & 2032
- Table 85: South Africa Compound Management Industry Revenue (Million) Forecast, by Application 2019 & 2032
- Table 86: South Africa Compound Management Industry Volume (K unit) Forecast, by Application 2019 & 2032
- Table 87: Rest of Middle East and Africa Compound Management Industry Revenue (Million) Forecast, by Application 2019 & 2032
- Table 88: Rest of Middle East and Africa Compound Management Industry Volume (K unit) Forecast, by Application 2019 & 2032
- Table 89: Global Compound Management Industry Revenue Million Forecast, by Type 2019 & 2032
- Table 90: Global Compound Management Industry Volume K unit Forecast, by Type 2019 & 2032
- Table 91: Global Compound Management Industry Revenue Million Forecast, by Sample Type 2019 & 2032
- Table 92: Global Compound Management Industry Volume K unit Forecast, by Sample Type 2019 & 2032
- Table 93: Global Compound Management Industry Revenue Million Forecast, by Application 2019 & 2032
- Table 94: Global Compound Management Industry Volume K unit Forecast, by Application 2019 & 2032
- Table 95: Global Compound Management Industry Revenue Million Forecast, by Country 2019 & 2032
- Table 96: Global Compound Management Industry Volume K unit Forecast, by Country 2019 & 2032
- Table 97: Brazil Compound Management Industry Revenue (Million) Forecast, by Application 2019 & 2032
- Table 98: Brazil Compound Management Industry Volume (K unit) Forecast, by Application 2019 & 2032
- Table 99: Argentina Compound Management Industry Revenue (Million) Forecast, by Application 2019 & 2032
- Table 100: Argentina Compound Management Industry Volume (K unit) Forecast, by Application 2019 & 2032
- Table 101: Rest of South America Compound Management Industry Revenue (Million) Forecast, by Application 2019 & 2032
- Table 102: Rest of South America Compound Management Industry Volume (K unit) Forecast, by Application 2019 & 2032
Frequently Asked Questions
1. What is the projected Compound Annual Growth Rate (CAGR) of the Compound Management Industry?
The projected CAGR is approximately 14.70%.
2. Which companies are prominent players in the Compound Management Industry?
Key companies in the market include Tecan Trading AG, Beckman Coulter Inc, AXXAM SpA, Titian Software Limited, SPT Labtech, Evotec, LiCONiC AG, Brooks Life Sciences, Hamilton Company, BioAscent.
3. What are the main segments of the Compound Management Industry?
The market segments include Type, Sample Type, Application.
4. Can you provide details about the market size?
The market size is estimated to be USD XX Million as of 2022.
5. What are some drivers contributing to market growth?
Increasing Drug Discovery Activities; Growth in the Bio-pharmaceutical Industry; Technological Advancement and Favorable Reimbursement.
6. What are the notable trends driving market growth?
The Automated Storage Systems Segment is Expected to Dominate the Market Over the Forecast Period..
7. Are there any restraints impacting market growth?
High Cost Associated with Compound Management.
8. Can you provide examples of recent developments in the market?
February 2021: SPT Labtech announced the acquisition of BioMicroLab, a robotics automation provider, to strengthen its capabilities in automatic sample management.
9. What pricing options are available for accessing the report?
Pricing options include single-user, multi-user, and enterprise licenses priced at USD 4750, USD 5250, and USD 8750 respectively.
10. Is the market size provided in terms of value or volume?
The market size is provided in terms of value, measured in Million and volume, measured in K unit.
11. Are there any specific market keywords associated with the report?
Yes, the market keyword associated with the report is "Compound Management Industry," which aids in identifying and referencing the specific market segment covered.
12. How do I determine which pricing option suits my needs best?
The pricing options vary based on user requirements and access needs. Individual users may opt for single-user licenses, while businesses requiring broader access may choose multi-user or enterprise licenses for cost-effective access to the report.
13. Are there any additional resources or data provided in the Compound Management Industry report?
While the report offers comprehensive insights, it's advisable to review the specific contents or supplementary materials provided to ascertain if additional resources or data are available.
14. How can I stay updated on further developments or reports in the Compound Management Industry?
To stay informed about further developments, trends, and reports in the Compound Management Industry, consider subscribing to industry newsletters, following relevant companies and organizations, or regularly checking reputable industry news sources and publications.
Methodology
Step 1 - Identification of Relevant Samples Size from Population Database


Step 2 - Approaches for Defining Global Market Size (Value, Volume* & Price*)

Note*: In applicable scenarios
Step 3 - Data Sources
Primary Research
- Web Analytics
- Survey Reports
- Research Institute
- Latest Research Reports
- Opinion Leaders
Secondary Research
- Annual Reports
- White Paper
- Latest Press Release
- Industry Association
- Paid Database
- Investor Presentations

Step 4 - Data Triangulation
Involves using different sources of information in order to increase the validity of a study
These sources are likely to be stakeholders in a program - participants, other researchers, program staff, other community members, and so on.
Then we put all data in single framework & apply various statistical tools to find out the dynamic on the market.
During the analysis stage, feedback from the stakeholder groups would be compared to determine areas of agreement as well as areas of divergence
