

Key Insights
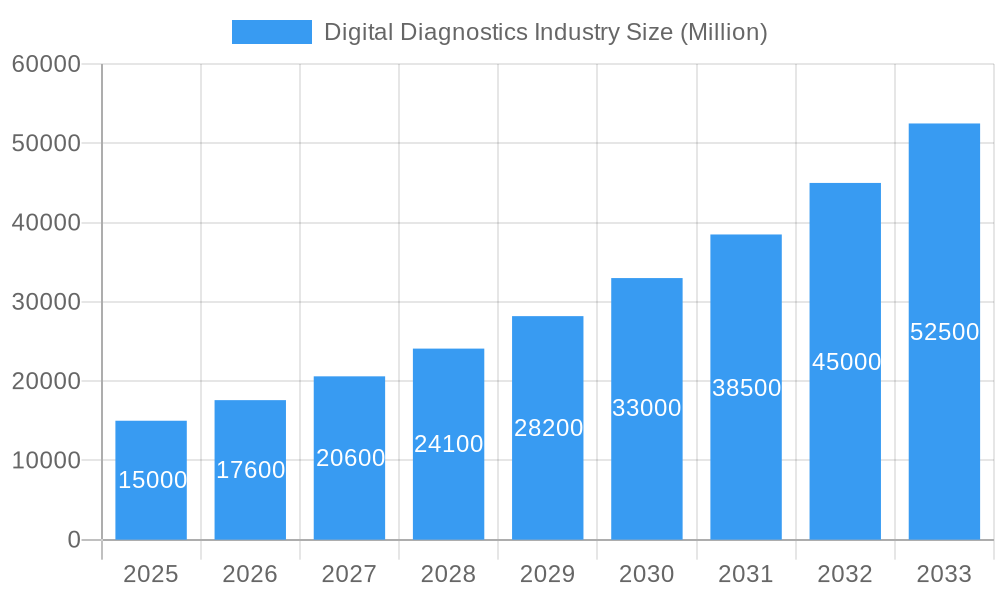
The digital diagnostics market is experiencing robust growth, projected to reach a significant value by 2033, driven by a 17.23% Compound Annual Growth Rate (CAGR). This expansion is fueled by several key factors. Technological advancements in areas like artificial intelligence (AI) and machine learning (ML) are enabling faster, more accurate, and cost-effective diagnostic solutions. The increasing prevalence of chronic diseases globally necessitates efficient diagnostic tools, further boosting market demand. Furthermore, the rising adoption of telehealth and remote patient monitoring systems is creating new avenues for digital diagnostic applications, particularly in underserved regions. The integration of digital diagnostics into existing healthcare workflows improves efficiency, reduces operational costs, and enhances patient care. Growth is particularly strong in segments like cardiology and oncology, due to the complexity and high volume of diagnostic procedures in these areas. Hardware segments, including advanced imaging equipment and portable diagnostic devices, are also driving significant revenue generation.
Digital Diagnostics Industry Market Size (In Billion)
However, market growth faces some challenges. High initial investment costs associated with implementing new digital diagnostic technologies can be a barrier for smaller healthcare providers. Data security and privacy concerns related to the handling of sensitive patient information remain a critical consideration, requiring robust cybersecurity measures. Regulatory hurdles and the need for rigorous validation of new diagnostic algorithms also impact market penetration. Despite these challenges, the long-term outlook for the digital diagnostics market remains positive, with continued innovation and increasing adoption expected to drive substantial growth across various segments and geographical regions. The market is expected to see significant diversification with the emergence of new players offering specialized solutions and further consolidation among existing large players who are investing heavily in R&D.
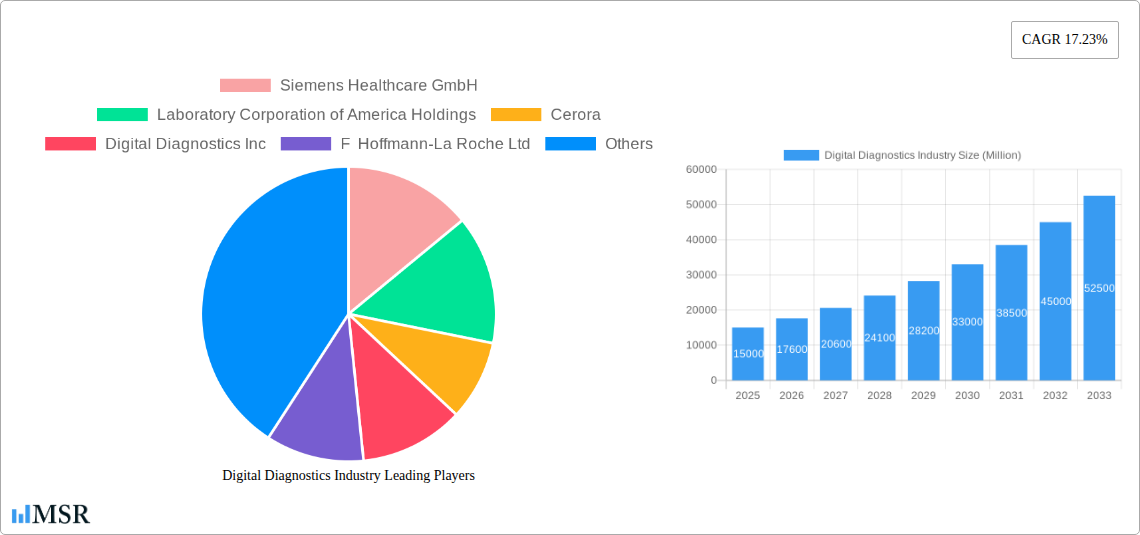
Digital Diagnostics Industry Company Market Share
Digital Diagnostics Industry: A Comprehensive Market Report (2019-2033)
This comprehensive report provides an in-depth analysis of the Digital Diagnostics Industry, offering invaluable insights for stakeholders, investors, and industry professionals. Covering the period from 2019 to 2033, with a focus on 2025, this report meticulously examines market dynamics, key players, emerging trends, and future growth potential. The global digital diagnostics market is projected to reach USD xx Million by 2033, exhibiting a robust CAGR of xx% during the forecast period (2025-2033).
Digital Diagnostics Industry Market Concentration & Dynamics
The digital diagnostics market is characterized by a moderately concentrated landscape, with key players like Siemens Healthcare GmbH, Laboratory Corporation of America Holdings, F Hoffmann-La Roche Ltd, and GE Healthcare holding significant market share. However, the emergence of innovative startups and smaller players is increasing competition. The market is driven by continuous technological advancements, particularly in AI and machine learning, leading to improved diagnostic accuracy and efficiency.
- Market Concentration: The top 5 players collectively hold approximately xx% of the global market share in 2025.
- Innovation Ecosystems: Strong R&D investments and collaborations between established players and technology startups are fueling innovation.
- Regulatory Frameworks: Stringent regulatory approvals and data privacy regulations are shaping market dynamics.
- Substitute Products: Traditional diagnostic methods still pose competition, although digital solutions offer advantages in terms of speed, accuracy, and accessibility.
- End-User Trends: The increasing adoption of telemedicine and remote patient monitoring is creating new opportunities for digital diagnostic solutions.
- M&A Activities: The historical period (2019-2024) witnessed approximately xx M&A deals in the digital diagnostics sector, indicating a high level of consolidation.
Digital Diagnostics Industry Industry Insights & Trends
The global digital diagnostics market is experiencing substantial growth, driven by several factors. The increasing prevalence of chronic diseases, the growing demand for faster and more accurate diagnostic solutions, and the rising adoption of digital health technologies are key drivers. The market size reached USD xx Million in 2024 and is projected to reach USD xx Million in 2025. Technological advancements such as AI-powered image analysis, cloud-based platforms, and point-of-care diagnostics are significantly impacting the industry. Evolving consumer behavior, including a preference for convenient and accessible healthcare services, further fuels market expansion. The integration of digital diagnostics into telehealth platforms is also accelerating market penetration. This trend reflects a broader shift towards personalized and preventative healthcare.
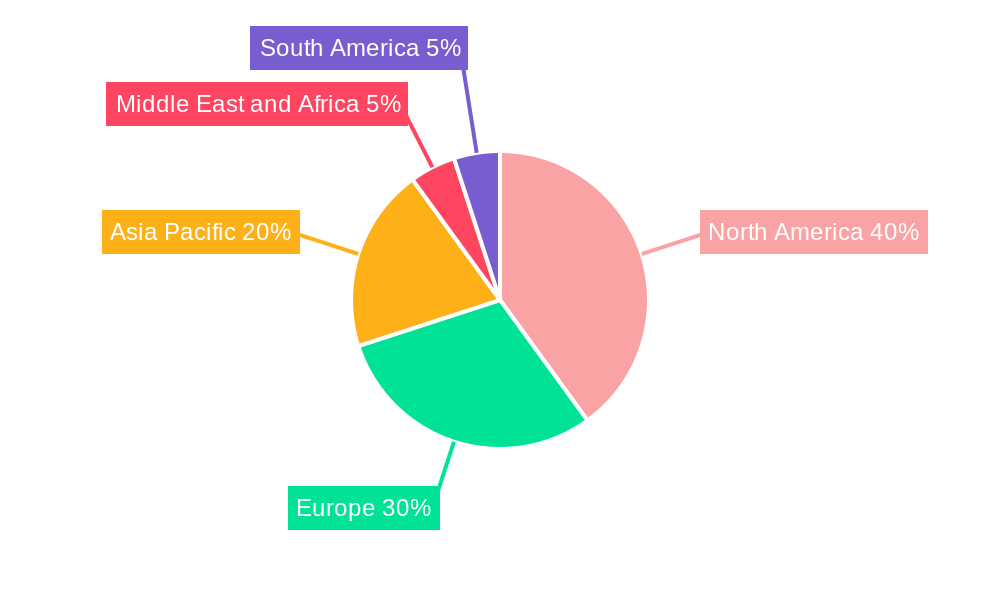
Key Markets & Segments Leading Digital Diagnostics Industry
North America currently dominates the global digital diagnostics market, driven by factors including robust healthcare infrastructure, high technological adoption rates, and substantial investments in R&D. However, Asia-Pacific is projected to witness the fastest growth due to increasing healthcare spending and expanding digital healthcare initiatives.
By Product:
- Software: The software segment is experiencing rapid growth due to its ability to enhance the efficiency and accuracy of diagnostic procedures.
- Hardware: The hardware segment is also growing significantly, driven by innovations in imaging technologies and point-of-care devices.
- Services: The services segment, including data analytics and remote monitoring, is gaining traction due to the increasing need for support and maintenance of digital diagnostic systems.
By Diagnosis Type:
- Cardiology: This segment holds a significant share, driven by the increasing prevalence of cardiovascular diseases and technological advancements in cardiac imaging.
- Oncology: The oncology segment is rapidly growing due to the increasing need for precise and early cancer detection.
- Radiology: This segment remains a dominant force, with advancements in digital imaging and AI-powered image analysis fueling its growth.
By End User:
- Hospitals and Clinics: Hospitals and clinics represent the largest end-user segment.
- Clinical Laboratories: Clinical laboratories play a crucial role in digital diagnostics, driving significant demand for advanced testing equipment and software.
Drivers:
- Economic growth and rising disposable incomes are boosting healthcare spending.
- Government initiatives promoting the adoption of digital healthcare technologies are further driving market expansion.
- Rapid advancements in imaging techniques and AI algorithms contribute to faster and more accurate diagnosis.
Digital Diagnostics Industry Product Developments
Recent product innovations include AI-powered diagnostic tools, cloud-based diagnostic platforms, and point-of-care testing devices. These advancements provide faster, more accurate, and convenient diagnostic services, improving patient care and workflow efficiency. The integration of machine learning and deep learning algorithms further enhances the diagnostic capabilities of these systems, granting a competitive edge to companies offering these improved solutions.
Challenges in the Digital Diagnostics Industry Market
The digital diagnostics market faces challenges including stringent regulatory approvals, high initial investment costs, and the need for skilled professionals to operate and interpret digital diagnostic tools. Cybersecurity concerns related to data privacy and the integration of various digital health platforms also pose significant challenges. Supply chain disruptions can affect the availability of essential components, impacting the production and delivery of diagnostic systems, causing a projected xx% reduction in market growth in 2026.
Forces Driving Digital Diagnostics Industry Growth
Key growth drivers include the rising prevalence of chronic diseases, increasing demand for accurate and rapid diagnostics, technological advancements in AI and machine learning, government initiatives to support digital healthcare, and the expanding adoption of telehealth services. For instance, the increase in funding for AI-powered diagnostic tools reflects the industry's growth trajectory.
Long-Term Growth Catalysts in the Digital Diagnostics Industry
Long-term growth will be driven by continued innovation in AI and machine learning, strategic partnerships between technology companies and healthcare providers, and the expansion of digital diagnostics into emerging markets. The development of novel diagnostic platforms with increased accessibility and affordability will further fuel market growth.
Emerging Opportunities in Digital Diagnostics Industry
Emerging opportunities lie in the development of personalized medicine approaches, the integration of digital diagnostics into wearable devices, and the expansion of point-of-care testing capabilities. The increasing adoption of remote patient monitoring and telehealth services also offers significant growth potential. Furthermore, exploring new diagnostic applications in underserved regions presents promising opportunities.
Leading Players in the Digital Diagnostics Industry Sector
- Siemens Healthcare GmbH
- Laboratory Corporation of America Holdings
- Cerora
- Digital Diagnostics Inc
- F Hoffmann-La Roche Ltd
- GE Healthcare
- Vuno Inc
- Midmark Corporation
- Nanox Imaging Ltd
- Novasignal Corporation
- Riverain Technologies
- ThermoFisher Scientific Inc
Key Milestones in Digital Diagnostics Industry Industry
- May 2022: TestCard secures USD 10 million in funding to commercialize existing products and launch new tests (diabetes, pregnancy, CKD, flu). This signals increasing investor confidence in the digital diagnostics space, particularly point-of-care solutions.
- February 2022: Labcorp launches Labcorp OnDemand, an online platform for ordering and home sample collection, enhancing accessibility to diagnostic testing and influencing consumer behavior.
Strategic Outlook for Digital Diagnostics Industry Market
The digital diagnostics market is poised for sustained growth, driven by technological advancements, increasing healthcare spending, and a growing preference for convenient and accessible healthcare solutions. Strategic opportunities lie in developing innovative diagnostic tools, expanding into new markets, and forging strategic partnerships to capitalize on the rapidly evolving healthcare landscape. The focus on personalized and preventative care presents significant long-term growth potential.
Digital Diagnostics Industry Segmentation
-
1. Product
- 1.1. Hardware
- 1.2. Software
- 1.3. Services
-
2. Diagnosis Type
- 2.1. Cardiology
- 2.2. Oncology
- 2.3. Neurology
- 2.4. Radiology
- 2.5. Pathology
- 2.6. Others
-
3. End User
- 3.1. Hospitals and Clinics
- 3.2. Clinical Laboratories
- 3.3. Others
Digital Diagnostics Industry Segmentation By Geography
-
1. North America
- 1.1. United States
- 1.2. Canada
- 1.3. Mexico
-
2. Europe
- 2.1. Germany
- 2.2. United Kingdom
- 2.3. France
- 2.4. Italy
- 2.5. Spain
- 2.6. Rest of Europe
-
3. Asia Pacific
- 3.1. China
- 3.2. Japan
- 3.3. India
- 3.4. Australia
- 3.5. South Korea
- 3.6. Rest of Asia Pacific
-
4. Middle East and Africa
- 4.1. GCC
- 4.2. South Africa
- 4.3. Rest of Middle East and Africa
-
5. South America
- 5.1. Brazil
- 5.2. Argentina
- 5.3. Rest of South America
Digital Diagnostics Industry Regional Market Share
Geographic Coverage of Digital Diagnostics Industry
Digital Diagnostics Industry REPORT HIGHLIGHTS
| Aspects | Details |
|---|---|
| Study Period | 2020-2034 |
| Base Year | 2025 |
| Estimated Year | 2026 |
| Forecast Period | 2026-2034 |
| Historical Period | 2020-2025 |
| Growth Rate | CAGR of 18.08% from 2020-2034 |
| Segmentation |
|
Table of Contents
- 1. Introduction
- 1.1. Research Scope
- 1.2. Market Segmentation
- 1.3. Research Methodology
- 1.4. Definitions and Assumptions
- 2. Executive Summary
- 2.1. Introduction
- 3. Market Dynamics
- 3.1. Introduction
- 3.2. Market Drivers
- 3.2.1. Rising Adoption of Digitalization in Chronic Disease Management; Increasing Burden of Chronic Diseases
- 3.3. Market Restrains
- 3.3.1. High Cost of Instruments
- 3.4. Market Trends
- 3.4.1. Oncology Segment is Expected to Account for the Large Market Share During the Forecast Period
- 4. Market Factor Analysis
- 4.1. Porters Five Forces
- 4.2. Supply/Value Chain
- 4.3. PESTEL analysis
- 4.4. Market Entropy
- 4.5. Patent/Trademark Analysis
- 5. Global Digital Diagnostics Industry Analysis, Insights and Forecast, 2020-2032
- 5.1. Market Analysis, Insights and Forecast - by Product
- 5.1.1. Hardware
- 5.1.2. Software
- 5.1.3. Services
- 5.2. Market Analysis, Insights and Forecast - by Diagnosis Type
- 5.2.1. Cardiology
- 5.2.2. Oncology
- 5.2.3. Neurology
- 5.2.4. Radiology
- 5.2.5. Pathology
- 5.2.6. Others
- 5.3. Market Analysis, Insights and Forecast - by End User
- 5.3.1. Hospitals and Clinics
- 5.3.2. Clinical Laboratories
- 5.3.3. Others
- 5.4. Market Analysis, Insights and Forecast - by Region
- 5.4.1. North America
- 5.4.2. Europe
- 5.4.3. Asia Pacific
- 5.4.4. Middle East and Africa
- 5.4.5. South America
- 5.1. Market Analysis, Insights and Forecast - by Product
- 6. North America Digital Diagnostics Industry Analysis, Insights and Forecast, 2020-2032
- 6.1. Market Analysis, Insights and Forecast - by Product
- 6.1.1. Hardware
- 6.1.2. Software
- 6.1.3. Services
- 6.2. Market Analysis, Insights and Forecast - by Diagnosis Type
- 6.2.1. Cardiology
- 6.2.2. Oncology
- 6.2.3. Neurology
- 6.2.4. Radiology
- 6.2.5. Pathology
- 6.2.6. Others
- 6.3. Market Analysis, Insights and Forecast - by End User
- 6.3.1. Hospitals and Clinics
- 6.3.2. Clinical Laboratories
- 6.3.3. Others
- 6.1. Market Analysis, Insights and Forecast - by Product
- 7. Europe Digital Diagnostics Industry Analysis, Insights and Forecast, 2020-2032
- 7.1. Market Analysis, Insights and Forecast - by Product
- 7.1.1. Hardware
- 7.1.2. Software
- 7.1.3. Services
- 7.2. Market Analysis, Insights and Forecast - by Diagnosis Type
- 7.2.1. Cardiology
- 7.2.2. Oncology
- 7.2.3. Neurology
- 7.2.4. Radiology
- 7.2.5. Pathology
- 7.2.6. Others
- 7.3. Market Analysis, Insights and Forecast - by End User
- 7.3.1. Hospitals and Clinics
- 7.3.2. Clinical Laboratories
- 7.3.3. Others
- 7.1. Market Analysis, Insights and Forecast - by Product
- 8. Asia Pacific Digital Diagnostics Industry Analysis, Insights and Forecast, 2020-2032
- 8.1. Market Analysis, Insights and Forecast - by Product
- 8.1.1. Hardware
- 8.1.2. Software
- 8.1.3. Services
- 8.2. Market Analysis, Insights and Forecast - by Diagnosis Type
- 8.2.1. Cardiology
- 8.2.2. Oncology
- 8.2.3. Neurology
- 8.2.4. Radiology
- 8.2.5. Pathology
- 8.2.6. Others
- 8.3. Market Analysis, Insights and Forecast - by End User
- 8.3.1. Hospitals and Clinics
- 8.3.2. Clinical Laboratories
- 8.3.3. Others
- 8.1. Market Analysis, Insights and Forecast - by Product
- 9. Middle East and Africa Digital Diagnostics Industry Analysis, Insights and Forecast, 2020-2032
- 9.1. Market Analysis, Insights and Forecast - by Product
- 9.1.1. Hardware
- 9.1.2. Software
- 9.1.3. Services
- 9.2. Market Analysis, Insights and Forecast - by Diagnosis Type
- 9.2.1. Cardiology
- 9.2.2. Oncology
- 9.2.3. Neurology
- 9.2.4. Radiology
- 9.2.5. Pathology
- 9.2.6. Others
- 9.3. Market Analysis, Insights and Forecast - by End User
- 9.3.1. Hospitals and Clinics
- 9.3.2. Clinical Laboratories
- 9.3.3. Others
- 9.1. Market Analysis, Insights and Forecast - by Product
- 10. South America Digital Diagnostics Industry Analysis, Insights and Forecast, 2020-2032
- 10.1. Market Analysis, Insights and Forecast - by Product
- 10.1.1. Hardware
- 10.1.2. Software
- 10.1.3. Services
- 10.2. Market Analysis, Insights and Forecast - by Diagnosis Type
- 10.2.1. Cardiology
- 10.2.2. Oncology
- 10.2.3. Neurology
- 10.2.4. Radiology
- 10.2.5. Pathology
- 10.2.6. Others
- 10.3. Market Analysis, Insights and Forecast - by End User
- 10.3.1. Hospitals and Clinics
- 10.3.2. Clinical Laboratories
- 10.3.3. Others
- 10.1. Market Analysis, Insights and Forecast - by Product
- 11. Competitive Analysis
- 11.1. Global Market Share Analysis 2025
- 11.2. Company Profiles
- 11.2.1 Siemens Healthcare GmbH
- 11.2.1.1. Overview
- 11.2.1.2. Products
- 11.2.1.3. SWOT Analysis
- 11.2.1.4. Recent Developments
- 11.2.1.5. Financials (Based on Availability)
- 11.2.2 Laboratory Corporation of America Holdings
- 11.2.2.1. Overview
- 11.2.2.2. Products
- 11.2.2.3. SWOT Analysis
- 11.2.2.4. Recent Developments
- 11.2.2.5. Financials (Based on Availability)
- 11.2.3 Cerora
- 11.2.3.1. Overview
- 11.2.3.2. Products
- 11.2.3.3. SWOT Analysis
- 11.2.3.4. Recent Developments
- 11.2.3.5. Financials (Based on Availability)
- 11.2.4 Digital Diagnostics Inc
- 11.2.4.1. Overview
- 11.2.4.2. Products
- 11.2.4.3. SWOT Analysis
- 11.2.4.4. Recent Developments
- 11.2.4.5. Financials (Based on Availability)
- 11.2.5 F Hoffmann-La Roche Ltd
- 11.2.5.1. Overview
- 11.2.5.2. Products
- 11.2.5.3. SWOT Analysis
- 11.2.5.4. Recent Developments
- 11.2.5.5. Financials (Based on Availability)
- 11.2.6 GE Healthcare
- 11.2.6.1. Overview
- 11.2.6.2. Products
- 11.2.6.3. SWOT Analysis
- 11.2.6.4. Recent Developments
- 11.2.6.5. Financials (Based on Availability)
- 11.2.7 Vuno Inc
- 11.2.7.1. Overview
- 11.2.7.2. Products
- 11.2.7.3. SWOT Analysis
- 11.2.7.4. Recent Developments
- 11.2.7.5. Financials (Based on Availability)
- 11.2.8 Midmark Corporation
- 11.2.8.1. Overview
- 11.2.8.2. Products
- 11.2.8.3. SWOT Analysis
- 11.2.8.4. Recent Developments
- 11.2.8.5. Financials (Based on Availability)
- 11.2.9 Nanox Imaging Ltd
- 11.2.9.1. Overview
- 11.2.9.2. Products
- 11.2.9.3. SWOT Analysis
- 11.2.9.4. Recent Developments
- 11.2.9.5. Financials (Based on Availability)
- 11.2.10 Novasignal Corporation
- 11.2.10.1. Overview
- 11.2.10.2. Products
- 11.2.10.3. SWOT Analysis
- 11.2.10.4. Recent Developments
- 11.2.10.5. Financials (Based on Availability)
- 11.2.11 Riverain Technologies
- 11.2.11.1. Overview
- 11.2.11.2. Products
- 11.2.11.3. SWOT Analysis
- 11.2.11.4. Recent Developments
- 11.2.11.5. Financials (Based on Availability)
- 11.2.12 ThermoFisher Scientific Inc
- 11.2.12.1. Overview
- 11.2.12.2. Products
- 11.2.12.3. SWOT Analysis
- 11.2.12.4. Recent Developments
- 11.2.12.5. Financials (Based on Availability)
- 11.2.1 Siemens Healthcare GmbH
List of Figures
- Figure 1: Global Digital Diagnostics Industry Revenue Breakdown (undefined, %) by Region 2025 & 2033
- Figure 2: Global Digital Diagnostics Industry Volume Breakdown (K Unit, %) by Region 2025 & 2033
- Figure 3: North America Digital Diagnostics Industry Revenue (undefined), by Product 2025 & 2033
- Figure 4: North America Digital Diagnostics Industry Volume (K Unit), by Product 2025 & 2033
- Figure 5: North America Digital Diagnostics Industry Revenue Share (%), by Product 2025 & 2033
- Figure 6: North America Digital Diagnostics Industry Volume Share (%), by Product 2025 & 2033
- Figure 7: North America Digital Diagnostics Industry Revenue (undefined), by Diagnosis Type 2025 & 2033
- Figure 8: North America Digital Diagnostics Industry Volume (K Unit), by Diagnosis Type 2025 & 2033
- Figure 9: North America Digital Diagnostics Industry Revenue Share (%), by Diagnosis Type 2025 & 2033
- Figure 10: North America Digital Diagnostics Industry Volume Share (%), by Diagnosis Type 2025 & 2033
- Figure 11: North America Digital Diagnostics Industry Revenue (undefined), by End User 2025 & 2033
- Figure 12: North America Digital Diagnostics Industry Volume (K Unit), by End User 2025 & 2033
- Figure 13: North America Digital Diagnostics Industry Revenue Share (%), by End User 2025 & 2033
- Figure 14: North America Digital Diagnostics Industry Volume Share (%), by End User 2025 & 2033
- Figure 15: North America Digital Diagnostics Industry Revenue (undefined), by Country 2025 & 2033
- Figure 16: North America Digital Diagnostics Industry Volume (K Unit), by Country 2025 & 2033
- Figure 17: North America Digital Diagnostics Industry Revenue Share (%), by Country 2025 & 2033
- Figure 18: North America Digital Diagnostics Industry Volume Share (%), by Country 2025 & 2033
- Figure 19: Europe Digital Diagnostics Industry Revenue (undefined), by Product 2025 & 2033
- Figure 20: Europe Digital Diagnostics Industry Volume (K Unit), by Product 2025 & 2033
- Figure 21: Europe Digital Diagnostics Industry Revenue Share (%), by Product 2025 & 2033
- Figure 22: Europe Digital Diagnostics Industry Volume Share (%), by Product 2025 & 2033
- Figure 23: Europe Digital Diagnostics Industry Revenue (undefined), by Diagnosis Type 2025 & 2033
- Figure 24: Europe Digital Diagnostics Industry Volume (K Unit), by Diagnosis Type 2025 & 2033
- Figure 25: Europe Digital Diagnostics Industry Revenue Share (%), by Diagnosis Type 2025 & 2033
- Figure 26: Europe Digital Diagnostics Industry Volume Share (%), by Diagnosis Type 2025 & 2033
- Figure 27: Europe Digital Diagnostics Industry Revenue (undefined), by End User 2025 & 2033
- Figure 28: Europe Digital Diagnostics Industry Volume (K Unit), by End User 2025 & 2033
- Figure 29: Europe Digital Diagnostics Industry Revenue Share (%), by End User 2025 & 2033
- Figure 30: Europe Digital Diagnostics Industry Volume Share (%), by End User 2025 & 2033
- Figure 31: Europe Digital Diagnostics Industry Revenue (undefined), by Country 2025 & 2033
- Figure 32: Europe Digital Diagnostics Industry Volume (K Unit), by Country 2025 & 2033
- Figure 33: Europe Digital Diagnostics Industry Revenue Share (%), by Country 2025 & 2033
- Figure 34: Europe Digital Diagnostics Industry Volume Share (%), by Country 2025 & 2033
- Figure 35: Asia Pacific Digital Diagnostics Industry Revenue (undefined), by Product 2025 & 2033
- Figure 36: Asia Pacific Digital Diagnostics Industry Volume (K Unit), by Product 2025 & 2033
- Figure 37: Asia Pacific Digital Diagnostics Industry Revenue Share (%), by Product 2025 & 2033
- Figure 38: Asia Pacific Digital Diagnostics Industry Volume Share (%), by Product 2025 & 2033
- Figure 39: Asia Pacific Digital Diagnostics Industry Revenue (undefined), by Diagnosis Type 2025 & 2033
- Figure 40: Asia Pacific Digital Diagnostics Industry Volume (K Unit), by Diagnosis Type 2025 & 2033
- Figure 41: Asia Pacific Digital Diagnostics Industry Revenue Share (%), by Diagnosis Type 2025 & 2033
- Figure 42: Asia Pacific Digital Diagnostics Industry Volume Share (%), by Diagnosis Type 2025 & 2033
- Figure 43: Asia Pacific Digital Diagnostics Industry Revenue (undefined), by End User 2025 & 2033
- Figure 44: Asia Pacific Digital Diagnostics Industry Volume (K Unit), by End User 2025 & 2033
- Figure 45: Asia Pacific Digital Diagnostics Industry Revenue Share (%), by End User 2025 & 2033
- Figure 46: Asia Pacific Digital Diagnostics Industry Volume Share (%), by End User 2025 & 2033
- Figure 47: Asia Pacific Digital Diagnostics Industry Revenue (undefined), by Country 2025 & 2033
- Figure 48: Asia Pacific Digital Diagnostics Industry Volume (K Unit), by Country 2025 & 2033
- Figure 49: Asia Pacific Digital Diagnostics Industry Revenue Share (%), by Country 2025 & 2033
- Figure 50: Asia Pacific Digital Diagnostics Industry Volume Share (%), by Country 2025 & 2033
- Figure 51: Middle East and Africa Digital Diagnostics Industry Revenue (undefined), by Product 2025 & 2033
- Figure 52: Middle East and Africa Digital Diagnostics Industry Volume (K Unit), by Product 2025 & 2033
- Figure 53: Middle East and Africa Digital Diagnostics Industry Revenue Share (%), by Product 2025 & 2033
- Figure 54: Middle East and Africa Digital Diagnostics Industry Volume Share (%), by Product 2025 & 2033
- Figure 55: Middle East and Africa Digital Diagnostics Industry Revenue (undefined), by Diagnosis Type 2025 & 2033
- Figure 56: Middle East and Africa Digital Diagnostics Industry Volume (K Unit), by Diagnosis Type 2025 & 2033
- Figure 57: Middle East and Africa Digital Diagnostics Industry Revenue Share (%), by Diagnosis Type 2025 & 2033
- Figure 58: Middle East and Africa Digital Diagnostics Industry Volume Share (%), by Diagnosis Type 2025 & 2033
- Figure 59: Middle East and Africa Digital Diagnostics Industry Revenue (undefined), by End User 2025 & 2033
- Figure 60: Middle East and Africa Digital Diagnostics Industry Volume (K Unit), by End User 2025 & 2033
- Figure 61: Middle East and Africa Digital Diagnostics Industry Revenue Share (%), by End User 2025 & 2033
- Figure 62: Middle East and Africa Digital Diagnostics Industry Volume Share (%), by End User 2025 & 2033
- Figure 63: Middle East and Africa Digital Diagnostics Industry Revenue (undefined), by Country 2025 & 2033
- Figure 64: Middle East and Africa Digital Diagnostics Industry Volume (K Unit), by Country 2025 & 2033
- Figure 65: Middle East and Africa Digital Diagnostics Industry Revenue Share (%), by Country 2025 & 2033
- Figure 66: Middle East and Africa Digital Diagnostics Industry Volume Share (%), by Country 2025 & 2033
- Figure 67: South America Digital Diagnostics Industry Revenue (undefined), by Product 2025 & 2033
- Figure 68: South America Digital Diagnostics Industry Volume (K Unit), by Product 2025 & 2033
- Figure 69: South America Digital Diagnostics Industry Revenue Share (%), by Product 2025 & 2033
- Figure 70: South America Digital Diagnostics Industry Volume Share (%), by Product 2025 & 2033
- Figure 71: South America Digital Diagnostics Industry Revenue (undefined), by Diagnosis Type 2025 & 2033
- Figure 72: South America Digital Diagnostics Industry Volume (K Unit), by Diagnosis Type 2025 & 2033
- Figure 73: South America Digital Diagnostics Industry Revenue Share (%), by Diagnosis Type 2025 & 2033
- Figure 74: South America Digital Diagnostics Industry Volume Share (%), by Diagnosis Type 2025 & 2033
- Figure 75: South America Digital Diagnostics Industry Revenue (undefined), by End User 2025 & 2033
- Figure 76: South America Digital Diagnostics Industry Volume (K Unit), by End User 2025 & 2033
- Figure 77: South America Digital Diagnostics Industry Revenue Share (%), by End User 2025 & 2033
- Figure 78: South America Digital Diagnostics Industry Volume Share (%), by End User 2025 & 2033
- Figure 79: South America Digital Diagnostics Industry Revenue (undefined), by Country 2025 & 2033
- Figure 80: South America Digital Diagnostics Industry Volume (K Unit), by Country 2025 & 2033
- Figure 81: South America Digital Diagnostics Industry Revenue Share (%), by Country 2025 & 2033
- Figure 82: South America Digital Diagnostics Industry Volume Share (%), by Country 2025 & 2033
List of Tables
- Table 1: Global Digital Diagnostics Industry Revenue undefined Forecast, by Product 2020 & 2033
- Table 2: Global Digital Diagnostics Industry Volume K Unit Forecast, by Product 2020 & 2033
- Table 3: Global Digital Diagnostics Industry Revenue undefined Forecast, by Diagnosis Type 2020 & 2033
- Table 4: Global Digital Diagnostics Industry Volume K Unit Forecast, by Diagnosis Type 2020 & 2033
- Table 5: Global Digital Diagnostics Industry Revenue undefined Forecast, by End User 2020 & 2033
- Table 6: Global Digital Diagnostics Industry Volume K Unit Forecast, by End User 2020 & 2033
- Table 7: Global Digital Diagnostics Industry Revenue undefined Forecast, by Region 2020 & 2033
- Table 8: Global Digital Diagnostics Industry Volume K Unit Forecast, by Region 2020 & 2033
- Table 9: Global Digital Diagnostics Industry Revenue undefined Forecast, by Product 2020 & 2033
- Table 10: Global Digital Diagnostics Industry Volume K Unit Forecast, by Product 2020 & 2033
- Table 11: Global Digital Diagnostics Industry Revenue undefined Forecast, by Diagnosis Type 2020 & 2033
- Table 12: Global Digital Diagnostics Industry Volume K Unit Forecast, by Diagnosis Type 2020 & 2033
- Table 13: Global Digital Diagnostics Industry Revenue undefined Forecast, by End User 2020 & 2033
- Table 14: Global Digital Diagnostics Industry Volume K Unit Forecast, by End User 2020 & 2033
- Table 15: Global Digital Diagnostics Industry Revenue undefined Forecast, by Country 2020 & 2033
- Table 16: Global Digital Diagnostics Industry Volume K Unit Forecast, by Country 2020 & 2033
- Table 17: United States Digital Diagnostics Industry Revenue (undefined) Forecast, by Application 2020 & 2033
- Table 18: United States Digital Diagnostics Industry Volume (K Unit) Forecast, by Application 2020 & 2033
- Table 19: Canada Digital Diagnostics Industry Revenue (undefined) Forecast, by Application 2020 & 2033
- Table 20: Canada Digital Diagnostics Industry Volume (K Unit) Forecast, by Application 2020 & 2033
- Table 21: Mexico Digital Diagnostics Industry Revenue (undefined) Forecast, by Application 2020 & 2033
- Table 22: Mexico Digital Diagnostics Industry Volume (K Unit) Forecast, by Application 2020 & 2033
- Table 23: Global Digital Diagnostics Industry Revenue undefined Forecast, by Product 2020 & 2033
- Table 24: Global Digital Diagnostics Industry Volume K Unit Forecast, by Product 2020 & 2033
- Table 25: Global Digital Diagnostics Industry Revenue undefined Forecast, by Diagnosis Type 2020 & 2033
- Table 26: Global Digital Diagnostics Industry Volume K Unit Forecast, by Diagnosis Type 2020 & 2033
- Table 27: Global Digital Diagnostics Industry Revenue undefined Forecast, by End User 2020 & 2033
- Table 28: Global Digital Diagnostics Industry Volume K Unit Forecast, by End User 2020 & 2033
- Table 29: Global Digital Diagnostics Industry Revenue undefined Forecast, by Country 2020 & 2033
- Table 30: Global Digital Diagnostics Industry Volume K Unit Forecast, by Country 2020 & 2033
- Table 31: Germany Digital Diagnostics Industry Revenue (undefined) Forecast, by Application 2020 & 2033
- Table 32: Germany Digital Diagnostics Industry Volume (K Unit) Forecast, by Application 2020 & 2033
- Table 33: United Kingdom Digital Diagnostics Industry Revenue (undefined) Forecast, by Application 2020 & 2033
- Table 34: United Kingdom Digital Diagnostics Industry Volume (K Unit) Forecast, by Application 2020 & 2033
- Table 35: France Digital Diagnostics Industry Revenue (undefined) Forecast, by Application 2020 & 2033
- Table 36: France Digital Diagnostics Industry Volume (K Unit) Forecast, by Application 2020 & 2033
- Table 37: Italy Digital Diagnostics Industry Revenue (undefined) Forecast, by Application 2020 & 2033
- Table 38: Italy Digital Diagnostics Industry Volume (K Unit) Forecast, by Application 2020 & 2033
- Table 39: Spain Digital Diagnostics Industry Revenue (undefined) Forecast, by Application 2020 & 2033
- Table 40: Spain Digital Diagnostics Industry Volume (K Unit) Forecast, by Application 2020 & 2033
- Table 41: Rest of Europe Digital Diagnostics Industry Revenue (undefined) Forecast, by Application 2020 & 2033
- Table 42: Rest of Europe Digital Diagnostics Industry Volume (K Unit) Forecast, by Application 2020 & 2033
- Table 43: Global Digital Diagnostics Industry Revenue undefined Forecast, by Product 2020 & 2033
- Table 44: Global Digital Diagnostics Industry Volume K Unit Forecast, by Product 2020 & 2033
- Table 45: Global Digital Diagnostics Industry Revenue undefined Forecast, by Diagnosis Type 2020 & 2033
- Table 46: Global Digital Diagnostics Industry Volume K Unit Forecast, by Diagnosis Type 2020 & 2033
- Table 47: Global Digital Diagnostics Industry Revenue undefined Forecast, by End User 2020 & 2033
- Table 48: Global Digital Diagnostics Industry Volume K Unit Forecast, by End User 2020 & 2033
- Table 49: Global Digital Diagnostics Industry Revenue undefined Forecast, by Country 2020 & 2033
- Table 50: Global Digital Diagnostics Industry Volume K Unit Forecast, by Country 2020 & 2033
- Table 51: China Digital Diagnostics Industry Revenue (undefined) Forecast, by Application 2020 & 2033
- Table 52: China Digital Diagnostics Industry Volume (K Unit) Forecast, by Application 2020 & 2033
- Table 53: Japan Digital Diagnostics Industry Revenue (undefined) Forecast, by Application 2020 & 2033
- Table 54: Japan Digital Diagnostics Industry Volume (K Unit) Forecast, by Application 2020 & 2033
- Table 55: India Digital Diagnostics Industry Revenue (undefined) Forecast, by Application 2020 & 2033
- Table 56: India Digital Diagnostics Industry Volume (K Unit) Forecast, by Application 2020 & 2033
- Table 57: Australia Digital Diagnostics Industry Revenue (undefined) Forecast, by Application 2020 & 2033
- Table 58: Australia Digital Diagnostics Industry Volume (K Unit) Forecast, by Application 2020 & 2033
- Table 59: South Korea Digital Diagnostics Industry Revenue (undefined) Forecast, by Application 2020 & 2033
- Table 60: South Korea Digital Diagnostics Industry Volume (K Unit) Forecast, by Application 2020 & 2033
- Table 61: Rest of Asia Pacific Digital Diagnostics Industry Revenue (undefined) Forecast, by Application 2020 & 2033
- Table 62: Rest of Asia Pacific Digital Diagnostics Industry Volume (K Unit) Forecast, by Application 2020 & 2033
- Table 63: Global Digital Diagnostics Industry Revenue undefined Forecast, by Product 2020 & 2033
- Table 64: Global Digital Diagnostics Industry Volume K Unit Forecast, by Product 2020 & 2033
- Table 65: Global Digital Diagnostics Industry Revenue undefined Forecast, by Diagnosis Type 2020 & 2033
- Table 66: Global Digital Diagnostics Industry Volume K Unit Forecast, by Diagnosis Type 2020 & 2033
- Table 67: Global Digital Diagnostics Industry Revenue undefined Forecast, by End User 2020 & 2033
- Table 68: Global Digital Diagnostics Industry Volume K Unit Forecast, by End User 2020 & 2033
- Table 69: Global Digital Diagnostics Industry Revenue undefined Forecast, by Country 2020 & 2033
- Table 70: Global Digital Diagnostics Industry Volume K Unit Forecast, by Country 2020 & 2033
- Table 71: GCC Digital Diagnostics Industry Revenue (undefined) Forecast, by Application 2020 & 2033
- Table 72: GCC Digital Diagnostics Industry Volume (K Unit) Forecast, by Application 2020 & 2033
- Table 73: South Africa Digital Diagnostics Industry Revenue (undefined) Forecast, by Application 2020 & 2033
- Table 74: South Africa Digital Diagnostics Industry Volume (K Unit) Forecast, by Application 2020 & 2033
- Table 75: Rest of Middle East and Africa Digital Diagnostics Industry Revenue (undefined) Forecast, by Application 2020 & 2033
- Table 76: Rest of Middle East and Africa Digital Diagnostics Industry Volume (K Unit) Forecast, by Application 2020 & 2033
- Table 77: Global Digital Diagnostics Industry Revenue undefined Forecast, by Product 2020 & 2033
- Table 78: Global Digital Diagnostics Industry Volume K Unit Forecast, by Product 2020 & 2033
- Table 79: Global Digital Diagnostics Industry Revenue undefined Forecast, by Diagnosis Type 2020 & 2033
- Table 80: Global Digital Diagnostics Industry Volume K Unit Forecast, by Diagnosis Type 2020 & 2033
- Table 81: Global Digital Diagnostics Industry Revenue undefined Forecast, by End User 2020 & 2033
- Table 82: Global Digital Diagnostics Industry Volume K Unit Forecast, by End User 2020 & 2033
- Table 83: Global Digital Diagnostics Industry Revenue undefined Forecast, by Country 2020 & 2033
- Table 84: Global Digital Diagnostics Industry Volume K Unit Forecast, by Country 2020 & 2033
- Table 85: Brazil Digital Diagnostics Industry Revenue (undefined) Forecast, by Application 2020 & 2033
- Table 86: Brazil Digital Diagnostics Industry Volume (K Unit) Forecast, by Application 2020 & 2033
- Table 87: Argentina Digital Diagnostics Industry Revenue (undefined) Forecast, by Application 2020 & 2033
- Table 88: Argentina Digital Diagnostics Industry Volume (K Unit) Forecast, by Application 2020 & 2033
- Table 89: Rest of South America Digital Diagnostics Industry Revenue (undefined) Forecast, by Application 2020 & 2033
- Table 90: Rest of South America Digital Diagnostics Industry Volume (K Unit) Forecast, by Application 2020 & 2033
Frequently Asked Questions
1. What is the projected Compound Annual Growth Rate (CAGR) of the Digital Diagnostics Industry?
The projected CAGR is approximately 18.08%.
2. Which companies are prominent players in the Digital Diagnostics Industry?
Key companies in the market include Siemens Healthcare GmbH, Laboratory Corporation of America Holdings, Cerora, Digital Diagnostics Inc, F Hoffmann-La Roche Ltd, GE Healthcare, Vuno Inc , Midmark Corporation, Nanox Imaging Ltd, Novasignal Corporation, Riverain Technologies, ThermoFisher Scientific Inc.
3. What are the main segments of the Digital Diagnostics Industry?
The market segments include Product, Diagnosis Type, End User.
4. Can you provide details about the market size?
The market size is estimated to be USD XXX N/A as of 2022.
5. What are some drivers contributing to market growth?
Rising Adoption of Digitalization in Chronic Disease Management; Increasing Burden of Chronic Diseases.
6. What are the notable trends driving market growth?
Oncology Segment is Expected to Account for the Large Market Share During the Forecast Period.
7. Are there any restraints impacting market growth?
High Cost of Instruments.
8. Can you provide examples of recent developments in the market?
In May 2022, TestCard, a MedTech company, received USD 10 million in its latest round of fundraising, which will be used primarily to further commercialize its existing product suite whilst also launching new products such as diabetes, pregnancy, CKD, and flu testing.
9. What pricing options are available for accessing the report?
Pricing options include single-user, multi-user, and enterprise licenses priced at USD 4750, USD 5250, and USD 8750 respectively.
10. Is the market size provided in terms of value or volume?
The market size is provided in terms of value, measured in N/A and volume, measured in K Unit.
11. Are there any specific market keywords associated with the report?
Yes, the market keyword associated with the report is "Digital Diagnostics Industry," which aids in identifying and referencing the specific market segment covered.
12. How do I determine which pricing option suits my needs best?
The pricing options vary based on user requirements and access needs. Individual users may opt for single-user licenses, while businesses requiring broader access may choose multi-user or enterprise licenses for cost-effective access to the report.
13. Are there any additional resources or data provided in the Digital Diagnostics Industry report?
While the report offers comprehensive insights, it's advisable to review the specific contents or supplementary materials provided to ascertain if additional resources or data are available.
14. How can I stay updated on further developments or reports in the Digital Diagnostics Industry?
To stay informed about further developments, trends, and reports in the Digital Diagnostics Industry, consider subscribing to industry newsletters, following relevant companies and organizations, or regularly checking reputable industry news sources and publications.
Methodology
Step 1 - Identification of Relevant Samples Size from Population Database


Step 2 - Approaches for Defining Global Market Size (Value, Volume* & Price*)

Note*: In applicable scenarios
Step 3 - Data Sources
Primary Research
- Web Analytics
- Survey Reports
- Research Institute
- Latest Research Reports
- Opinion Leaders
Secondary Research
- Annual Reports
- White Paper
- Latest Press Release
- Industry Association
- Paid Database
- Investor Presentations

Step 4 - Data Triangulation
Involves using different sources of information in order to increase the validity of a study
These sources are likely to be stakeholders in a program - participants, other researchers, program staff, other community members, and so on.
Then we put all data in single framework & apply various statistical tools to find out the dynamic on the market.
During the analysis stage, feedback from the stakeholder groups would be compared to determine areas of agreement as well as areas of divergence