

Key Insights
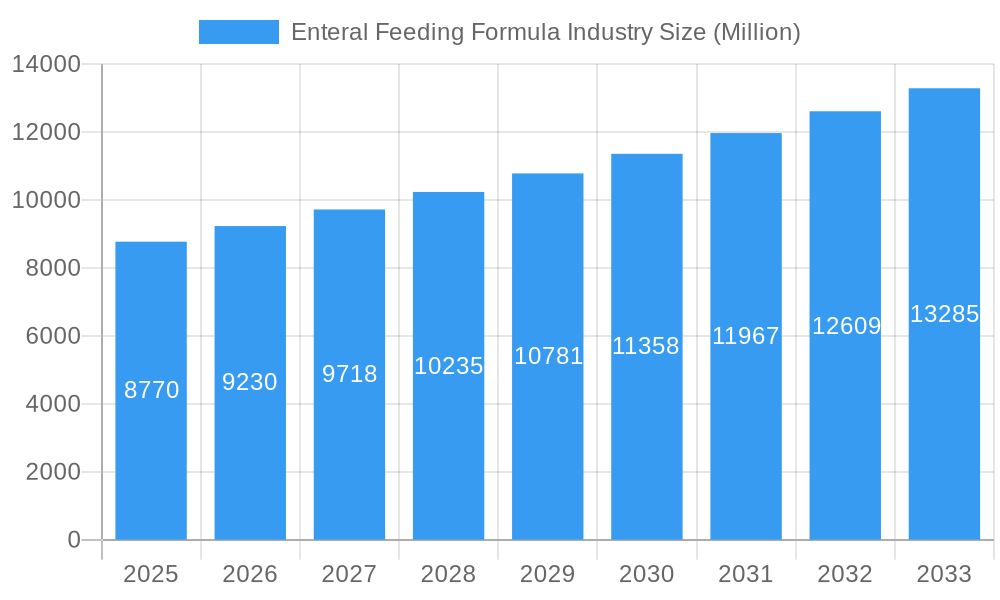
The enteral feeding formula market, valued at $8.77 billion in 2025, is projected to experience robust growth, exhibiting a compound annual growth rate (CAGR) of 5.18% from 2025 to 2033. This growth is fueled by several key factors. The rising prevalence of chronic diseases like cancer, neurological disorders, and diabetes necessitates increased reliance on enteral nutrition, driving demand for specialized formulas. An aging global population, coupled with a growing geriatric care sector, further contributes to market expansion. Technological advancements in formula composition, leading to improved patient outcomes and reduced complications, also play a significant role. The increasing adoption of home healthcare settings, allowing for convenient and cost-effective enteral feeding, is another positive influence. However, the market faces challenges including high costs associated with specialized formulas and potential reimbursement hurdles, particularly in certain healthcare systems. Competition from parenteral nutrition and the complexities of managing enteral feeding in certain patient populations also represent constraints. The market is segmented by product type (standard and disease-specific formulas), application (oncology, neurology, critical care, etc.), end-user (hospitals, home care, etc.), and distribution channel (hospitals, pharmacies, online platforms). Major players like Nestlé, Fresenius Kabi, Abbott, and Danone are actively shaping market dynamics through product innovation and strategic partnerships. Growth is expected to be geographically diverse, with North America and Europe likely maintaining significant market shares, while Asia-Pacific is poised for substantial expansion given its growing healthcare sector and increasing prevalence of chronic illnesses.
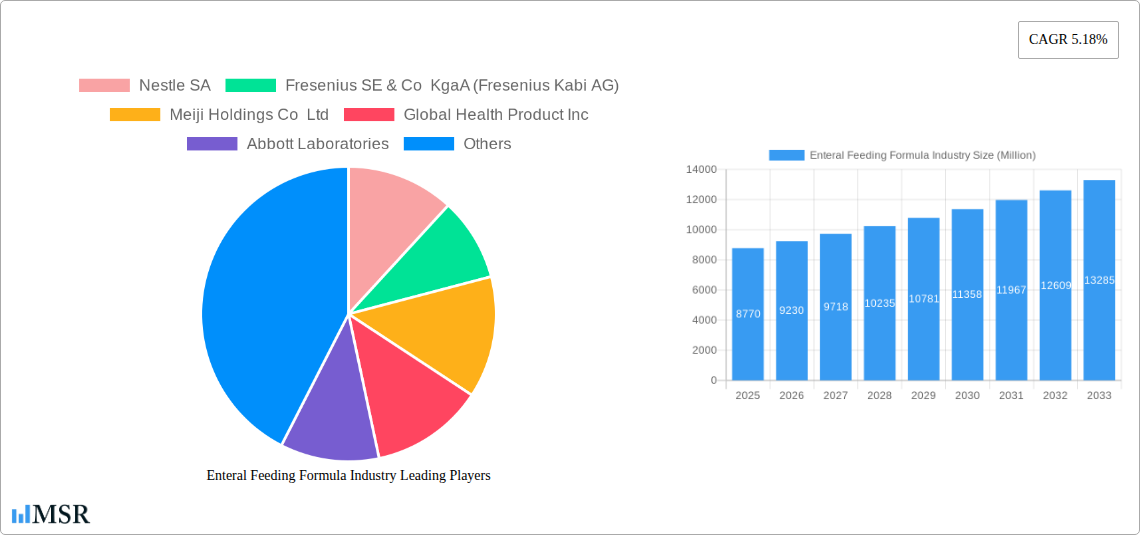
Enteral Feeding Formula Industry Market Size (In Billion)
The future of the enteral feeding formula market hinges on continued innovation in product development to address specific nutritional needs and patient preferences. Expansion into emerging markets, particularly in regions with high disease burdens and growing healthcare infrastructure, will be crucial for sustained growth. Additionally, the market will likely witness increased focus on personalized nutrition solutions, leveraging advancements in genomics and other technologies to tailor formulas to individual patient requirements. Strategic alliances between formula manufacturers and healthcare providers, aimed at improving patient access and clinical efficacy, will be pivotal for optimizing market performance. The ongoing trend toward remote patient monitoring and telehealth services presents significant opportunities for efficient delivery and management of enteral nutrition.
Enteral Feeding Formula Industry Company Market Share
Enteral Feeding Formula Industry Market Report: 2019-2033
This comprehensive report provides a detailed analysis of the global enteral feeding formula market, offering invaluable insights for industry stakeholders, investors, and researchers. Covering the period 2019-2033, with a focus on 2025, this report examines market dynamics, key segments, leading players, and future growth potential. The study period spans 2019-2024 (Historical Period), with 2025 serving as the base year and estimated year. The forecast period extends from 2025-2033. The market is valued in Millions of USD.
Enteral Feeding Formula Industry Market Concentration & Dynamics
The enteral feeding formula market exhibits a moderately concentrated landscape, dominated by a handful of multinational corporations alongside several smaller, specialized players. Key players like Nestlé SA, Abbott Laboratories, and Fresenius SE & Co KgaA (Fresenius Kabi AG) hold significant market share, leveraging their established brands and extensive distribution networks. However, the market is witnessing increasing competition from emerging companies focused on niche segments, such as plant-based formulas.
Market Concentration Metrics:
- Market Leader Market Share: xx% (Nestlé SA estimated)
- Top 5 Players Combined Market Share: xx% (estimated)
- M&A Activity (2019-2024): xx deals (estimated)
The industry's innovation ecosystem is driven by R&D investments focused on developing specialized formulas for specific diseases and improving product palatability. Regulatory frameworks, varying across geographies, significantly impact market access and product approvals. Substitute products, such as parenteral nutrition, present competitive challenges. End-user trends, including increasing preference for home-based care and personalized nutrition solutions, are reshaping market demand.
Enteral Feeding Formula Industry Insights & Trends
The global enteral feeding formula market is experiencing substantial growth, driven by factors such as the rising prevalence of chronic diseases, aging populations, and increasing healthcare expenditure. Technological advancements, such as the development of customized formulas and improved delivery systems, are further fueling market expansion. Consumer behavior is shifting towards more convenient and palatable options, leading to innovations in product formulation and packaging.
Market Size & Growth:
- Market Size (2024): USD xx Million
- CAGR (2025-2033): xx% (estimated)
- Projected Market Size (2033): USD xx Million
Key Markets & Segments Leading Enteral Feeding Formula Industry
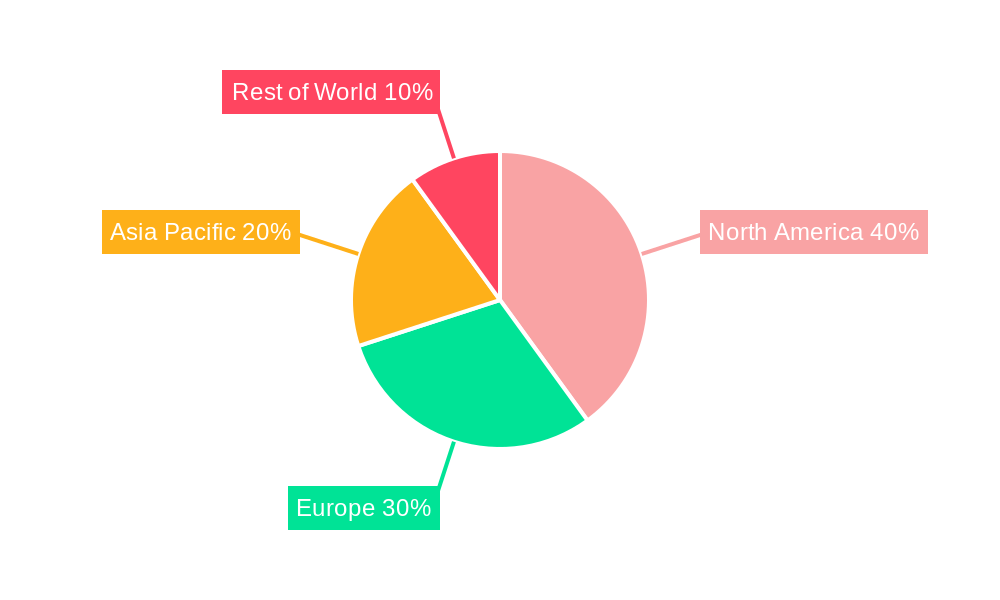
The North American market currently dominates the global enteral feeding formula market due to high healthcare spending, prevalence of chronic diseases, and well-established healthcare infrastructure. However, Asia-Pacific is expected to witness significant growth in the coming years.
Key Market Drivers:
- North America: High healthcare expenditure, aging population, prevalence of chronic diseases.
- Europe: Well-developed healthcare infrastructure, increasing demand for home healthcare solutions.
- Asia-Pacific: Rising prevalence of chronic diseases, increasing disposable incomes, growing awareness of healthcare.
Dominant Segments:
- By Product: Disease-specific formulas are witnessing faster growth compared to standard formulas due to increasing demand for specialized nutritional support.
- By Application: Oncology and critical care represent significant market segments due to high demand for specialized nutritional support.
- By End User: Hospitals remain the largest end-user segment, driven by high patient volume and established distribution channels.
- By Distribution Channel: Hospitals and retail pharmacies dominate distribution channels. Online pharmacies are emerging as a rapidly growing segment.
Enteral Feeding Formula Industry Product Developments
Recent product innovations focus on enhancing palatability, improving nutrient absorption, and developing specialized formulas for specific conditions. Advances in formula composition and delivery systems are creating a competitive edge, allowing companies to cater to diverse patient needs and preferences. For example, Kate Farms' launch of Adult Standard 1.4 highlights the trend toward high-calorie, palatable options.
Challenges in the Enteral Feeding Formula Industry Market
The enteral feeding formula market faces challenges like stringent regulatory requirements for product approvals, supply chain disruptions impacting raw material availability and cost, and intense competition from both established and emerging players. These factors can impact profitability and market expansion. Stringent regulations increase the cost of product launch and delays time to market.
Forces Driving Enteral Feeding Formula Industry Growth
Technological advancements in formula composition and delivery systems, alongside rising healthcare expenditure and an aging population, significantly drive market growth. Government initiatives promoting healthcare access and increasing awareness of nutritional needs also contribute to expansion. The increasing demand for personalized nutrition solutions further fuels market growth.
Long-Term Growth Catalysts in the Enteral Feeding Formula Industry
Long-term growth will be driven by continued innovation in formula development, strategic partnerships to expand market reach, and penetration into emerging markets. Increased R&D investments in specialized formulas and patient-centric delivery systems will contribute significantly to market expansion.
Emerging Opportunities in Enteral Feeding Formula Industry
Emerging opportunities lie in developing personalized nutrition solutions, expanding into untapped markets (e.g., developing countries), and leveraging digital technologies for improved patient monitoring and adherence. Plant-based formulas represent a significant growth opportunity.
Leading Players in the Enteral Feeding Formula Industry Sector
- Nestle SA
- Fresenius SE & Co KgaA (Fresenius Kabi AG)
- Meiji Holdings Co Ltd
- Global Health Product Inc
- Abbott Laboratories
- Danone SA (Nutricia)
- Functional Formularies
- Hormel Foods Corporation
- B Braun Melsungen AG
- Victus Inc
- Reckitt Benckiser Group plc (Mead Johnson)
- Kate Farms
Key Milestones in Enteral Feeding Formula Industry Industry
- September 2022: Kate Farms secured USD 75 Million in Series C funding, boosting R&D and market expansion.
- September 2022: Kate Farms launched Adult Standard 1.4, a high-calorie formula, expanding product offerings.
Strategic Outlook for Enteral Feeding Formula Industry Market
The enteral feeding formula market holds significant future potential, driven by continued innovation, market expansion into developing economies, and the increasing demand for specialized nutritional solutions. Strategic partnerships and investments in R&D will be crucial for companies to maintain a competitive edge and capitalize on emerging opportunities.
Enteral Feeding Formula Industry Segmentation
-
1. Product
- 1.1. Standard Formulas
- 1.2. Disease-specific Formulas
-
2. Application
- 2.1. Oncology
- 2.2. Neurology
- 2.3. Critical Care
- 2.4. Diabetes
- 2.5. Gastroenterology
- 2.6. Other Applications
-
3. End User
- 3.1. Hospital
- 3.2. Home Care Agencies and Hospices
- 3.3. Other End Users
-
4. Distributuion Channel
- 4.1. Hospitals
- 4.2. Retail Pharmacies
- 4.3. Online Pharmacies
Enteral Feeding Formula Industry Segmentation By Geography
-
1. North America
- 1.1. United States
- 1.2. Canada
- 1.3. Mexico
-
2. Europe
- 2.1. Germany
- 2.2. United Kingdom
- 2.3. France
- 2.4. Italy
- 2.5. Spain
- 2.6. Rest of Europe
-
3. Asia Pacific
- 3.1. China
- 3.2. Japan
- 3.3. India
- 3.4. Australia
- 3.5. South Korea
- 3.6. Rest of Asia Pacific
-
4. Middle East and Africa
- 4.1. GCC
- 4.2. South Africa
- 4.3. Rest of Middle East and Africa
-
5. South America
- 5.1. Brazil
- 5.2. Argentina
- 5.3. Rest of South America
Enteral Feeding Formula Industry Regional Market Share
Geographic Coverage of Enteral Feeding Formula Industry
Enteral Feeding Formula Industry REPORT HIGHLIGHTS
| Aspects | Details |
|---|---|
| Study Period | 2020-2034 |
| Base Year | 2025 |
| Estimated Year | 2026 |
| Forecast Period | 2026-2034 |
| Historical Period | 2020-2025 |
| Growth Rate | CAGR of 5.18% from 2020-2034 |
| Segmentation |
|
Table of Contents
- 1. Introduction
- 1.1. Research Scope
- 1.2. Market Segmentation
- 1.3. Research Methodology
- 1.4. Definitions and Assumptions
- 2. Executive Summary
- 2.1. Introduction
- 3. Market Dynamics
- 3.1. Introduction
- 3.2. Market Drivers
- 3.2.1. Increasing Prevalence of Metabolic and Chronic Diseases; Increasing Spending on Patient Care; Growing Geriatric Population
- 3.3. Market Restrains
- 3.3.1. Complications Associated with Enteral Nutrition; High Cost and Low Adherence Rates in Developing Countries
- 3.4. Market Trends
- 3.4.1. Oncology Segment is Expected to Hold a Significant Market Share in the Enteral Feeding Formulas Market
- 4. Market Factor Analysis
- 4.1. Porters Five Forces
- 4.2. Supply/Value Chain
- 4.3. PESTEL analysis
- 4.4. Market Entropy
- 4.5. Patent/Trademark Analysis
- 5. Global Enteral Feeding Formula Industry Analysis, Insights and Forecast, 2020-2032
- 5.1. Market Analysis, Insights and Forecast - by Product
- 5.1.1. Standard Formulas
- 5.1.2. Disease-specific Formulas
- 5.2. Market Analysis, Insights and Forecast - by Application
- 5.2.1. Oncology
- 5.2.2. Neurology
- 5.2.3. Critical Care
- 5.2.4. Diabetes
- 5.2.5. Gastroenterology
- 5.2.6. Other Applications
- 5.3. Market Analysis, Insights and Forecast - by End User
- 5.3.1. Hospital
- 5.3.2. Home Care Agencies and Hospices
- 5.3.3. Other End Users
- 5.4. Market Analysis, Insights and Forecast - by Distributuion Channel
- 5.4.1. Hospitals
- 5.4.2. Retail Pharmacies
- 5.4.3. Online Pharmacies
- 5.5. Market Analysis, Insights and Forecast - by Region
- 5.5.1. North America
- 5.5.2. Europe
- 5.5.3. Asia Pacific
- 5.5.4. Middle East and Africa
- 5.5.5. South America
- 5.1. Market Analysis, Insights and Forecast - by Product
- 6. North America Enteral Feeding Formula Industry Analysis, Insights and Forecast, 2020-2032
- 6.1. Market Analysis, Insights and Forecast - by Product
- 6.1.1. Standard Formulas
- 6.1.2. Disease-specific Formulas
- 6.2. Market Analysis, Insights and Forecast - by Application
- 6.2.1. Oncology
- 6.2.2. Neurology
- 6.2.3. Critical Care
- 6.2.4. Diabetes
- 6.2.5. Gastroenterology
- 6.2.6. Other Applications
- 6.3. Market Analysis, Insights and Forecast - by End User
- 6.3.1. Hospital
- 6.3.2. Home Care Agencies and Hospices
- 6.3.3. Other End Users
- 6.4. Market Analysis, Insights and Forecast - by Distributuion Channel
- 6.4.1. Hospitals
- 6.4.2. Retail Pharmacies
- 6.4.3. Online Pharmacies
- 6.1. Market Analysis, Insights and Forecast - by Product
- 7. Europe Enteral Feeding Formula Industry Analysis, Insights and Forecast, 2020-2032
- 7.1. Market Analysis, Insights and Forecast - by Product
- 7.1.1. Standard Formulas
- 7.1.2. Disease-specific Formulas
- 7.2. Market Analysis, Insights and Forecast - by Application
- 7.2.1. Oncology
- 7.2.2. Neurology
- 7.2.3. Critical Care
- 7.2.4. Diabetes
- 7.2.5. Gastroenterology
- 7.2.6. Other Applications
- 7.3. Market Analysis, Insights and Forecast - by End User
- 7.3.1. Hospital
- 7.3.2. Home Care Agencies and Hospices
- 7.3.3. Other End Users
- 7.4. Market Analysis, Insights and Forecast - by Distributuion Channel
- 7.4.1. Hospitals
- 7.4.2. Retail Pharmacies
- 7.4.3. Online Pharmacies
- 7.1. Market Analysis, Insights and Forecast - by Product
- 8. Asia Pacific Enteral Feeding Formula Industry Analysis, Insights and Forecast, 2020-2032
- 8.1. Market Analysis, Insights and Forecast - by Product
- 8.1.1. Standard Formulas
- 8.1.2. Disease-specific Formulas
- 8.2. Market Analysis, Insights and Forecast - by Application
- 8.2.1. Oncology
- 8.2.2. Neurology
- 8.2.3. Critical Care
- 8.2.4. Diabetes
- 8.2.5. Gastroenterology
- 8.2.6. Other Applications
- 8.3. Market Analysis, Insights and Forecast - by End User
- 8.3.1. Hospital
- 8.3.2. Home Care Agencies and Hospices
- 8.3.3. Other End Users
- 8.4. Market Analysis, Insights and Forecast - by Distributuion Channel
- 8.4.1. Hospitals
- 8.4.2. Retail Pharmacies
- 8.4.3. Online Pharmacies
- 8.1. Market Analysis, Insights and Forecast - by Product
- 9. Middle East and Africa Enteral Feeding Formula Industry Analysis, Insights and Forecast, 2020-2032
- 9.1. Market Analysis, Insights and Forecast - by Product
- 9.1.1. Standard Formulas
- 9.1.2. Disease-specific Formulas
- 9.2. Market Analysis, Insights and Forecast - by Application
- 9.2.1. Oncology
- 9.2.2. Neurology
- 9.2.3. Critical Care
- 9.2.4. Diabetes
- 9.2.5. Gastroenterology
- 9.2.6. Other Applications
- 9.3. Market Analysis, Insights and Forecast - by End User
- 9.3.1. Hospital
- 9.3.2. Home Care Agencies and Hospices
- 9.3.3. Other End Users
- 9.4. Market Analysis, Insights and Forecast - by Distributuion Channel
- 9.4.1. Hospitals
- 9.4.2. Retail Pharmacies
- 9.4.3. Online Pharmacies
- 9.1. Market Analysis, Insights and Forecast - by Product
- 10. South America Enteral Feeding Formula Industry Analysis, Insights and Forecast, 2020-2032
- 10.1. Market Analysis, Insights and Forecast - by Product
- 10.1.1. Standard Formulas
- 10.1.2. Disease-specific Formulas
- 10.2. Market Analysis, Insights and Forecast - by Application
- 10.2.1. Oncology
- 10.2.2. Neurology
- 10.2.3. Critical Care
- 10.2.4. Diabetes
- 10.2.5. Gastroenterology
- 10.2.6. Other Applications
- 10.3. Market Analysis, Insights and Forecast - by End User
- 10.3.1. Hospital
- 10.3.2. Home Care Agencies and Hospices
- 10.3.3. Other End Users
- 10.4. Market Analysis, Insights and Forecast - by Distributuion Channel
- 10.4.1. Hospitals
- 10.4.2. Retail Pharmacies
- 10.4.3. Online Pharmacies
- 10.1. Market Analysis, Insights and Forecast - by Product
- 11. Competitive Analysis
- 11.1. Global Market Share Analysis 2025
- 11.2. Company Profiles
- 11.2.1 Nestle SA
- 11.2.1.1. Overview
- 11.2.1.2. Products
- 11.2.1.3. SWOT Analysis
- 11.2.1.4. Recent Developments
- 11.2.1.5. Financials (Based on Availability)
- 11.2.2 Fresenius SE & Co KgaA (Fresenius Kabi AG)
- 11.2.2.1. Overview
- 11.2.2.2. Products
- 11.2.2.3. SWOT Analysis
- 11.2.2.4. Recent Developments
- 11.2.2.5. Financials (Based on Availability)
- 11.2.3 Meiji Holdings Co Ltd
- 11.2.3.1. Overview
- 11.2.3.2. Products
- 11.2.3.3. SWOT Analysis
- 11.2.3.4. Recent Developments
- 11.2.3.5. Financials (Based on Availability)
- 11.2.4 Global Health Product Inc
- 11.2.4.1. Overview
- 11.2.4.2. Products
- 11.2.4.3. SWOT Analysis
- 11.2.4.4. Recent Developments
- 11.2.4.5. Financials (Based on Availability)
- 11.2.5 Abbott Laboratories
- 11.2.5.1. Overview
- 11.2.5.2. Products
- 11.2.5.3. SWOT Analysis
- 11.2.5.4. Recent Developments
- 11.2.5.5. Financials (Based on Availability)
- 11.2.6 Danone SA (Nutricia)
- 11.2.6.1. Overview
- 11.2.6.2. Products
- 11.2.6.3. SWOT Analysis
- 11.2.6.4. Recent Developments
- 11.2.6.5. Financials (Based on Availability)
- 11.2.7 Functional Formularies*List Not Exhaustive
- 11.2.7.1. Overview
- 11.2.7.2. Products
- 11.2.7.3. SWOT Analysis
- 11.2.7.4. Recent Developments
- 11.2.7.5. Financials (Based on Availability)
- 11.2.8 Hormel Foods Corporation
- 11.2.8.1. Overview
- 11.2.8.2. Products
- 11.2.8.3. SWOT Analysis
- 11.2.8.4. Recent Developments
- 11.2.8.5. Financials (Based on Availability)
- 11.2.9 B Braun Melsungen AG
- 11.2.9.1. Overview
- 11.2.9.2. Products
- 11.2.9.3. SWOT Analysis
- 11.2.9.4. Recent Developments
- 11.2.9.5. Financials (Based on Availability)
- 11.2.10 Victus Inc
- 11.2.10.1. Overview
- 11.2.10.2. Products
- 11.2.10.3. SWOT Analysis
- 11.2.10.4. Recent Developments
- 11.2.10.5. Financials (Based on Availability)
- 11.2.11 Reckitt Benckiser Group plc (Mead Johnson)
- 11.2.11.1. Overview
- 11.2.11.2. Products
- 11.2.11.3. SWOT Analysis
- 11.2.11.4. Recent Developments
- 11.2.11.5. Financials (Based on Availability)
- 11.2.12 Kate Farms
- 11.2.12.1. Overview
- 11.2.12.2. Products
- 11.2.12.3. SWOT Analysis
- 11.2.12.4. Recent Developments
- 11.2.12.5. Financials (Based on Availability)
- 11.2.1 Nestle SA
List of Figures
- Figure 1: Global Enteral Feeding Formula Industry Revenue Breakdown (Million, %) by Region 2025 & 2033
- Figure 2: North America Enteral Feeding Formula Industry Revenue (Million), by Product 2025 & 2033
- Figure 3: North America Enteral Feeding Formula Industry Revenue Share (%), by Product 2025 & 2033
- Figure 4: North America Enteral Feeding Formula Industry Revenue (Million), by Application 2025 & 2033
- Figure 5: North America Enteral Feeding Formula Industry Revenue Share (%), by Application 2025 & 2033
- Figure 6: North America Enteral Feeding Formula Industry Revenue (Million), by End User 2025 & 2033
- Figure 7: North America Enteral Feeding Formula Industry Revenue Share (%), by End User 2025 & 2033
- Figure 8: North America Enteral Feeding Formula Industry Revenue (Million), by Distributuion Channel 2025 & 2033
- Figure 9: North America Enteral Feeding Formula Industry Revenue Share (%), by Distributuion Channel 2025 & 2033
- Figure 10: North America Enteral Feeding Formula Industry Revenue (Million), by Country 2025 & 2033
- Figure 11: North America Enteral Feeding Formula Industry Revenue Share (%), by Country 2025 & 2033
- Figure 12: Europe Enteral Feeding Formula Industry Revenue (Million), by Product 2025 & 2033
- Figure 13: Europe Enteral Feeding Formula Industry Revenue Share (%), by Product 2025 & 2033
- Figure 14: Europe Enteral Feeding Formula Industry Revenue (Million), by Application 2025 & 2033
- Figure 15: Europe Enteral Feeding Formula Industry Revenue Share (%), by Application 2025 & 2033
- Figure 16: Europe Enteral Feeding Formula Industry Revenue (Million), by End User 2025 & 2033
- Figure 17: Europe Enteral Feeding Formula Industry Revenue Share (%), by End User 2025 & 2033
- Figure 18: Europe Enteral Feeding Formula Industry Revenue (Million), by Distributuion Channel 2025 & 2033
- Figure 19: Europe Enteral Feeding Formula Industry Revenue Share (%), by Distributuion Channel 2025 & 2033
- Figure 20: Europe Enteral Feeding Formula Industry Revenue (Million), by Country 2025 & 2033
- Figure 21: Europe Enteral Feeding Formula Industry Revenue Share (%), by Country 2025 & 2033
- Figure 22: Asia Pacific Enteral Feeding Formula Industry Revenue (Million), by Product 2025 & 2033
- Figure 23: Asia Pacific Enteral Feeding Formula Industry Revenue Share (%), by Product 2025 & 2033
- Figure 24: Asia Pacific Enteral Feeding Formula Industry Revenue (Million), by Application 2025 & 2033
- Figure 25: Asia Pacific Enteral Feeding Formula Industry Revenue Share (%), by Application 2025 & 2033
- Figure 26: Asia Pacific Enteral Feeding Formula Industry Revenue (Million), by End User 2025 & 2033
- Figure 27: Asia Pacific Enteral Feeding Formula Industry Revenue Share (%), by End User 2025 & 2033
- Figure 28: Asia Pacific Enteral Feeding Formula Industry Revenue (Million), by Distributuion Channel 2025 & 2033
- Figure 29: Asia Pacific Enteral Feeding Formula Industry Revenue Share (%), by Distributuion Channel 2025 & 2033
- Figure 30: Asia Pacific Enteral Feeding Formula Industry Revenue (Million), by Country 2025 & 2033
- Figure 31: Asia Pacific Enteral Feeding Formula Industry Revenue Share (%), by Country 2025 & 2033
- Figure 32: Middle East and Africa Enteral Feeding Formula Industry Revenue (Million), by Product 2025 & 2033
- Figure 33: Middle East and Africa Enteral Feeding Formula Industry Revenue Share (%), by Product 2025 & 2033
- Figure 34: Middle East and Africa Enteral Feeding Formula Industry Revenue (Million), by Application 2025 & 2033
- Figure 35: Middle East and Africa Enteral Feeding Formula Industry Revenue Share (%), by Application 2025 & 2033
- Figure 36: Middle East and Africa Enteral Feeding Formula Industry Revenue (Million), by End User 2025 & 2033
- Figure 37: Middle East and Africa Enteral Feeding Formula Industry Revenue Share (%), by End User 2025 & 2033
- Figure 38: Middle East and Africa Enteral Feeding Formula Industry Revenue (Million), by Distributuion Channel 2025 & 2033
- Figure 39: Middle East and Africa Enteral Feeding Formula Industry Revenue Share (%), by Distributuion Channel 2025 & 2033
- Figure 40: Middle East and Africa Enteral Feeding Formula Industry Revenue (Million), by Country 2025 & 2033
- Figure 41: Middle East and Africa Enteral Feeding Formula Industry Revenue Share (%), by Country 2025 & 2033
- Figure 42: South America Enteral Feeding Formula Industry Revenue (Million), by Product 2025 & 2033
- Figure 43: South America Enteral Feeding Formula Industry Revenue Share (%), by Product 2025 & 2033
- Figure 44: South America Enteral Feeding Formula Industry Revenue (Million), by Application 2025 & 2033
- Figure 45: South America Enteral Feeding Formula Industry Revenue Share (%), by Application 2025 & 2033
- Figure 46: South America Enteral Feeding Formula Industry Revenue (Million), by End User 2025 & 2033
- Figure 47: South America Enteral Feeding Formula Industry Revenue Share (%), by End User 2025 & 2033
- Figure 48: South America Enteral Feeding Formula Industry Revenue (Million), by Distributuion Channel 2025 & 2033
- Figure 49: South America Enteral Feeding Formula Industry Revenue Share (%), by Distributuion Channel 2025 & 2033
- Figure 50: South America Enteral Feeding Formula Industry Revenue (Million), by Country 2025 & 2033
- Figure 51: South America Enteral Feeding Formula Industry Revenue Share (%), by Country 2025 & 2033
List of Tables
- Table 1: Global Enteral Feeding Formula Industry Revenue Million Forecast, by Product 2020 & 2033
- Table 2: Global Enteral Feeding Formula Industry Revenue Million Forecast, by Application 2020 & 2033
- Table 3: Global Enteral Feeding Formula Industry Revenue Million Forecast, by End User 2020 & 2033
- Table 4: Global Enteral Feeding Formula Industry Revenue Million Forecast, by Distributuion Channel 2020 & 2033
- Table 5: Global Enteral Feeding Formula Industry Revenue Million Forecast, by Region 2020 & 2033
- Table 6: Global Enteral Feeding Formula Industry Revenue Million Forecast, by Product 2020 & 2033
- Table 7: Global Enteral Feeding Formula Industry Revenue Million Forecast, by Application 2020 & 2033
- Table 8: Global Enteral Feeding Formula Industry Revenue Million Forecast, by End User 2020 & 2033
- Table 9: Global Enteral Feeding Formula Industry Revenue Million Forecast, by Distributuion Channel 2020 & 2033
- Table 10: Global Enteral Feeding Formula Industry Revenue Million Forecast, by Country 2020 & 2033
- Table 11: United States Enteral Feeding Formula Industry Revenue (Million) Forecast, by Application 2020 & 2033
- Table 12: Canada Enteral Feeding Formula Industry Revenue (Million) Forecast, by Application 2020 & 2033
- Table 13: Mexico Enteral Feeding Formula Industry Revenue (Million) Forecast, by Application 2020 & 2033
- Table 14: Global Enteral Feeding Formula Industry Revenue Million Forecast, by Product 2020 & 2033
- Table 15: Global Enteral Feeding Formula Industry Revenue Million Forecast, by Application 2020 & 2033
- Table 16: Global Enteral Feeding Formula Industry Revenue Million Forecast, by End User 2020 & 2033
- Table 17: Global Enteral Feeding Formula Industry Revenue Million Forecast, by Distributuion Channel 2020 & 2033
- Table 18: Global Enteral Feeding Formula Industry Revenue Million Forecast, by Country 2020 & 2033
- Table 19: Germany Enteral Feeding Formula Industry Revenue (Million) Forecast, by Application 2020 & 2033
- Table 20: United Kingdom Enteral Feeding Formula Industry Revenue (Million) Forecast, by Application 2020 & 2033
- Table 21: France Enteral Feeding Formula Industry Revenue (Million) Forecast, by Application 2020 & 2033
- Table 22: Italy Enteral Feeding Formula Industry Revenue (Million) Forecast, by Application 2020 & 2033
- Table 23: Spain Enteral Feeding Formula Industry Revenue (Million) Forecast, by Application 2020 & 2033
- Table 24: Rest of Europe Enteral Feeding Formula Industry Revenue (Million) Forecast, by Application 2020 & 2033
- Table 25: Global Enteral Feeding Formula Industry Revenue Million Forecast, by Product 2020 & 2033
- Table 26: Global Enteral Feeding Formula Industry Revenue Million Forecast, by Application 2020 & 2033
- Table 27: Global Enteral Feeding Formula Industry Revenue Million Forecast, by End User 2020 & 2033
- Table 28: Global Enteral Feeding Formula Industry Revenue Million Forecast, by Distributuion Channel 2020 & 2033
- Table 29: Global Enteral Feeding Formula Industry Revenue Million Forecast, by Country 2020 & 2033
- Table 30: China Enteral Feeding Formula Industry Revenue (Million) Forecast, by Application 2020 & 2033
- Table 31: Japan Enteral Feeding Formula Industry Revenue (Million) Forecast, by Application 2020 & 2033
- Table 32: India Enteral Feeding Formula Industry Revenue (Million) Forecast, by Application 2020 & 2033
- Table 33: Australia Enteral Feeding Formula Industry Revenue (Million) Forecast, by Application 2020 & 2033
- Table 34: South Korea Enteral Feeding Formula Industry Revenue (Million) Forecast, by Application 2020 & 2033
- Table 35: Rest of Asia Pacific Enteral Feeding Formula Industry Revenue (Million) Forecast, by Application 2020 & 2033
- Table 36: Global Enteral Feeding Formula Industry Revenue Million Forecast, by Product 2020 & 2033
- Table 37: Global Enteral Feeding Formula Industry Revenue Million Forecast, by Application 2020 & 2033
- Table 38: Global Enteral Feeding Formula Industry Revenue Million Forecast, by End User 2020 & 2033
- Table 39: Global Enteral Feeding Formula Industry Revenue Million Forecast, by Distributuion Channel 2020 & 2033
- Table 40: Global Enteral Feeding Formula Industry Revenue Million Forecast, by Country 2020 & 2033
- Table 41: GCC Enteral Feeding Formula Industry Revenue (Million) Forecast, by Application 2020 & 2033
- Table 42: South Africa Enteral Feeding Formula Industry Revenue (Million) Forecast, by Application 2020 & 2033
- Table 43: Rest of Middle East and Africa Enteral Feeding Formula Industry Revenue (Million) Forecast, by Application 2020 & 2033
- Table 44: Global Enteral Feeding Formula Industry Revenue Million Forecast, by Product 2020 & 2033
- Table 45: Global Enteral Feeding Formula Industry Revenue Million Forecast, by Application 2020 & 2033
- Table 46: Global Enteral Feeding Formula Industry Revenue Million Forecast, by End User 2020 & 2033
- Table 47: Global Enteral Feeding Formula Industry Revenue Million Forecast, by Distributuion Channel 2020 & 2033
- Table 48: Global Enteral Feeding Formula Industry Revenue Million Forecast, by Country 2020 & 2033
- Table 49: Brazil Enteral Feeding Formula Industry Revenue (Million) Forecast, by Application 2020 & 2033
- Table 50: Argentina Enteral Feeding Formula Industry Revenue (Million) Forecast, by Application 2020 & 2033
- Table 51: Rest of South America Enteral Feeding Formula Industry Revenue (Million) Forecast, by Application 2020 & 2033
Frequently Asked Questions
1. What is the projected Compound Annual Growth Rate (CAGR) of the Enteral Feeding Formula Industry?
The projected CAGR is approximately 5.18%.
2. Which companies are prominent players in the Enteral Feeding Formula Industry?
Key companies in the market include Nestle SA, Fresenius SE & Co KgaA (Fresenius Kabi AG), Meiji Holdings Co Ltd, Global Health Product Inc, Abbott Laboratories, Danone SA (Nutricia), Functional Formularies*List Not Exhaustive, Hormel Foods Corporation, B Braun Melsungen AG, Victus Inc, Reckitt Benckiser Group plc (Mead Johnson), Kate Farms.
3. What are the main segments of the Enteral Feeding Formula Industry?
The market segments include Product, Application, End User, Distributuion Channel.
4. Can you provide details about the market size?
The market size is estimated to be USD 8.77 Million as of 2022.
5. What are some drivers contributing to market growth?
Increasing Prevalence of Metabolic and Chronic Diseases; Increasing Spending on Patient Care; Growing Geriatric Population.
6. What are the notable trends driving market growth?
Oncology Segment is Expected to Hold a Significant Market Share in the Enteral Feeding Formulas Market.
7. Are there any restraints impacting market growth?
Complications Associated with Enteral Nutrition; High Cost and Low Adherence Rates in Developing Countries.
8. Can you provide examples of recent developments in the market?
September 2022: Kate Farms raised USD 75 million in a Series C funding round led by life-science investor Novo Holdings. With this, Kate Farms will be able to increase its efforts in developing plant-based clinical nutrition research, product innovation, and development into more channels.
9. What pricing options are available for accessing the report?
Pricing options include single-user, multi-user, and enterprise licenses priced at USD 4750, USD 5250, and USD 8750 respectively.
10. Is the market size provided in terms of value or volume?
The market size is provided in terms of value, measured in Million.
11. Are there any specific market keywords associated with the report?
Yes, the market keyword associated with the report is "Enteral Feeding Formula Industry," which aids in identifying and referencing the specific market segment covered.
12. How do I determine which pricing option suits my needs best?
The pricing options vary based on user requirements and access needs. Individual users may opt for single-user licenses, while businesses requiring broader access may choose multi-user or enterprise licenses for cost-effective access to the report.
13. Are there any additional resources or data provided in the Enteral Feeding Formula Industry report?
While the report offers comprehensive insights, it's advisable to review the specific contents or supplementary materials provided to ascertain if additional resources or data are available.
14. How can I stay updated on further developments or reports in the Enteral Feeding Formula Industry?
To stay informed about further developments, trends, and reports in the Enteral Feeding Formula Industry, consider subscribing to industry newsletters, following relevant companies and organizations, or regularly checking reputable industry news sources and publications.
Methodology
Step 1 - Identification of Relevant Samples Size from Population Database


Step 2 - Approaches for Defining Global Market Size (Value, Volume* & Price*)

Note*: In applicable scenarios
Step 3 - Data Sources
Primary Research
- Web Analytics
- Survey Reports
- Research Institute
- Latest Research Reports
- Opinion Leaders
Secondary Research
- Annual Reports
- White Paper
- Latest Press Release
- Industry Association
- Paid Database
- Investor Presentations

Step 4 - Data Triangulation
Involves using different sources of information in order to increase the validity of a study
These sources are likely to be stakeholders in a program - participants, other researchers, program staff, other community members, and so on.
Then we put all data in single framework & apply various statistical tools to find out the dynamic on the market.
During the analysis stage, feedback from the stakeholder groups would be compared to determine areas of agreement as well as areas of divergence