

Key Insights
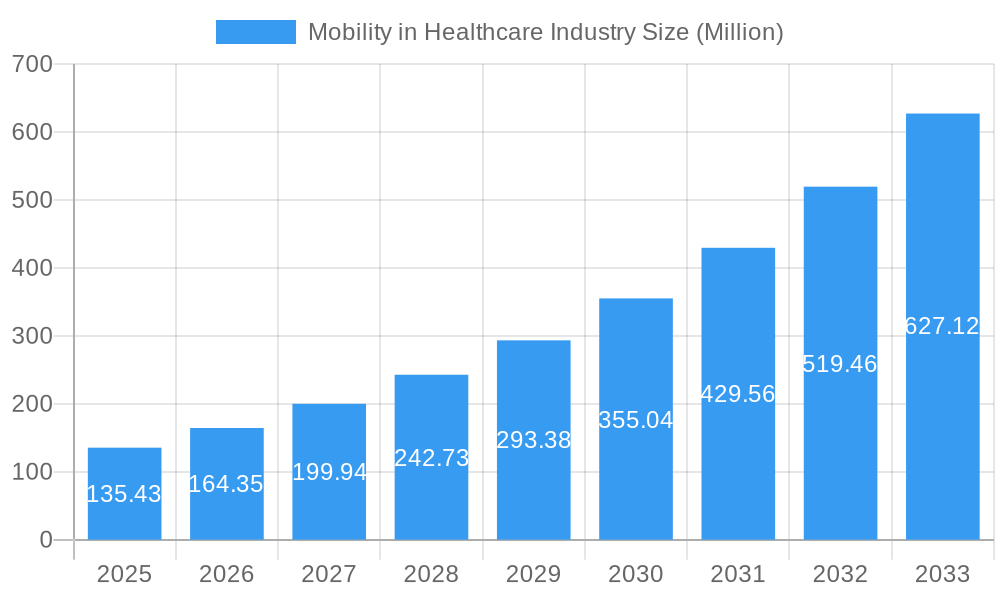
The global mobility in healthcare market, valued at $135.43 million in 2025, is experiencing robust growth, projected to expand significantly through 2033. A compound annual growth rate (CAGR) of 21.32% signifies a rapidly evolving landscape driven by several key factors. The increasing adoption of mobile health (mHealth) applications for remote patient monitoring, telehealth consultations, and chronic disease management is a primary catalyst. Furthermore, the rising demand for enterprise mobility platforms to enhance operational efficiency within healthcare organizations, coupled with the proliferation of mobile devices and robust mobile data networks, fuels this market expansion. The integration of mobile technology across various healthcare segments, including payers, providers, and patients, is streamlining workflows, improving care coordination, and enhancing patient engagement. Technological advancements, such as the development of sophisticated healthcare-specific apps and the increasing affordability of mobile devices, contribute to market growth. However, challenges remain, including concerns over data security and privacy, interoperability issues between different systems, and the digital literacy gap among some patient populations, which represent potential restraints. The market is segmented by product (enterprise mobility platforms, mobile applications, mobile devices) and application (enterprise solutions, workforce management, mHealth). North America currently holds a significant market share, but the Asia-Pacific region is anticipated to experience substantial growth driven by increasing smartphone penetration and government initiatives promoting digital healthcare.
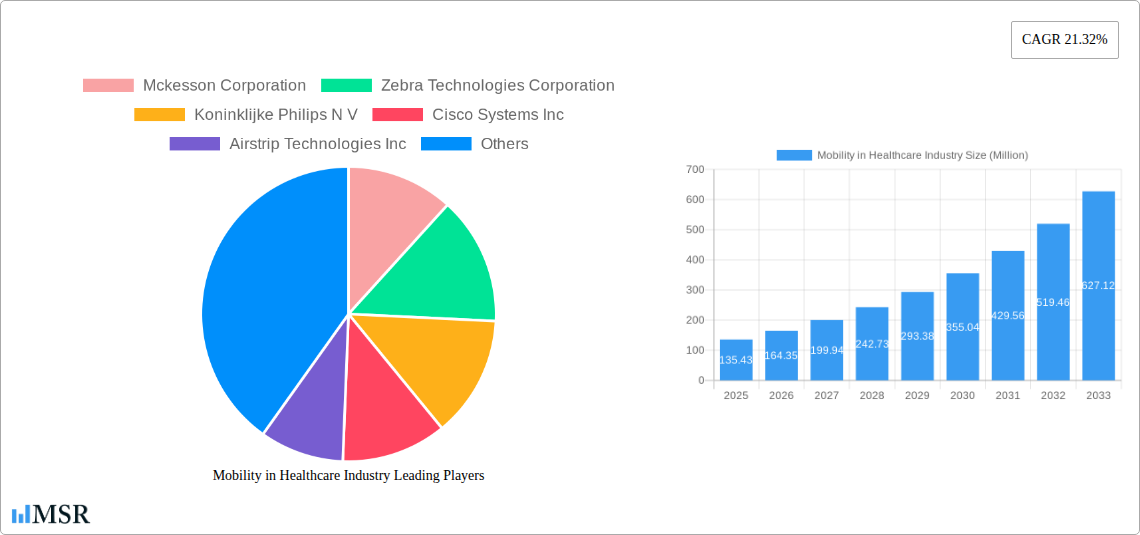
Mobility in Healthcare Industry Market Size (In Million)
The competitive landscape comprises established players like McKesson, Zebra Technologies, Philips, Cisco, and emerging technology firms specializing in mHealth solutions. Strategic partnerships and mergers and acquisitions are common strategies to expand market presence and technological capabilities. The market is expected to see continuous innovation in areas such as artificial intelligence (AI)-powered diagnostic tools integrated into mobile applications, wearable health trackers providing real-time patient data, and the development of secure cloud-based platforms for data storage and exchange. Addressing data privacy concerns and fostering wider technology adoption among healthcare professionals and patients will be crucial for realizing the full potential of this transformative market. Future growth will depend on successful navigation of regulatory hurdles and ongoing investment in cybersecurity infrastructure to ensure patient data confidentiality.
Mobility in Healthcare Industry Company Market Share
Unlocking Growth in the $xx Billion Mobility in Healthcare Industry: A Comprehensive Market Report (2019-2033)
This comprehensive report provides an in-depth analysis of the Mobility in Healthcare Industry, projecting a market valuation of $xx Billion by 2033. It examines market dynamics, key players, technological advancements, and emerging opportunities across various segments, empowering stakeholders to make informed strategic decisions. The study period spans 2019-2033, with 2025 serving as the base and estimated year. The forecast period is 2025-2033, and the historical period covers 2019-2024.
Mobility in Healthcare Industry Market Concentration & Dynamics
The Mobility in Healthcare Industry is characterized by a moderately concentrated market, with key players like McKesson Corporation, Zebra Technologies Corporation, and Koninklijke Philips N.V. holding significant market share. However, the ecosystem is dynamic, fueled by continuous innovation and strategic mergers and acquisitions (M&A). Regulatory frameworks, particularly concerning data privacy and security (HIPAA compliance), significantly impact market growth. Substitute products, such as traditional communication methods, pose a limited threat, given the increasing demand for efficiency and accessibility. End-user trends, particularly the growing adoption of telehealth and remote patient monitoring, are driving market expansion.
- Market Share: McKesson Corporation holds an estimated xx% market share in 2025, followed by Zebra Technologies Corporation with xx%.
- M&A Activity: The number of M&A deals in the sector averaged xx per year during the historical period (2019-2024), indicating a high level of consolidation and strategic investment.
- Innovation Ecosystems: Strong collaboration between technology providers, healthcare institutions, and regulatory bodies is fostering innovation in areas such as mHealth applications and enterprise mobility platforms.
Mobility in Healthcare Industry Industry Insights & Trends
The global Mobility in Healthcare Industry is experiencing robust growth, driven by the rising adoption of mobile technologies across healthcare settings. The market size is estimated at $xx Billion in 2025, exhibiting a Compound Annual Growth Rate (CAGR) of xx% during the forecast period (2025-2033). Key growth drivers include the increasing demand for improved patient care, the expansion of telehealth services, and the need for streamlined workforce management. Technological disruptions, particularly the emergence of 5G and Artificial Intelligence (AI) capabilities integrated into mobile devices and applications, are transforming the industry landscape. Consumer behavior is shifting towards greater preference for convenience and personalized healthcare experiences delivered through mobile platforms.
Key Markets & Segments Leading Mobility in Healthcare Industry
North America currently dominates the Mobility in Healthcare Industry, driven by factors like advanced healthcare infrastructure, high technological adoption, and substantial investments in healthcare IT. However, significant growth opportunities exist in emerging markets in Asia-Pacific and Latin America due to rising disposable incomes and increased government initiatives to improve healthcare access.
Dominant Segments:
- Products & Services: Enterprise Mobility Platforms, Mobile Applications (Apps), Mobile Devices represent the largest revenue streams. Enterprise mobility platforms lead due to their role in integrating multiple systems. Mobile Applications (Apps) grow rapidly with a focus on patient engagement and remote monitoring.
- Application: Enterprise Solutions holds the highest market share, attributed to the need for efficient workflow management across hospitals and healthcare organizations.
- End User: Providers show the largest segment volume, given the increasing reliance on mobile devices for patient care and administrative tasks.
Drivers:
- Economic Growth: Rising disposable incomes in developing economies are fueling the demand for advanced healthcare solutions.
- Technological Advancements: The continuous development of more sophisticated mobile devices, applications, and network infrastructure accelerate market growth.
- Government Initiatives: Government investments in health technology infrastructure and digitalization projects support the expansion of mobile healthcare solutions.
Mobility in Healthcare Industry Product Developments
Significant advancements in mobile technology are transforming healthcare delivery. New products include AI-powered diagnostic tools integrated into mobile devices, enabling faster and more accurate diagnoses. Wearable sensors and remote monitoring systems offer continuous patient data collection and real-time health tracking. These innovations are enhancing patient care, optimizing workflow, and improving operational efficiency, providing competitive advantages to providers leveraging them.
Challenges in the Mobility in Healthcare Industry Market
The Mobility in Healthcare Industry faces challenges like stringent regulatory compliance requirements (e.g., HIPAA), which can increase development and deployment costs. Supply chain disruptions related to semiconductor shortages or geopolitical instability can affect the availability of essential components. Intense competition from established players and new entrants further complicates the market landscape. These factors may lead to delayed adoption and increased costs.
Forces Driving Mobility in Healthcare Industry Growth
Technological advancements in areas such as 5G, AI, and IoT are key drivers, promising seamless connectivity, improved data analytics, and more sophisticated remote monitoring. Government regulations incentivizing digital health transformation, such as funding for telehealth initiatives, create opportunities for expansion. The increasing demand for accessible and affordable healthcare globally fuels the adoption of cost-effective mobile solutions.
Long-Term Growth Catalysts in Mobility in Healthcare Industry
Strategic partnerships between technology providers and healthcare organizations accelerate innovation and market penetration. Expansion into new markets, particularly in developing economies with limited healthcare infrastructure, holds immense potential. Continuous innovation in mobile applications, such as personalized medication reminders and virtual consultations, will contribute significantly to long-term growth.
Emerging Opportunities in Mobility in Healthcare Industry
The integration of blockchain technology for secure data management presents new opportunities. The development of mobile-first applications tailored to specific demographics (e.g., elderly patients) and healthcare needs is becoming increasingly crucial. Expansion into underserved communities via mobile health initiatives creates large growth potential.
Leading Players in the Mobility in Healthcare Industry Sector
Key Milestones in Mobility in Healthcare Industry Industry
- August 2022: Indonesia's Health Ministry launched the Indonesia Health Services platform, marking a significant step in the country's digital health transformation. This initiative showcases the potential of mobile platforms for improving healthcare accessibility and efficiency on a national scale.
- June 2022: athenahealth, Inc. launched its athenaOne Voice Assistant, demonstrating the growing role of voice-activated technology in streamlining clinical workflows and enhancing provider efficiency. This signifies a major advancement in the integration of AI within mobile healthcare applications.
Strategic Outlook for Mobility in Healthcare Industry Market
The Mobility in Healthcare Industry is poised for significant growth, driven by ongoing technological advancements, favorable regulatory environments, and an increasing demand for efficient, accessible, and personalized healthcare services. Strategic opportunities exist for companies that can effectively address the challenges of data security, interoperability, and market regulation while leveraging technological innovations to enhance patient care and operational efficiency. The long-term outlook is exceptionally positive, suggesting a continued expansion of this dynamic and crucial sector.
Mobility in Healthcare Industry Segmentation
-
1. Products and Services
- 1.1. Enterprise Mobility Platforms
- 1.2. Mobile Applications (Apps)
- 1.3. Mobile Devices
-
2. Application
-
2.1. Enterprise Solutions
- 2.1.1. Operation Management
- 2.1.2. Patient Care Management
- 2.1.3. Work Force Management
- 2.2. mHealth Applications
-
2.1. Enterprise Solutions
-
3. End User
- 3.1. Payers
- 3.2. Providers
- 3.3. Patients
Mobility in Healthcare Industry Segmentation By Geography
-
1. North America
- 1.1. United States
- 1.2. Canada
- 1.3. Mexico
-
2. Europe
- 2.1. Germany
- 2.2. United Kingdom
- 2.3. France
- 2.4. Italy
- 2.5. Spain
- 2.6. Rest of Europe
-
3. Asia Pacific
- 3.1. China
- 3.2. Japan
- 3.3. India
- 3.4. Australia
- 3.5. South Korea
- 3.6. Rest of Asia Pacific
- 4. Middle East
-
5. GCC
- 5.1. South Africa
- 5.2. Rest of Middle East
-
6. South America
- 6.1. Brazil
- 6.2. Argentina
- 6.3. Rest of South America
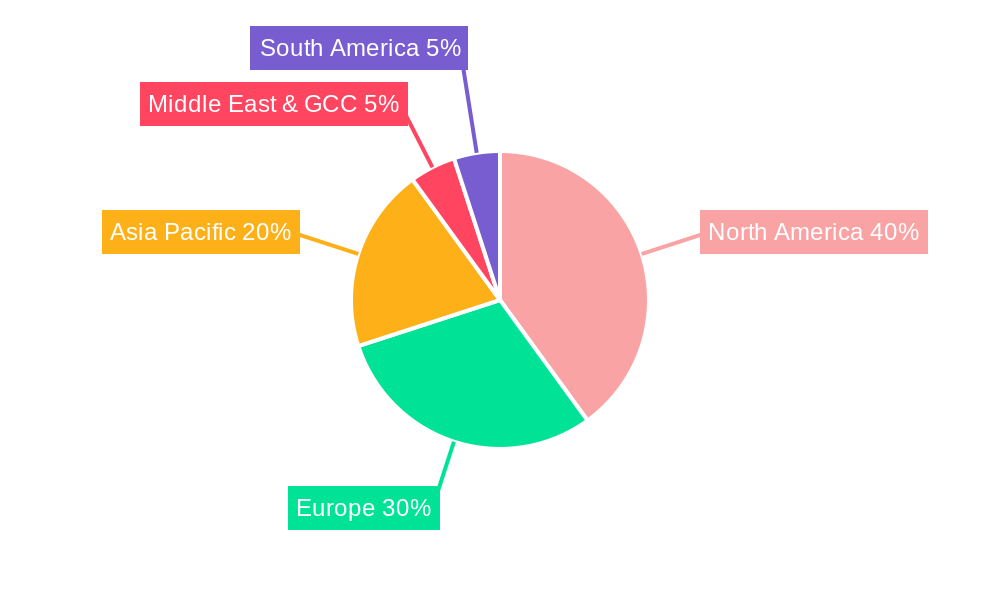
Mobility in Healthcare Industry Regional Market Share
Geographic Coverage of Mobility in Healthcare Industry
Mobility in Healthcare Industry REPORT HIGHLIGHTS
| Aspects | Details |
|---|---|
| Study Period | 2020-2034 |
| Base Year | 2025 |
| Estimated Year | 2026 |
| Forecast Period | 2026-2034 |
| Historical Period | 2020-2025 |
| Growth Rate | CAGR of 21.32% from 2020-2034 |
| Segmentation |
|
Table of Contents
- 1. Introduction
- 1.1. Research Scope
- 1.2. Market Segmentation
- 1.3. Research Objective
- 1.4. Definitions and Assumptions
- 2. Executive Summary
- 2.1. Market Snapshot
- 3. Market Dynamics
- 3.1. Market Drivers
- 3.2. Market Restrains
- 3.3. Market Trends
- 3.4. Market Opportunities
- 4. Market Factor Analysis
- 4.1. Porters Five Forces
- 4.1.1. Bargaining Power of Suppliers
- 4.1.2. Bargaining Power of Buyers
- 4.1.3. Threat of New Entrants
- 4.1.4. Threat of Substitutes
- 4.1.5. Competitive Rivalry
- 4.2. PESTEL analysis
- 4.3. BCG Analysis
- 4.3.1. Stars (High Growth, High Market Share)
- 4.3.2. Cash Cows (Low Growth, High Market Share)
- 4.3.3. Question Mark (High Growth, Low Market Share)
- 4.3.4. Dogs (Low Growth, Low Market Share)
- 4.4. Ansoff Matrix Analysis
- 4.5. Supply Chain Analysis
- 4.6. Regulatory Landscape
- 4.7. Current Market Potential and Opportunity Assessment (TAM–SAM–SOM Framework)
- 4.8. MSR Analyst Note
- 4.1. Porters Five Forces
- 5. Market Analysis, Insights and Forecast 2021-2033
- 5.1. Market Analysis, Insights and Forecast - by Products and Services
- 5.1.1. Enterprise Mobility Platforms
- 5.1.2. Mobile Applications (Apps)
- 5.1.3. Mobile Devices
- 5.2. Market Analysis, Insights and Forecast - by Application
- 5.2.1. Enterprise Solutions
- 5.2.1.1. Operation Management
- 5.2.1.2. Patient Care Management
- 5.2.1.3. Work Force Management
- 5.2.2. mHealth Applications
- 5.2.1. Enterprise Solutions
- 5.3. Market Analysis, Insights and Forecast - by End User
- 5.3.1. Payers
- 5.3.2. Providers
- 5.3.3. Patients
- 5.4. Market Analysis, Insights and Forecast - by Region
- 5.4.1. North America
- 5.4.2. Europe
- 5.4.3. Asia Pacific
- 5.4.4. Middle East
- 5.4.5. GCC
- 5.4.6. South America
- 5.1. Market Analysis, Insights and Forecast - by Products and Services
- 6. Global Mobility in Healthcare Industry Analysis, Insights and Forecast, 2021-2033
- 6.1. Market Analysis, Insights and Forecast - by Products and Services
- 6.1.1. Enterprise Mobility Platforms
- 6.1.2. Mobile Applications (Apps)
- 6.1.3. Mobile Devices
- 6.2. Market Analysis, Insights and Forecast - by Application
- 6.2.1. Enterprise Solutions
- 6.2.1.1. Operation Management
- 6.2.1.2. Patient Care Management
- 6.2.1.3. Work Force Management
- 6.2.2. mHealth Applications
- 6.2.1. Enterprise Solutions
- 6.3. Market Analysis, Insights and Forecast - by End User
- 6.3.1. Payers
- 6.3.2. Providers
- 6.3.3. Patients
- 6.1. Market Analysis, Insights and Forecast - by Products and Services
- 7. North America Mobility in Healthcare Industry Analysis, Insights and Forecast, 2020-2032
- 7.1. Market Analysis, Insights and Forecast - by Products and Services
- 7.1.1. Enterprise Mobility Platforms
- 7.1.2. Mobile Applications (Apps)
- 7.1.3. Mobile Devices
- 7.2. Market Analysis, Insights and Forecast - by Application
- 7.2.1. Enterprise Solutions
- 7.2.1.1. Operation Management
- 7.2.1.2. Patient Care Management
- 7.2.1.3. Work Force Management
- 7.2.2. mHealth Applications
- 7.2.1. Enterprise Solutions
- 7.3. Market Analysis, Insights and Forecast - by End User
- 7.3.1. Payers
- 7.3.2. Providers
- 7.3.3. Patients
- 7.1. Market Analysis, Insights and Forecast - by Products and Services
- 8. Europe Mobility in Healthcare Industry Analysis, Insights and Forecast, 2020-2032
- 8.1. Market Analysis, Insights and Forecast - by Products and Services
- 8.1.1. Enterprise Mobility Platforms
- 8.1.2. Mobile Applications (Apps)
- 8.1.3. Mobile Devices
- 8.2. Market Analysis, Insights and Forecast - by Application
- 8.2.1. Enterprise Solutions
- 8.2.1.1. Operation Management
- 8.2.1.2. Patient Care Management
- 8.2.1.3. Work Force Management
- 8.2.2. mHealth Applications
- 8.2.1. Enterprise Solutions
- 8.3. Market Analysis, Insights and Forecast - by End User
- 8.3.1. Payers
- 8.3.2. Providers
- 8.3.3. Patients
- 8.1. Market Analysis, Insights and Forecast - by Products and Services
- 9. Asia Pacific Mobility in Healthcare Industry Analysis, Insights and Forecast, 2020-2032
- 9.1. Market Analysis, Insights and Forecast - by Products and Services
- 9.1.1. Enterprise Mobility Platforms
- 9.1.2. Mobile Applications (Apps)
- 9.1.3. Mobile Devices
- 9.2. Market Analysis, Insights and Forecast - by Application
- 9.2.1. Enterprise Solutions
- 9.2.1.1. Operation Management
- 9.2.1.2. Patient Care Management
- 9.2.1.3. Work Force Management
- 9.2.2. mHealth Applications
- 9.2.1. Enterprise Solutions
- 9.3. Market Analysis, Insights and Forecast - by End User
- 9.3.1. Payers
- 9.3.2. Providers
- 9.3.3. Patients
- 9.1. Market Analysis, Insights and Forecast - by Products and Services
- 10. Middle East Mobility in Healthcare Industry Analysis, Insights and Forecast, 2020-2032
- 10.1. Market Analysis, Insights and Forecast - by Products and Services
- 10.1.1. Enterprise Mobility Platforms
- 10.1.2. Mobile Applications (Apps)
- 10.1.3. Mobile Devices
- 10.2. Market Analysis, Insights and Forecast - by Application
- 10.2.1. Enterprise Solutions
- 10.2.1.1. Operation Management
- 10.2.1.2. Patient Care Management
- 10.2.1.3. Work Force Management
- 10.2.2. mHealth Applications
- 10.2.1. Enterprise Solutions
- 10.3. Market Analysis, Insights and Forecast - by End User
- 10.3.1. Payers
- 10.3.2. Providers
- 10.3.3. Patients
- 10.1. Market Analysis, Insights and Forecast - by Products and Services
- 11. GCC Mobility in Healthcare Industry Analysis, Insights and Forecast, 2020-2032
- 11.1. Market Analysis, Insights and Forecast - by Products and Services
- 11.1.1. Enterprise Mobility Platforms
- 11.1.2. Mobile Applications (Apps)
- 11.1.3. Mobile Devices
- 11.2. Market Analysis, Insights and Forecast - by Application
- 11.2.1. Enterprise Solutions
- 11.2.1.1. Operation Management
- 11.2.1.2. Patient Care Management
- 11.2.1.3. Work Force Management
- 11.2.2. mHealth Applications
- 11.2.1. Enterprise Solutions
- 11.3. Market Analysis, Insights and Forecast - by End User
- 11.3.1. Payers
- 11.3.2. Providers
- 11.3.3. Patients
- 11.1. Market Analysis, Insights and Forecast - by Products and Services
- 12. South America Mobility in Healthcare Industry Analysis, Insights and Forecast, 2020-2032
- 12.1. Market Analysis, Insights and Forecast - by Products and Services
- 12.1.1. Enterprise Mobility Platforms
- 12.1.2. Mobile Applications (Apps)
- 12.1.3. Mobile Devices
- 12.2. Market Analysis, Insights and Forecast - by Application
- 12.2.1. Enterprise Solutions
- 12.2.1.1. Operation Management
- 12.2.1.2. Patient Care Management
- 12.2.1.3. Work Force Management
- 12.2.2. mHealth Applications
- 12.2.1. Enterprise Solutions
- 12.3. Market Analysis, Insights and Forecast - by End User
- 12.3.1. Payers
- 12.3.2. Providers
- 12.3.3. Patients
- 12.1. Market Analysis, Insights and Forecast - by Products and Services
- 13. Competitive Analysis
- 13.1. Company Profiles
- 13.1.1 Mckesson Corporation
- 13.1.1.1. Company Overview
- 13.1.1.2. Products
- 13.1.1.3. Company Financials
- 13.1.1.4. SWOT Analysis
- 13.1.2 Zebra Technologies Corporation
- 13.1.2.1. Company Overview
- 13.1.2.2. Products
- 13.1.2.3. Company Financials
- 13.1.2.4. SWOT Analysis
- 13.1.3 Koninklijke Philips N V
- 13.1.3.1. Company Overview
- 13.1.3.2. Products
- 13.1.3.3. Company Financials
- 13.1.3.4. SWOT Analysis
- 13.1.4 Cisco Systems Inc
- 13.1.4.1. Company Overview
- 13.1.4.2. Products
- 13.1.4.3. Company Financials
- 13.1.4.4. SWOT Analysis
- 13.1.5 Airstrip Technologies Inc
- 13.1.5.1. Company Overview
- 13.1.5.2. Products
- 13.1.5.3. Company Financials
- 13.1.5.4. SWOT Analysis
- 13.1.6 Omron Corporation
- 13.1.6.1. Company Overview
- 13.1.6.2. Products
- 13.1.6.3. Company Financials
- 13.1.6.4. SWOT Analysis
- 13.1.7 At&T Inc
- 13.1.7.1. Company Overview
- 13.1.7.2. Products
- 13.1.7.3. Company Financials
- 13.1.7.4. SWOT Analysis
- 13.1.8 SAP SE
- 13.1.8.1. Company Overview
- 13.1.8.2. Products
- 13.1.8.3. Company Financials
- 13.1.8.4. SWOT Analysis
- 13.1.9 Oracle Cerner
- 13.1.9.1. Company Overview
- 13.1.9.2. Products
- 13.1.9.3. Company Financials
- 13.1.9.4. SWOT Analysis
- 13.1.1 Mckesson Corporation
- 13.2. Market Entropy
- 13.2.1 Company's Key Areas Served
- 13.2.2 Recent Developments
- 13.3. Company Market Share Analysis 2025
- 13.3.1 Top 5 Companies Market Share Analysis
- 13.3.2 Top 3 Companies Market Share Analysis
- 13.4. List of Potential Customers
- 14. Research Methodology
List of Figures
- Figure 1: Global Mobility in Healthcare Industry Revenue Breakdown (Million, %) by Region 2025 & 2033
- Figure 2: Global Mobility in Healthcare Industry Volume Breakdown (K Unit, %) by Region 2025 & 2033
- Figure 3: North America Mobility in Healthcare Industry Revenue (Million), by Products and Services 2025 & 2033
- Figure 4: North America Mobility in Healthcare Industry Volume (K Unit), by Products and Services 2025 & 2033
- Figure 5: North America Mobility in Healthcare Industry Revenue Share (%), by Products and Services 2025 & 2033
- Figure 6: North America Mobility in Healthcare Industry Volume Share (%), by Products and Services 2025 & 2033
- Figure 7: North America Mobility in Healthcare Industry Revenue (Million), by Application 2025 & 2033
- Figure 8: North America Mobility in Healthcare Industry Volume (K Unit), by Application 2025 & 2033
- Figure 9: North America Mobility in Healthcare Industry Revenue Share (%), by Application 2025 & 2033
- Figure 10: North America Mobility in Healthcare Industry Volume Share (%), by Application 2025 & 2033
- Figure 11: North America Mobility in Healthcare Industry Revenue (Million), by End User 2025 & 2033
- Figure 12: North America Mobility in Healthcare Industry Volume (K Unit), by End User 2025 & 2033
- Figure 13: North America Mobility in Healthcare Industry Revenue Share (%), by End User 2025 & 2033
- Figure 14: North America Mobility in Healthcare Industry Volume Share (%), by End User 2025 & 2033
- Figure 15: North America Mobility in Healthcare Industry Revenue (Million), by Country 2025 & 2033
- Figure 16: North America Mobility in Healthcare Industry Volume (K Unit), by Country 2025 & 2033
- Figure 17: North America Mobility in Healthcare Industry Revenue Share (%), by Country 2025 & 2033
- Figure 18: North America Mobility in Healthcare Industry Volume Share (%), by Country 2025 & 2033
- Figure 19: Europe Mobility in Healthcare Industry Revenue (Million), by Products and Services 2025 & 2033
- Figure 20: Europe Mobility in Healthcare Industry Volume (K Unit), by Products and Services 2025 & 2033
- Figure 21: Europe Mobility in Healthcare Industry Revenue Share (%), by Products and Services 2025 & 2033
- Figure 22: Europe Mobility in Healthcare Industry Volume Share (%), by Products and Services 2025 & 2033
- Figure 23: Europe Mobility in Healthcare Industry Revenue (Million), by Application 2025 & 2033
- Figure 24: Europe Mobility in Healthcare Industry Volume (K Unit), by Application 2025 & 2033
- Figure 25: Europe Mobility in Healthcare Industry Revenue Share (%), by Application 2025 & 2033
- Figure 26: Europe Mobility in Healthcare Industry Volume Share (%), by Application 2025 & 2033
- Figure 27: Europe Mobility in Healthcare Industry Revenue (Million), by End User 2025 & 2033
- Figure 28: Europe Mobility in Healthcare Industry Volume (K Unit), by End User 2025 & 2033
- Figure 29: Europe Mobility in Healthcare Industry Revenue Share (%), by End User 2025 & 2033
- Figure 30: Europe Mobility in Healthcare Industry Volume Share (%), by End User 2025 & 2033
- Figure 31: Europe Mobility in Healthcare Industry Revenue (Million), by Country 2025 & 2033
- Figure 32: Europe Mobility in Healthcare Industry Volume (K Unit), by Country 2025 & 2033
- Figure 33: Europe Mobility in Healthcare Industry Revenue Share (%), by Country 2025 & 2033
- Figure 34: Europe Mobility in Healthcare Industry Volume Share (%), by Country 2025 & 2033
- Figure 35: Asia Pacific Mobility in Healthcare Industry Revenue (Million), by Products and Services 2025 & 2033
- Figure 36: Asia Pacific Mobility in Healthcare Industry Volume (K Unit), by Products and Services 2025 & 2033
- Figure 37: Asia Pacific Mobility in Healthcare Industry Revenue Share (%), by Products and Services 2025 & 2033
- Figure 38: Asia Pacific Mobility in Healthcare Industry Volume Share (%), by Products and Services 2025 & 2033
- Figure 39: Asia Pacific Mobility in Healthcare Industry Revenue (Million), by Application 2025 & 2033
- Figure 40: Asia Pacific Mobility in Healthcare Industry Volume (K Unit), by Application 2025 & 2033
- Figure 41: Asia Pacific Mobility in Healthcare Industry Revenue Share (%), by Application 2025 & 2033
- Figure 42: Asia Pacific Mobility in Healthcare Industry Volume Share (%), by Application 2025 & 2033
- Figure 43: Asia Pacific Mobility in Healthcare Industry Revenue (Million), by End User 2025 & 2033
- Figure 44: Asia Pacific Mobility in Healthcare Industry Volume (K Unit), by End User 2025 & 2033
- Figure 45: Asia Pacific Mobility in Healthcare Industry Revenue Share (%), by End User 2025 & 2033
- Figure 46: Asia Pacific Mobility in Healthcare Industry Volume Share (%), by End User 2025 & 2033
- Figure 47: Asia Pacific Mobility in Healthcare Industry Revenue (Million), by Country 2025 & 2033
- Figure 48: Asia Pacific Mobility in Healthcare Industry Volume (K Unit), by Country 2025 & 2033
- Figure 49: Asia Pacific Mobility in Healthcare Industry Revenue Share (%), by Country 2025 & 2033
- Figure 50: Asia Pacific Mobility in Healthcare Industry Volume Share (%), by Country 2025 & 2033
- Figure 51: Middle East Mobility in Healthcare Industry Revenue (Million), by Products and Services 2025 & 2033
- Figure 52: Middle East Mobility in Healthcare Industry Volume (K Unit), by Products and Services 2025 & 2033
- Figure 53: Middle East Mobility in Healthcare Industry Revenue Share (%), by Products and Services 2025 & 2033
- Figure 54: Middle East Mobility in Healthcare Industry Volume Share (%), by Products and Services 2025 & 2033
- Figure 55: Middle East Mobility in Healthcare Industry Revenue (Million), by Application 2025 & 2033
- Figure 56: Middle East Mobility in Healthcare Industry Volume (K Unit), by Application 2025 & 2033
- Figure 57: Middle East Mobility in Healthcare Industry Revenue Share (%), by Application 2025 & 2033
- Figure 58: Middle East Mobility in Healthcare Industry Volume Share (%), by Application 2025 & 2033
- Figure 59: Middle East Mobility in Healthcare Industry Revenue (Million), by End User 2025 & 2033
- Figure 60: Middle East Mobility in Healthcare Industry Volume (K Unit), by End User 2025 & 2033
- Figure 61: Middle East Mobility in Healthcare Industry Revenue Share (%), by End User 2025 & 2033
- Figure 62: Middle East Mobility in Healthcare Industry Volume Share (%), by End User 2025 & 2033
- Figure 63: Middle East Mobility in Healthcare Industry Revenue (Million), by Country 2025 & 2033
- Figure 64: Middle East Mobility in Healthcare Industry Volume (K Unit), by Country 2025 & 2033
- Figure 65: Middle East Mobility in Healthcare Industry Revenue Share (%), by Country 2025 & 2033
- Figure 66: Middle East Mobility in Healthcare Industry Volume Share (%), by Country 2025 & 2033
- Figure 67: GCC Mobility in Healthcare Industry Revenue (Million), by Products and Services 2025 & 2033
- Figure 68: GCC Mobility in Healthcare Industry Volume (K Unit), by Products and Services 2025 & 2033
- Figure 69: GCC Mobility in Healthcare Industry Revenue Share (%), by Products and Services 2025 & 2033
- Figure 70: GCC Mobility in Healthcare Industry Volume Share (%), by Products and Services 2025 & 2033
- Figure 71: GCC Mobility in Healthcare Industry Revenue (Million), by Application 2025 & 2033
- Figure 72: GCC Mobility in Healthcare Industry Volume (K Unit), by Application 2025 & 2033
- Figure 73: GCC Mobility in Healthcare Industry Revenue Share (%), by Application 2025 & 2033
- Figure 74: GCC Mobility in Healthcare Industry Volume Share (%), by Application 2025 & 2033
- Figure 75: GCC Mobility in Healthcare Industry Revenue (Million), by End User 2025 & 2033
- Figure 76: GCC Mobility in Healthcare Industry Volume (K Unit), by End User 2025 & 2033
- Figure 77: GCC Mobility in Healthcare Industry Revenue Share (%), by End User 2025 & 2033
- Figure 78: GCC Mobility in Healthcare Industry Volume Share (%), by End User 2025 & 2033
- Figure 79: GCC Mobility in Healthcare Industry Revenue (Million), by Country 2025 & 2033
- Figure 80: GCC Mobility in Healthcare Industry Volume (K Unit), by Country 2025 & 2033
- Figure 81: GCC Mobility in Healthcare Industry Revenue Share (%), by Country 2025 & 2033
- Figure 82: GCC Mobility in Healthcare Industry Volume Share (%), by Country 2025 & 2033
- Figure 83: South America Mobility in Healthcare Industry Revenue (Million), by Products and Services 2025 & 2033
- Figure 84: South America Mobility in Healthcare Industry Volume (K Unit), by Products and Services 2025 & 2033
- Figure 85: South America Mobility in Healthcare Industry Revenue Share (%), by Products and Services 2025 & 2033
- Figure 86: South America Mobility in Healthcare Industry Volume Share (%), by Products and Services 2025 & 2033
- Figure 87: South America Mobility in Healthcare Industry Revenue (Million), by Application 2025 & 2033
- Figure 88: South America Mobility in Healthcare Industry Volume (K Unit), by Application 2025 & 2033
- Figure 89: South America Mobility in Healthcare Industry Revenue Share (%), by Application 2025 & 2033
- Figure 90: South America Mobility in Healthcare Industry Volume Share (%), by Application 2025 & 2033
- Figure 91: South America Mobility in Healthcare Industry Revenue (Million), by End User 2025 & 2033
- Figure 92: South America Mobility in Healthcare Industry Volume (K Unit), by End User 2025 & 2033
- Figure 93: South America Mobility in Healthcare Industry Revenue Share (%), by End User 2025 & 2033
- Figure 94: South America Mobility in Healthcare Industry Volume Share (%), by End User 2025 & 2033
- Figure 95: South America Mobility in Healthcare Industry Revenue (Million), by Country 2025 & 2033
- Figure 96: South America Mobility in Healthcare Industry Volume (K Unit), by Country 2025 & 2033
- Figure 97: South America Mobility in Healthcare Industry Revenue Share (%), by Country 2025 & 2033
- Figure 98: South America Mobility in Healthcare Industry Volume Share (%), by Country 2025 & 2033
List of Tables
- Table 1: Global Mobility in Healthcare Industry Revenue Million Forecast, by Products and Services 2020 & 2033
- Table 2: Global Mobility in Healthcare Industry Volume K Unit Forecast, by Products and Services 2020 & 2033
- Table 3: Global Mobility in Healthcare Industry Revenue Million Forecast, by Application 2020 & 2033
- Table 4: Global Mobility in Healthcare Industry Volume K Unit Forecast, by Application 2020 & 2033
- Table 5: Global Mobility in Healthcare Industry Revenue Million Forecast, by End User 2020 & 2033
- Table 6: Global Mobility in Healthcare Industry Volume K Unit Forecast, by End User 2020 & 2033
- Table 7: Global Mobility in Healthcare Industry Revenue Million Forecast, by Region 2020 & 2033
- Table 8: Global Mobility in Healthcare Industry Volume K Unit Forecast, by Region 2020 & 2033
- Table 9: Global Mobility in Healthcare Industry Revenue Million Forecast, by Products and Services 2020 & 2033
- Table 10: Global Mobility in Healthcare Industry Volume K Unit Forecast, by Products and Services 2020 & 2033
- Table 11: Global Mobility in Healthcare Industry Revenue Million Forecast, by Application 2020 & 2033
- Table 12: Global Mobility in Healthcare Industry Volume K Unit Forecast, by Application 2020 & 2033
- Table 13: Global Mobility in Healthcare Industry Revenue Million Forecast, by End User 2020 & 2033
- Table 14: Global Mobility in Healthcare Industry Volume K Unit Forecast, by End User 2020 & 2033
- Table 15: Global Mobility in Healthcare Industry Revenue Million Forecast, by Country 2020 & 2033
- Table 16: Global Mobility in Healthcare Industry Volume K Unit Forecast, by Country 2020 & 2033
- Table 17: United States Mobility in Healthcare Industry Revenue (Million) Forecast, by Application 2020 & 2033
- Table 18: United States Mobility in Healthcare Industry Volume (K Unit) Forecast, by Application 2020 & 2033
- Table 19: Canada Mobility in Healthcare Industry Revenue (Million) Forecast, by Application 2020 & 2033
- Table 20: Canada Mobility in Healthcare Industry Volume (K Unit) Forecast, by Application 2020 & 2033
- Table 21: Mexico Mobility in Healthcare Industry Revenue (Million) Forecast, by Application 2020 & 2033
- Table 22: Mexico Mobility in Healthcare Industry Volume (K Unit) Forecast, by Application 2020 & 2033
- Table 23: Global Mobility in Healthcare Industry Revenue Million Forecast, by Products and Services 2020 & 2033
- Table 24: Global Mobility in Healthcare Industry Volume K Unit Forecast, by Products and Services 2020 & 2033
- Table 25: Global Mobility in Healthcare Industry Revenue Million Forecast, by Application 2020 & 2033
- Table 26: Global Mobility in Healthcare Industry Volume K Unit Forecast, by Application 2020 & 2033
- Table 27: Global Mobility in Healthcare Industry Revenue Million Forecast, by End User 2020 & 2033
- Table 28: Global Mobility in Healthcare Industry Volume K Unit Forecast, by End User 2020 & 2033
- Table 29: Global Mobility in Healthcare Industry Revenue Million Forecast, by Country 2020 & 2033
- Table 30: Global Mobility in Healthcare Industry Volume K Unit Forecast, by Country 2020 & 2033
- Table 31: Germany Mobility in Healthcare Industry Revenue (Million) Forecast, by Application 2020 & 2033
- Table 32: Germany Mobility in Healthcare Industry Volume (K Unit) Forecast, by Application 2020 & 2033
- Table 33: United Kingdom Mobility in Healthcare Industry Revenue (Million) Forecast, by Application 2020 & 2033
- Table 34: United Kingdom Mobility in Healthcare Industry Volume (K Unit) Forecast, by Application 2020 & 2033
- Table 35: France Mobility in Healthcare Industry Revenue (Million) Forecast, by Application 2020 & 2033
- Table 36: France Mobility in Healthcare Industry Volume (K Unit) Forecast, by Application 2020 & 2033
- Table 37: Italy Mobility in Healthcare Industry Revenue (Million) Forecast, by Application 2020 & 2033
- Table 38: Italy Mobility in Healthcare Industry Volume (K Unit) Forecast, by Application 2020 & 2033
- Table 39: Spain Mobility in Healthcare Industry Revenue (Million) Forecast, by Application 2020 & 2033
- Table 40: Spain Mobility in Healthcare Industry Volume (K Unit) Forecast, by Application 2020 & 2033
- Table 41: Rest of Europe Mobility in Healthcare Industry Revenue (Million) Forecast, by Application 2020 & 2033
- Table 42: Rest of Europe Mobility in Healthcare Industry Volume (K Unit) Forecast, by Application 2020 & 2033
- Table 43: Global Mobility in Healthcare Industry Revenue Million Forecast, by Products and Services 2020 & 2033
- Table 44: Global Mobility in Healthcare Industry Volume K Unit Forecast, by Products and Services 2020 & 2033
- Table 45: Global Mobility in Healthcare Industry Revenue Million Forecast, by Application 2020 & 2033
- Table 46: Global Mobility in Healthcare Industry Volume K Unit Forecast, by Application 2020 & 2033
- Table 47: Global Mobility in Healthcare Industry Revenue Million Forecast, by End User 2020 & 2033
- Table 48: Global Mobility in Healthcare Industry Volume K Unit Forecast, by End User 2020 & 2033
- Table 49: Global Mobility in Healthcare Industry Revenue Million Forecast, by Country 2020 & 2033
- Table 50: Global Mobility in Healthcare Industry Volume K Unit Forecast, by Country 2020 & 2033
- Table 51: China Mobility in Healthcare Industry Revenue (Million) Forecast, by Application 2020 & 2033
- Table 52: China Mobility in Healthcare Industry Volume (K Unit) Forecast, by Application 2020 & 2033
- Table 53: Japan Mobility in Healthcare Industry Revenue (Million) Forecast, by Application 2020 & 2033
- Table 54: Japan Mobility in Healthcare Industry Volume (K Unit) Forecast, by Application 2020 & 2033
- Table 55: India Mobility in Healthcare Industry Revenue (Million) Forecast, by Application 2020 & 2033
- Table 56: India Mobility in Healthcare Industry Volume (K Unit) Forecast, by Application 2020 & 2033
- Table 57: Australia Mobility in Healthcare Industry Revenue (Million) Forecast, by Application 2020 & 2033
- Table 58: Australia Mobility in Healthcare Industry Volume (K Unit) Forecast, by Application 2020 & 2033
- Table 59: South Korea Mobility in Healthcare Industry Revenue (Million) Forecast, by Application 2020 & 2033
- Table 60: South Korea Mobility in Healthcare Industry Volume (K Unit) Forecast, by Application 2020 & 2033
- Table 61: Rest of Asia Pacific Mobility in Healthcare Industry Revenue (Million) Forecast, by Application 2020 & 2033
- Table 62: Rest of Asia Pacific Mobility in Healthcare Industry Volume (K Unit) Forecast, by Application 2020 & 2033
- Table 63: Global Mobility in Healthcare Industry Revenue Million Forecast, by Products and Services 2020 & 2033
- Table 64: Global Mobility in Healthcare Industry Volume K Unit Forecast, by Products and Services 2020 & 2033
- Table 65: Global Mobility in Healthcare Industry Revenue Million Forecast, by Application 2020 & 2033
- Table 66: Global Mobility in Healthcare Industry Volume K Unit Forecast, by Application 2020 & 2033
- Table 67: Global Mobility in Healthcare Industry Revenue Million Forecast, by End User 2020 & 2033
- Table 68: Global Mobility in Healthcare Industry Volume K Unit Forecast, by End User 2020 & 2033
- Table 69: Global Mobility in Healthcare Industry Revenue Million Forecast, by Country 2020 & 2033
- Table 70: Global Mobility in Healthcare Industry Volume K Unit Forecast, by Country 2020 & 2033
- Table 71: Global Mobility in Healthcare Industry Revenue Million Forecast, by Products and Services 2020 & 2033
- Table 72: Global Mobility in Healthcare Industry Volume K Unit Forecast, by Products and Services 2020 & 2033
- Table 73: Global Mobility in Healthcare Industry Revenue Million Forecast, by Application 2020 & 2033
- Table 74: Global Mobility in Healthcare Industry Volume K Unit Forecast, by Application 2020 & 2033
- Table 75: Global Mobility in Healthcare Industry Revenue Million Forecast, by End User 2020 & 2033
- Table 76: Global Mobility in Healthcare Industry Volume K Unit Forecast, by End User 2020 & 2033
- Table 77: Global Mobility in Healthcare Industry Revenue Million Forecast, by Country 2020 & 2033
- Table 78: Global Mobility in Healthcare Industry Volume K Unit Forecast, by Country 2020 & 2033
- Table 79: South Africa Mobility in Healthcare Industry Revenue (Million) Forecast, by Application 2020 & 2033
- Table 80: South Africa Mobility in Healthcare Industry Volume (K Unit) Forecast, by Application 2020 & 2033
- Table 81: Rest of Middle East Mobility in Healthcare Industry Revenue (Million) Forecast, by Application 2020 & 2033
- Table 82: Rest of Middle East Mobility in Healthcare Industry Volume (K Unit) Forecast, by Application 2020 & 2033
- Table 83: Global Mobility in Healthcare Industry Revenue Million Forecast, by Products and Services 2020 & 2033
- Table 84: Global Mobility in Healthcare Industry Volume K Unit Forecast, by Products and Services 2020 & 2033
- Table 85: Global Mobility in Healthcare Industry Revenue Million Forecast, by Application 2020 & 2033
- Table 86: Global Mobility in Healthcare Industry Volume K Unit Forecast, by Application 2020 & 2033
- Table 87: Global Mobility in Healthcare Industry Revenue Million Forecast, by End User 2020 & 2033
- Table 88: Global Mobility in Healthcare Industry Volume K Unit Forecast, by End User 2020 & 2033
- Table 89: Global Mobility in Healthcare Industry Revenue Million Forecast, by Country 2020 & 2033
- Table 90: Global Mobility in Healthcare Industry Volume K Unit Forecast, by Country 2020 & 2033
- Table 91: Brazil Mobility in Healthcare Industry Revenue (Million) Forecast, by Application 2020 & 2033
- Table 92: Brazil Mobility in Healthcare Industry Volume (K Unit) Forecast, by Application 2020 & 2033
- Table 93: Argentina Mobility in Healthcare Industry Revenue (Million) Forecast, by Application 2020 & 2033
- Table 94: Argentina Mobility in Healthcare Industry Volume (K Unit) Forecast, by Application 2020 & 2033
- Table 95: Rest of South America Mobility in Healthcare Industry Revenue (Million) Forecast, by Application 2020 & 2033
- Table 96: Rest of South America Mobility in Healthcare Industry Volume (K Unit) Forecast, by Application 2020 & 2033
Frequently Asked Questions
1. What is the projected Compound Annual Growth Rate (CAGR) of the Mobility in Healthcare Industry?
The projected CAGR is approximately 21.32%.
2. Which companies are prominent players in the Mobility in Healthcare Industry?
Key companies in the market include Mckesson Corporation, Zebra Technologies Corporation, Koninklijke Philips N V, Cisco Systems Inc, Airstrip Technologies Inc, Omron Corporation, At&T Inc, SAP SE, Oracle Cerner.
3. What are the main segments of the Mobility in Healthcare Industry?
The market segments include Products and Services, Application, End User.
4. Can you provide details about the market size?
The market size is estimated to be USD 135.43 Million as of 2022.
5. What are some drivers contributing to market growth?
Increasing Utilization of the Smart Devices (Smartphones. Smart watches. etc.); Increased Influence of the Social Media on Healthcare; Rise in the Demand of Personalized Medicines.
6. What are the notable trends driving market growth?
Patient Care Management Segment is Expected to Witness a Healthy Growth Over the Forecast Period.
7. Are there any restraints impacting market growth?
Safety and Security Issues Associated with Patient Health Information; Lack of Skilled Professionals.
8. Can you provide examples of recent developments in the market?
In August 2022, Indonesia's Health Ministry launched the Indonesia Health Services platform in Jakarta as a part of the country's health technology transformation.
9. What pricing options are available for accessing the report?
Pricing options include single-user, multi-user, and enterprise licenses priced at USD 4750, USD 5250, and USD 8750 respectively.
10. Is the market size provided in terms of value or volume?
The market size is provided in terms of value, measured in Million and volume, measured in K Unit.
11. Are there any specific market keywords associated with the report?
Yes, the market keyword associated with the report is "Mobility in Healthcare Industry," which aids in identifying and referencing the specific market segment covered.
12. How do I determine which pricing option suits my needs best?
The pricing options vary based on user requirements and access needs. Individual users may opt for single-user licenses, while businesses requiring broader access may choose multi-user or enterprise licenses for cost-effective access to the report.
13. Are there any additional resources or data provided in the Mobility in Healthcare Industry report?
While the report offers comprehensive insights, it's advisable to review the specific contents or supplementary materials provided to ascertain if additional resources or data are available.
14. How can I stay updated on further developments or reports in the Mobility in Healthcare Industry?
To stay informed about further developments, trends, and reports in the Mobility in Healthcare Industry, consider subscribing to industry newsletters, following relevant companies and organizations, or regularly checking reputable industry news sources and publications.
Methodology
Step 1 - Identification of Relevant Samples Size from Population Database


Step 2 - Approaches for Defining Global Market Size (Value, Volume* & Price*)

Note*: In applicable scenarios
Step 3 - Data Sources
Primary Research
- Web Analytics
- Survey Reports
- Research Institute
- Latest Research Reports
- Opinion Leaders
Secondary Research
- Annual Reports
- White Paper
- Latest Press Release
- Industry Association
- Paid Database
- Investor Presentations

Step 4 - Data Triangulation
Involves using different sources of information in order to increase the validity of a study
These sources are likely to be stakeholders in a program - participants, other researchers, program staff, other community members, and so on.
Then we put all data in single framework & apply various statistical tools to find out the dynamic on the market.
During the analysis stage, feedback from the stakeholder groups would be compared to determine areas of agreement as well as areas of divergence