

Key Insights
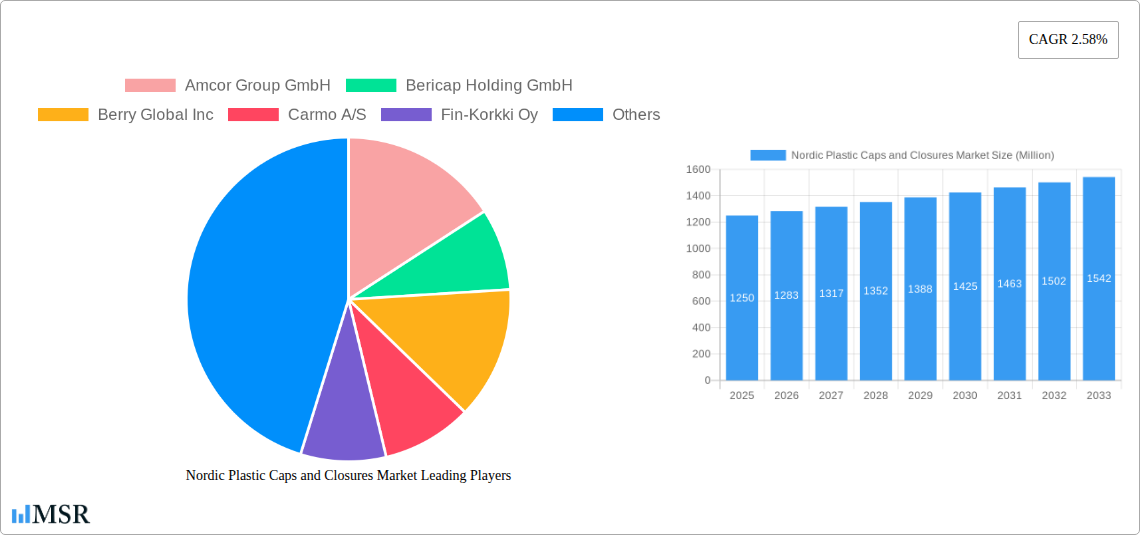
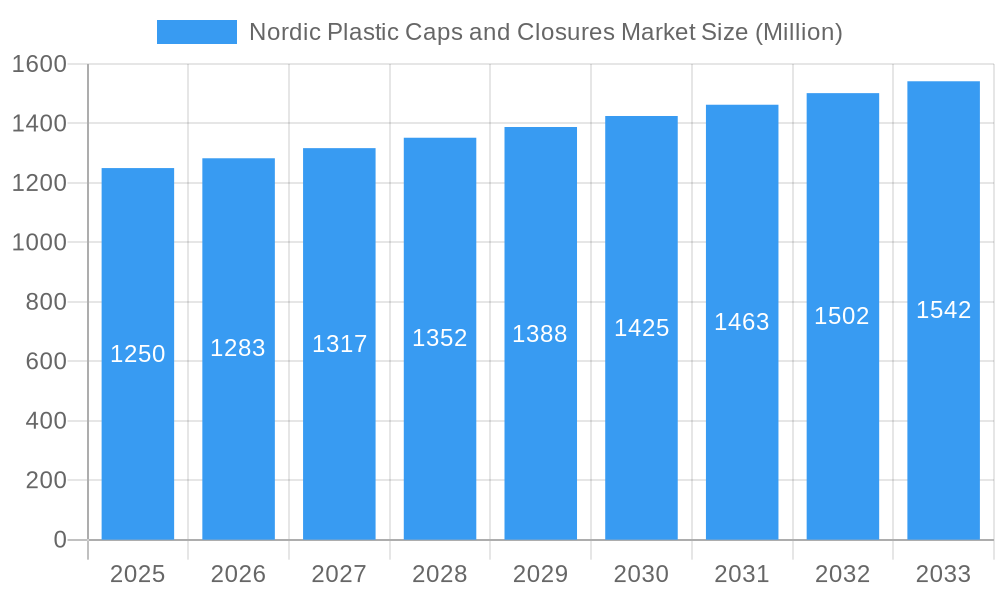
The Nordic plastic caps and closures market, valued at $1.25 billion in 2025, is projected to experience steady growth, driven by the increasing demand for packaged goods across food and beverage, pharmaceuticals, and personal care sectors in the region. The market's Compound Annual Growth Rate (CAGR) of 2.58% from 2025 to 2033 reflects a consistent, albeit moderate, expansion. This growth is fueled by several key factors: the rising popularity of convenience foods and beverages necessitating efficient and tamper-evident closures; the expanding e-commerce sector requiring robust and secure packaging; and the ongoing advancements in materials science leading to lighter, more sustainable, and functional plastic caps and closures. However, growing environmental concerns regarding plastic waste and increasing regulatory pressures for sustainable packaging present significant challenges. To mitigate these challenges, market players are increasingly focusing on developing biodegradable and recyclable alternatives, alongside adopting circular economy principles within their supply chains. This shift towards sustainability is expected to drive innovation and influence future market growth, with companies investing in advanced recycling technologies and eco-friendly material formulations.
Nordic Plastic Caps and Closures Market Market Size (In Billion)
The competitive landscape is characterized by a mix of established multinational corporations and smaller regional players. Established players possess significant manufacturing capabilities and brand recognition, while emerging companies are focusing on niche applications and innovative packaging solutions. This dynamic competitive environment fosters both consolidation and diversification within the market, leading to a broad range of products and services catering to the diverse needs of the Nordic region. Segment-specific growth rates may vary, influenced by factors such as product type, material composition, and end-use applications. For example, the demand for tamper-evident closures is anticipated to show robust growth, reflecting consumer concerns about product safety and authenticity. Future market evolution will depend on several factors including government policies related to plastic waste management, consumer preferences for eco-friendly packaging, and the pace of technological innovation in the field of packaging materials.
Nordic Plastic Caps and Closures Market Company Market Share
Nordic Plastic Caps and Closures Market Report: 2019-2033
This comprehensive report provides an in-depth analysis of the Nordic plastic caps and closures market, offering invaluable insights for industry stakeholders. Covering the period 2019-2033, with a base year of 2025 and a forecast period of 2025-2033, this report delves into market dynamics, key players, emerging trends, and future growth potential. With detailed analysis of market size, CAGR, and competitive landscape, this report is essential for strategic decision-making.
Nordic Plastic Caps and Closures Market Market Concentration & Dynamics
The Nordic plastic caps and closures market exhibits a moderately concentrated landscape, with a few major players holding significant market share. Amcor Group GmbH, Bericap Holding GmbH, Berry Global Inc., Carmo A/S, Fin-Korkki Oy, Modulpac AB, Tetra Pak International SV, and Robinson PLC are key players driving market dynamics. The market is characterized by a dynamic innovation ecosystem, with ongoing developments in sustainable materials and closure designs. Stringent regulatory frameworks focusing on recyclability and environmental impact are shaping market strategies. Substitute products, such as metal and alternative materials, pose a challenge, but demand for lightweight and functional plastic closures remains strong. End-user trends, particularly in the food and beverage, personal care, and pharmaceutical sectors, significantly influence market growth. M&A activity in the sector has been moderate in recent years, with approximately xx deals recorded between 2019 and 2024, contributing to market consolidation and reshaping the competitive landscape. The average market share of the top 5 players is estimated to be xx%.
- Market Concentration: Moderately concentrated
- Innovation Ecosystem: Active, with focus on sustainability
- Regulatory Framework: Stringent, emphasizing recyclability
- Substitute Products: Metal, alternative materials
- End-User Trends: Food & beverage, personal care, pharmaceuticals
- M&A Activity: Moderate, approx. xx deals (2019-2024)
Nordic Plastic Caps and Closures Market Industry Insights & Trends
The Nordic plastic caps and closures market experienced a value of xx Million in 2024, exhibiting a CAGR of xx% during the historical period (2019-2024). Market growth is primarily driven by increasing demand from various end-use sectors, particularly the food and beverage industry. Technological disruptions, such as the adoption of lightweighting techniques and innovative closure designs, are also significantly impacting the market. Evolving consumer preferences towards eco-friendly and convenient packaging solutions necessitate continuous innovation. The market is further influenced by factors like fluctuating raw material prices and economic growth in the Nordic region. Increased focus on sustainability is leading to the adoption of bio-based and recycled plastics, prompting the development of recyclable and compostable closures. The forecast period (2025-2033) anticipates continued growth, with an estimated market value reaching xx Million by 2033, driven by the factors mentioned above.
Key Markets & Segments Leading Nordic Plastic Caps and Closures Market
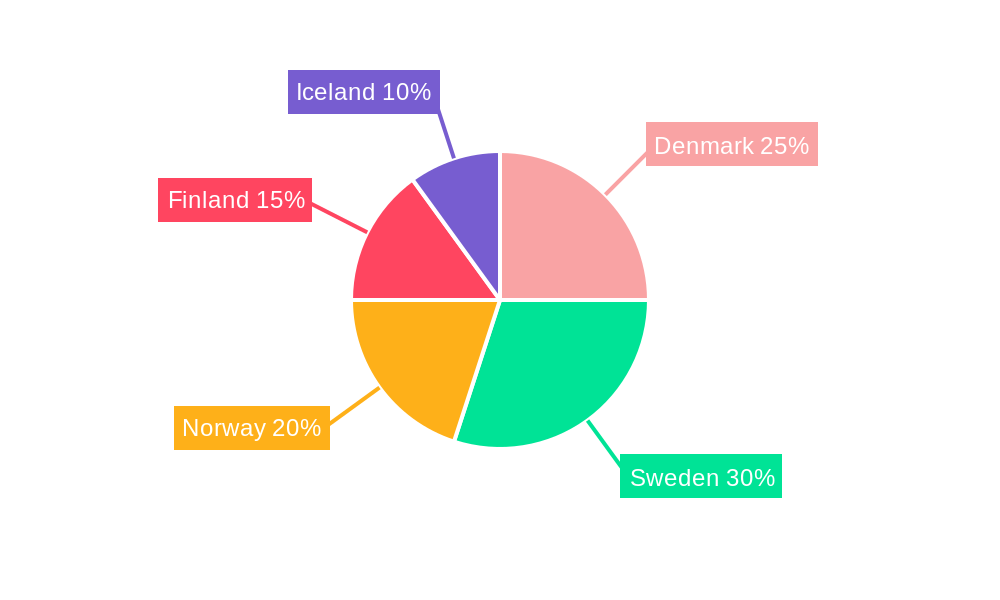
The largest segment within the Nordic plastic caps and closures market is the food and beverage sector, driven by strong demand for convenient and tamper-evident packaging solutions. The Scandinavian countries (Denmark, Sweden, Norway, Finland, Iceland) display the highest market share in the Nordic region.
Drivers for the Food and Beverage segment dominance:
- High per capita consumption of packaged foods and beverages.
- Robust food processing and manufacturing industries.
- Strong emphasis on food safety and hygiene.
Dominance Analysis: The food and beverage segment accounts for approximately xx% of the total market value, with Denmark and Sweden being leading contributors due to their advanced packaging industries and high consumption levels. The robust economic performance and well-developed infrastructure in these countries contribute to the market’s strength. Further analysis reveals that the demand for closures made from recyclable materials (e.g., rPET, rPP) is driving significant growth within the food and beverage industry.
Nordic Plastic Caps and Closures Market Product Developments
Recent product innovations have focused on enhancing sustainability, convenience, and functionality. Lightweight closures, designed to minimize material usage and reduce environmental impact, are gaining traction. Improved tamper-evident features enhance product security, while innovative designs cater to specific application needs, such as child-resistant closures for pharmaceuticals or easy-open solutions for food products. These advancements improve the overall consumer experience and create a competitive advantage for manufacturers.
Challenges in the Nordic Plastic Caps and Closures Market Market
The Nordic plastic caps and closures market faces challenges related to stringent environmental regulations, leading to increased costs associated with complying with recyclability standards. Fluctuations in raw material prices, particularly for polymers, create cost uncertainties and impact profitability. Intense competition among established and emerging players necessitates continuous innovation and cost optimization to maintain market share. Supply chain disruptions can also impact production and delivery timelines. These factors collectively impact overall market growth and necessitate strategic adaptation by market players.
Forces Driving Nordic Plastic Caps and Closures Market Growth
Technological advancements in material science, resulting in lightweight and sustainable closure designs, contribute significantly to market growth. Increasing demand from the food and beverage, personal care, and pharmaceutical sectors drives sustained market expansion. Government initiatives promoting sustainable packaging, along with consumer preferences towards eco-friendly products, create a positive market outlook.
Long-Term Growth Catalysts in the Nordic Plastic Caps and Closures Market
Long-term growth in the Nordic plastic caps and closures market will be driven by the continuous development of innovative and sustainable closure solutions. Strategic partnerships between manufacturers and material suppliers to facilitate the adoption of recycled and bio-based materials are key. Expansion into new markets and applications, alongside advancements in automation and production efficiency, will contribute to sustained market growth in the long term.
Emerging Opportunities in Nordic Plastic Caps and Closures Market
Emerging opportunities exist in the development of closures incorporating smart packaging technologies, enabling enhanced product traceability and consumer engagement. The increasing demand for customized and personalized packaging solutions creates an avenue for specialized closure designs. Exploration of innovative materials such as biodegradable plastics, presents significant growth potential.
Leading Players in the Nordic Plastic Caps and Closures Market Sector
- Amcor Group GmbH
- Bericap Holding GmbH
- Berry Global Inc.
- Carmo A/S
- Fin-Korkki Oy
- Modulpac AB
- Tetra Pak International SV
- Robinson PLC
Key Milestones in Nordic Plastic Caps and Closures Market Industry
- October 2023: Berry Global Inc. launched the Slimline range of lightweight tube closures made from PE and PP, targeting personal care and pharmaceutical applications.
- February 2024: Robinson PLC exhibited its products at Packaging Innovations and Empack in Birmingham, UK, showcasing its presence in the Danish market.
Strategic Outlook for Nordic Plastic Caps and Closures Market Market
The Nordic plastic caps and closures market presents significant growth potential, driven by consumer preference shifts and technological advancements. Companies focusing on sustainable solutions, innovative designs, and efficient supply chains are well-positioned for future success. Strategic collaborations and investments in research and development will be crucial for capitalizing on emerging opportunities and navigating market challenges effectively.
Nordic Plastic Caps and Closures Market Segmentation
-
1. Resin
- 1.1. Polyethylene (PE)
- 1.2. Polyethylene Terephthalate (PET)
- 1.3. Polypropylene (PP)
- 1.4. Other Pl
-
2. Product Type
- 2.1. Threaded - Screw Caps, Vacuum, etc.
- 2.2. Dispensing
- 2.3. Unthread
- 2.4. Child-resistant
-
3. End-user Industries
- 3.1. Food
-
3.2. Beverage
- 3.2.1. Bottled Water
- 3.2.2. Carbonated Soft Drinks
- 3.2.3. Alcoholic Beverages
- 3.2.4. Juices and Energy Drinks
- 3.2.5. Other Beverages
- 3.3. Personal Care and Cosmetics
- 3.4. Household Chemicals
- 3.5. Other End-user Industries
Nordic Plastic Caps and Closures Market Segmentation By Geography
-
1. North America
- 1.1. United States
- 1.2. Canada
- 1.3. Mexico
-
2. South America
- 2.1. Brazil
- 2.2. Argentina
- 2.3. Rest of South America
-
3. Europe
- 3.1. United Kingdom
- 3.2. Germany
- 3.3. France
- 3.4. Italy
- 3.5. Spain
- 3.6. Russia
- 3.7. Benelux
- 3.8. Nordics
- 3.9. Rest of Europe
-
4. Middle East & Africa
- 4.1. Turkey
- 4.2. Israel
- 4.3. GCC
- 4.4. North Africa
- 4.5. South Africa
- 4.6. Rest of Middle East & Africa
-
5. Asia Pacific
- 5.1. China
- 5.2. India
- 5.3. Japan
- 5.4. South Korea
- 5.5. ASEAN
- 5.6. Oceania
- 5.7. Rest of Asia Pacific
Nordic Plastic Caps and Closures Market Regional Market Share
Geographic Coverage of Nordic Plastic Caps and Closures Market
Nordic Plastic Caps and Closures Market REPORT HIGHLIGHTS
| Aspects | Details |
|---|---|
| Study Period | 2020-2034 |
| Base Year | 2025 |
| Estimated Year | 2026 |
| Forecast Period | 2026-2034 |
| Historical Period | 2020-2025 |
| Growth Rate | CAGR of 2.58% from 2020-2034 |
| Segmentation |
|
Table of Contents
- 1. Introduction
- 1.1. Research Scope
- 1.2. Market Segmentation
- 1.3. Research Objective
- 1.4. Definitions and Assumptions
- 2. Executive Summary
- 2.1. Market Snapshot
- 3. Market Dynamics
- 3.1. Market Drivers
- 3.2. Market Restrains
- 3.3. Market Trends
- 3.4. Market Opportunities
- 4. Market Factor Analysis
- 4.1. Porters Five Forces
- 4.1.1. Bargaining Power of Suppliers
- 4.1.2. Bargaining Power of Buyers
- 4.1.3. Threat of New Entrants
- 4.1.4. Threat of Substitutes
- 4.1.5. Competitive Rivalry
- 4.2. PESTEL analysis
- 4.3. BCG Analysis
- 4.3.1. Stars (High Growth, High Market Share)
- 4.3.2. Cash Cows (Low Growth, High Market Share)
- 4.3.3. Question Mark (High Growth, Low Market Share)
- 4.3.4. Dogs (Low Growth, Low Market Share)
- 4.4. Ansoff Matrix Analysis
- 4.5. Supply Chain Analysis
- 4.6. Regulatory Landscape
- 4.7. Current Market Potential and Opportunity Assessment (TAM–SAM–SOM Framework)
- 4.8. MSR Analyst Note
- 4.1. Porters Five Forces
- 5. Market Analysis, Insights and Forecast 2021-2033
- 5.1. Market Analysis, Insights and Forecast - by Resin
- 5.1.1. Polyethylene (PE)
- 5.1.2. Polyethylene Terephthalate (PET)
- 5.1.3. Polypropylene (PP)
- 5.1.4. Other Pl
- 5.2. Market Analysis, Insights and Forecast - by Product Type
- 5.2.1. Threaded - Screw Caps, Vacuum, etc.
- 5.2.2. Dispensing
- 5.2.3. Unthread
- 5.2.4. Child-resistant
- 5.3. Market Analysis, Insights and Forecast - by End-user Industries
- 5.3.1. Food
- 5.3.2. Beverage
- 5.3.2.1. Bottled Water
- 5.3.2.2. Carbonated Soft Drinks
- 5.3.2.3. Alcoholic Beverages
- 5.3.2.4. Juices and Energy Drinks
- 5.3.2.5. Other Beverages
- 5.3.3. Personal Care and Cosmetics
- 5.3.4. Household Chemicals
- 5.3.5. Other End-user Industries
- 5.4. Market Analysis, Insights and Forecast - by Region
- 5.4.1. North America
- 5.4.2. South America
- 5.4.3. Europe
- 5.4.4. Middle East & Africa
- 5.4.5. Asia Pacific
- 5.1. Market Analysis, Insights and Forecast - by Resin
- 6. Global Nordic Plastic Caps and Closures Market Analysis, Insights and Forecast, 2021-2033
- 6.1. Market Analysis, Insights and Forecast - by Resin
- 6.1.1. Polyethylene (PE)
- 6.1.2. Polyethylene Terephthalate (PET)
- 6.1.3. Polypropylene (PP)
- 6.1.4. Other Pl
- 6.2. Market Analysis, Insights and Forecast - by Product Type
- 6.2.1. Threaded - Screw Caps, Vacuum, etc.
- 6.2.2. Dispensing
- 6.2.3. Unthread
- 6.2.4. Child-resistant
- 6.3. Market Analysis, Insights and Forecast - by End-user Industries
- 6.3.1. Food
- 6.3.2. Beverage
- 6.3.2.1. Bottled Water
- 6.3.2.2. Carbonated Soft Drinks
- 6.3.2.3. Alcoholic Beverages
- 6.3.2.4. Juices and Energy Drinks
- 6.3.2.5. Other Beverages
- 6.3.3. Personal Care and Cosmetics
- 6.3.4. Household Chemicals
- 6.3.5. Other End-user Industries
- 6.1. Market Analysis, Insights and Forecast - by Resin
- 7. North America Nordic Plastic Caps and Closures Market Analysis, Insights and Forecast, 2020-2032
- 7.1. Market Analysis, Insights and Forecast - by Resin
- 7.1.1. Polyethylene (PE)
- 7.1.2. Polyethylene Terephthalate (PET)
- 7.1.3. Polypropylene (PP)
- 7.1.4. Other Pl
- 7.2. Market Analysis, Insights and Forecast - by Product Type
- 7.2.1. Threaded - Screw Caps, Vacuum, etc.
- 7.2.2. Dispensing
- 7.2.3. Unthread
- 7.2.4. Child-resistant
- 7.3. Market Analysis, Insights and Forecast - by End-user Industries
- 7.3.1. Food
- 7.3.2. Beverage
- 7.3.2.1. Bottled Water
- 7.3.2.2. Carbonated Soft Drinks
- 7.3.2.3. Alcoholic Beverages
- 7.3.2.4. Juices and Energy Drinks
- 7.3.2.5. Other Beverages
- 7.3.3. Personal Care and Cosmetics
- 7.3.4. Household Chemicals
- 7.3.5. Other End-user Industries
- 7.1. Market Analysis, Insights and Forecast - by Resin
- 8. South America Nordic Plastic Caps and Closures Market Analysis, Insights and Forecast, 2020-2032
- 8.1. Market Analysis, Insights and Forecast - by Resin
- 8.1.1. Polyethylene (PE)
- 8.1.2. Polyethylene Terephthalate (PET)
- 8.1.3. Polypropylene (PP)
- 8.1.4. Other Pl
- 8.2. Market Analysis, Insights and Forecast - by Product Type
- 8.2.1. Threaded - Screw Caps, Vacuum, etc.
- 8.2.2. Dispensing
- 8.2.3. Unthread
- 8.2.4. Child-resistant
- 8.3. Market Analysis, Insights and Forecast - by End-user Industries
- 8.3.1. Food
- 8.3.2. Beverage
- 8.3.2.1. Bottled Water
- 8.3.2.2. Carbonated Soft Drinks
- 8.3.2.3. Alcoholic Beverages
- 8.3.2.4. Juices and Energy Drinks
- 8.3.2.5. Other Beverages
- 8.3.3. Personal Care and Cosmetics
- 8.3.4. Household Chemicals
- 8.3.5. Other End-user Industries
- 8.1. Market Analysis, Insights and Forecast - by Resin
- 9. Europe Nordic Plastic Caps and Closures Market Analysis, Insights and Forecast, 2020-2032
- 9.1. Market Analysis, Insights and Forecast - by Resin
- 9.1.1. Polyethylene (PE)
- 9.1.2. Polyethylene Terephthalate (PET)
- 9.1.3. Polypropylene (PP)
- 9.1.4. Other Pl
- 9.2. Market Analysis, Insights and Forecast - by Product Type
- 9.2.1. Threaded - Screw Caps, Vacuum, etc.
- 9.2.2. Dispensing
- 9.2.3. Unthread
- 9.2.4. Child-resistant
- 9.3. Market Analysis, Insights and Forecast - by End-user Industries
- 9.3.1. Food
- 9.3.2. Beverage
- 9.3.2.1. Bottled Water
- 9.3.2.2. Carbonated Soft Drinks
- 9.3.2.3. Alcoholic Beverages
- 9.3.2.4. Juices and Energy Drinks
- 9.3.2.5. Other Beverages
- 9.3.3. Personal Care and Cosmetics
- 9.3.4. Household Chemicals
- 9.3.5. Other End-user Industries
- 9.1. Market Analysis, Insights and Forecast - by Resin
- 10. Middle East & Africa Nordic Plastic Caps and Closures Market Analysis, Insights and Forecast, 2020-2032
- 10.1. Market Analysis, Insights and Forecast - by Resin
- 10.1.1. Polyethylene (PE)
- 10.1.2. Polyethylene Terephthalate (PET)
- 10.1.3. Polypropylene (PP)
- 10.1.4. Other Pl
- 10.2. Market Analysis, Insights and Forecast - by Product Type
- 10.2.1. Threaded - Screw Caps, Vacuum, etc.
- 10.2.2. Dispensing
- 10.2.3. Unthread
- 10.2.4. Child-resistant
- 10.3. Market Analysis, Insights and Forecast - by End-user Industries
- 10.3.1. Food
- 10.3.2. Beverage
- 10.3.2.1. Bottled Water
- 10.3.2.2. Carbonated Soft Drinks
- 10.3.2.3. Alcoholic Beverages
- 10.3.2.4. Juices and Energy Drinks
- 10.3.2.5. Other Beverages
- 10.3.3. Personal Care and Cosmetics
- 10.3.4. Household Chemicals
- 10.3.5. Other End-user Industries
- 10.1. Market Analysis, Insights and Forecast - by Resin
- 11. Asia Pacific Nordic Plastic Caps and Closures Market Analysis, Insights and Forecast, 2020-2032
- 11.1. Market Analysis, Insights and Forecast - by Resin
- 11.1.1. Polyethylene (PE)
- 11.1.2. Polyethylene Terephthalate (PET)
- 11.1.3. Polypropylene (PP)
- 11.1.4. Other Pl
- 11.2. Market Analysis, Insights and Forecast - by Product Type
- 11.2.1. Threaded - Screw Caps, Vacuum, etc.
- 11.2.2. Dispensing
- 11.2.3. Unthread
- 11.2.4. Child-resistant
- 11.3. Market Analysis, Insights and Forecast - by End-user Industries
- 11.3.1. Food
- 11.3.2. Beverage
- 11.3.2.1. Bottled Water
- 11.3.2.2. Carbonated Soft Drinks
- 11.3.2.3. Alcoholic Beverages
- 11.3.2.4. Juices and Energy Drinks
- 11.3.2.5. Other Beverages
- 11.3.3. Personal Care and Cosmetics
- 11.3.4. Household Chemicals
- 11.3.5. Other End-user Industries
- 11.1. Market Analysis, Insights and Forecast - by Resin
- 12. Competitive Analysis
- 12.1. Company Profiles
- 12.1.1 Amcor Group GmbH
- 12.1.1.1. Company Overview
- 12.1.1.2. Products
- 12.1.1.3. Company Financials
- 12.1.1.4. SWOT Analysis
- 12.1.2 Bericap Holding GmbH
- 12.1.2.1. Company Overview
- 12.1.2.2. Products
- 12.1.2.3. Company Financials
- 12.1.2.4. SWOT Analysis
- 12.1.3 Berry Global Inc
- 12.1.3.1. Company Overview
- 12.1.3.2. Products
- 12.1.3.3. Company Financials
- 12.1.3.4. SWOT Analysis
- 12.1.4 Carmo A/S
- 12.1.4.1. Company Overview
- 12.1.4.2. Products
- 12.1.4.3. Company Financials
- 12.1.4.4. SWOT Analysis
- 12.1.5 Fin-Korkki Oy
- 12.1.5.1. Company Overview
- 12.1.5.2. Products
- 12.1.5.3. Company Financials
- 12.1.5.4. SWOT Analysis
- 12.1.6 Modulpac AB
- 12.1.6.1. Company Overview
- 12.1.6.2. Products
- 12.1.6.3. Company Financials
- 12.1.6.4. SWOT Analysis
- 12.1.7 Tetra Pak International SV
- 12.1.7.1. Company Overview
- 12.1.7.2. Products
- 12.1.7.3. Company Financials
- 12.1.7.4. SWOT Analysis
- 12.1.8 Robinson PLC8 2 Heat Map Analysis8 3 Competitor Analysis - Emerging vs Established Player
- 12.1.8.1. Company Overview
- 12.1.8.2. Products
- 12.1.8.3. Company Financials
- 12.1.8.4. SWOT Analysis
- 12.1.1 Amcor Group GmbH
- 12.2. Market Entropy
- 12.2.1 Company's Key Areas Served
- 12.2.2 Recent Developments
- 12.3. Company Market Share Analysis 2025
- 12.3.1 Top 5 Companies Market Share Analysis
- 12.3.2 Top 3 Companies Market Share Analysis
- 12.4. List of Potential Customers
- 13. Research Methodology
List of Figures
- Figure 1: Global Nordic Plastic Caps and Closures Market Revenue Breakdown (Million, %) by Region 2025 & 2033
- Figure 2: Global Nordic Plastic Caps and Closures Market Volume Breakdown (Billion, %) by Region 2025 & 2033
- Figure 3: North America Nordic Plastic Caps and Closures Market Revenue (Million), by Resin 2025 & 2033
- Figure 4: North America Nordic Plastic Caps and Closures Market Volume (Billion), by Resin 2025 & 2033
- Figure 5: North America Nordic Plastic Caps and Closures Market Revenue Share (%), by Resin 2025 & 2033
- Figure 6: North America Nordic Plastic Caps and Closures Market Volume Share (%), by Resin 2025 & 2033
- Figure 7: North America Nordic Plastic Caps and Closures Market Revenue (Million), by Product Type 2025 & 2033
- Figure 8: North America Nordic Plastic Caps and Closures Market Volume (Billion), by Product Type 2025 & 2033
- Figure 9: North America Nordic Plastic Caps and Closures Market Revenue Share (%), by Product Type 2025 & 2033
- Figure 10: North America Nordic Plastic Caps and Closures Market Volume Share (%), by Product Type 2025 & 2033
- Figure 11: North America Nordic Plastic Caps and Closures Market Revenue (Million), by End-user Industries 2025 & 2033
- Figure 12: North America Nordic Plastic Caps and Closures Market Volume (Billion), by End-user Industries 2025 & 2033
- Figure 13: North America Nordic Plastic Caps and Closures Market Revenue Share (%), by End-user Industries 2025 & 2033
- Figure 14: North America Nordic Plastic Caps and Closures Market Volume Share (%), by End-user Industries 2025 & 2033
- Figure 15: North America Nordic Plastic Caps and Closures Market Revenue (Million), by Country 2025 & 2033
- Figure 16: North America Nordic Plastic Caps and Closures Market Volume (Billion), by Country 2025 & 2033
- Figure 17: North America Nordic Plastic Caps and Closures Market Revenue Share (%), by Country 2025 & 2033
- Figure 18: North America Nordic Plastic Caps and Closures Market Volume Share (%), by Country 2025 & 2033
- Figure 19: South America Nordic Plastic Caps and Closures Market Revenue (Million), by Resin 2025 & 2033
- Figure 20: South America Nordic Plastic Caps and Closures Market Volume (Billion), by Resin 2025 & 2033
- Figure 21: South America Nordic Plastic Caps and Closures Market Revenue Share (%), by Resin 2025 & 2033
- Figure 22: South America Nordic Plastic Caps and Closures Market Volume Share (%), by Resin 2025 & 2033
- Figure 23: South America Nordic Plastic Caps and Closures Market Revenue (Million), by Product Type 2025 & 2033
- Figure 24: South America Nordic Plastic Caps and Closures Market Volume (Billion), by Product Type 2025 & 2033
- Figure 25: South America Nordic Plastic Caps and Closures Market Revenue Share (%), by Product Type 2025 & 2033
- Figure 26: South America Nordic Plastic Caps and Closures Market Volume Share (%), by Product Type 2025 & 2033
- Figure 27: South America Nordic Plastic Caps and Closures Market Revenue (Million), by End-user Industries 2025 & 2033
- Figure 28: South America Nordic Plastic Caps and Closures Market Volume (Billion), by End-user Industries 2025 & 2033
- Figure 29: South America Nordic Plastic Caps and Closures Market Revenue Share (%), by End-user Industries 2025 & 2033
- Figure 30: South America Nordic Plastic Caps and Closures Market Volume Share (%), by End-user Industries 2025 & 2033
- Figure 31: South America Nordic Plastic Caps and Closures Market Revenue (Million), by Country 2025 & 2033
- Figure 32: South America Nordic Plastic Caps and Closures Market Volume (Billion), by Country 2025 & 2033
- Figure 33: South America Nordic Plastic Caps and Closures Market Revenue Share (%), by Country 2025 & 2033
- Figure 34: South America Nordic Plastic Caps and Closures Market Volume Share (%), by Country 2025 & 2033
- Figure 35: Europe Nordic Plastic Caps and Closures Market Revenue (Million), by Resin 2025 & 2033
- Figure 36: Europe Nordic Plastic Caps and Closures Market Volume (Billion), by Resin 2025 & 2033
- Figure 37: Europe Nordic Plastic Caps and Closures Market Revenue Share (%), by Resin 2025 & 2033
- Figure 38: Europe Nordic Plastic Caps and Closures Market Volume Share (%), by Resin 2025 & 2033
- Figure 39: Europe Nordic Plastic Caps and Closures Market Revenue (Million), by Product Type 2025 & 2033
- Figure 40: Europe Nordic Plastic Caps and Closures Market Volume (Billion), by Product Type 2025 & 2033
- Figure 41: Europe Nordic Plastic Caps and Closures Market Revenue Share (%), by Product Type 2025 & 2033
- Figure 42: Europe Nordic Plastic Caps and Closures Market Volume Share (%), by Product Type 2025 & 2033
- Figure 43: Europe Nordic Plastic Caps and Closures Market Revenue (Million), by End-user Industries 2025 & 2033
- Figure 44: Europe Nordic Plastic Caps and Closures Market Volume (Billion), by End-user Industries 2025 & 2033
- Figure 45: Europe Nordic Plastic Caps and Closures Market Revenue Share (%), by End-user Industries 2025 & 2033
- Figure 46: Europe Nordic Plastic Caps and Closures Market Volume Share (%), by End-user Industries 2025 & 2033
- Figure 47: Europe Nordic Plastic Caps and Closures Market Revenue (Million), by Country 2025 & 2033
- Figure 48: Europe Nordic Plastic Caps and Closures Market Volume (Billion), by Country 2025 & 2033
- Figure 49: Europe Nordic Plastic Caps and Closures Market Revenue Share (%), by Country 2025 & 2033
- Figure 50: Europe Nordic Plastic Caps and Closures Market Volume Share (%), by Country 2025 & 2033
- Figure 51: Middle East & Africa Nordic Plastic Caps and Closures Market Revenue (Million), by Resin 2025 & 2033
- Figure 52: Middle East & Africa Nordic Plastic Caps and Closures Market Volume (Billion), by Resin 2025 & 2033
- Figure 53: Middle East & Africa Nordic Plastic Caps and Closures Market Revenue Share (%), by Resin 2025 & 2033
- Figure 54: Middle East & Africa Nordic Plastic Caps and Closures Market Volume Share (%), by Resin 2025 & 2033
- Figure 55: Middle East & Africa Nordic Plastic Caps and Closures Market Revenue (Million), by Product Type 2025 & 2033
- Figure 56: Middle East & Africa Nordic Plastic Caps and Closures Market Volume (Billion), by Product Type 2025 & 2033
- Figure 57: Middle East & Africa Nordic Plastic Caps and Closures Market Revenue Share (%), by Product Type 2025 & 2033
- Figure 58: Middle East & Africa Nordic Plastic Caps and Closures Market Volume Share (%), by Product Type 2025 & 2033
- Figure 59: Middle East & Africa Nordic Plastic Caps and Closures Market Revenue (Million), by End-user Industries 2025 & 2033
- Figure 60: Middle East & Africa Nordic Plastic Caps and Closures Market Volume (Billion), by End-user Industries 2025 & 2033
- Figure 61: Middle East & Africa Nordic Plastic Caps and Closures Market Revenue Share (%), by End-user Industries 2025 & 2033
- Figure 62: Middle East & Africa Nordic Plastic Caps and Closures Market Volume Share (%), by End-user Industries 2025 & 2033
- Figure 63: Middle East & Africa Nordic Plastic Caps and Closures Market Revenue (Million), by Country 2025 & 2033
- Figure 64: Middle East & Africa Nordic Plastic Caps and Closures Market Volume (Billion), by Country 2025 & 2033
- Figure 65: Middle East & Africa Nordic Plastic Caps and Closures Market Revenue Share (%), by Country 2025 & 2033
- Figure 66: Middle East & Africa Nordic Plastic Caps and Closures Market Volume Share (%), by Country 2025 & 2033
- Figure 67: Asia Pacific Nordic Plastic Caps and Closures Market Revenue (Million), by Resin 2025 & 2033
- Figure 68: Asia Pacific Nordic Plastic Caps and Closures Market Volume (Billion), by Resin 2025 & 2033
- Figure 69: Asia Pacific Nordic Plastic Caps and Closures Market Revenue Share (%), by Resin 2025 & 2033
- Figure 70: Asia Pacific Nordic Plastic Caps and Closures Market Volume Share (%), by Resin 2025 & 2033
- Figure 71: Asia Pacific Nordic Plastic Caps and Closures Market Revenue (Million), by Product Type 2025 & 2033
- Figure 72: Asia Pacific Nordic Plastic Caps and Closures Market Volume (Billion), by Product Type 2025 & 2033
- Figure 73: Asia Pacific Nordic Plastic Caps and Closures Market Revenue Share (%), by Product Type 2025 & 2033
- Figure 74: Asia Pacific Nordic Plastic Caps and Closures Market Volume Share (%), by Product Type 2025 & 2033
- Figure 75: Asia Pacific Nordic Plastic Caps and Closures Market Revenue (Million), by End-user Industries 2025 & 2033
- Figure 76: Asia Pacific Nordic Plastic Caps and Closures Market Volume (Billion), by End-user Industries 2025 & 2033
- Figure 77: Asia Pacific Nordic Plastic Caps and Closures Market Revenue Share (%), by End-user Industries 2025 & 2033
- Figure 78: Asia Pacific Nordic Plastic Caps and Closures Market Volume Share (%), by End-user Industries 2025 & 2033
- Figure 79: Asia Pacific Nordic Plastic Caps and Closures Market Revenue (Million), by Country 2025 & 2033
- Figure 80: Asia Pacific Nordic Plastic Caps and Closures Market Volume (Billion), by Country 2025 & 2033
- Figure 81: Asia Pacific Nordic Plastic Caps and Closures Market Revenue Share (%), by Country 2025 & 2033
- Figure 82: Asia Pacific Nordic Plastic Caps and Closures Market Volume Share (%), by Country 2025 & 2033
List of Tables
- Table 1: Global Nordic Plastic Caps and Closures Market Revenue Million Forecast, by Resin 2020 & 2033
- Table 2: Global Nordic Plastic Caps and Closures Market Volume Billion Forecast, by Resin 2020 & 2033
- Table 3: Global Nordic Plastic Caps and Closures Market Revenue Million Forecast, by Product Type 2020 & 2033
- Table 4: Global Nordic Plastic Caps and Closures Market Volume Billion Forecast, by Product Type 2020 & 2033
- Table 5: Global Nordic Plastic Caps and Closures Market Revenue Million Forecast, by End-user Industries 2020 & 2033
- Table 6: Global Nordic Plastic Caps and Closures Market Volume Billion Forecast, by End-user Industries 2020 & 2033
- Table 7: Global Nordic Plastic Caps and Closures Market Revenue Million Forecast, by Region 2020 & 2033
- Table 8: Global Nordic Plastic Caps and Closures Market Volume Billion Forecast, by Region 2020 & 2033
- Table 9: Global Nordic Plastic Caps and Closures Market Revenue Million Forecast, by Resin 2020 & 2033
- Table 10: Global Nordic Plastic Caps and Closures Market Volume Billion Forecast, by Resin 2020 & 2033
- Table 11: Global Nordic Plastic Caps and Closures Market Revenue Million Forecast, by Product Type 2020 & 2033
- Table 12: Global Nordic Plastic Caps and Closures Market Volume Billion Forecast, by Product Type 2020 & 2033
- Table 13: Global Nordic Plastic Caps and Closures Market Revenue Million Forecast, by End-user Industries 2020 & 2033
- Table 14: Global Nordic Plastic Caps and Closures Market Volume Billion Forecast, by End-user Industries 2020 & 2033
- Table 15: Global Nordic Plastic Caps and Closures Market Revenue Million Forecast, by Country 2020 & 2033
- Table 16: Global Nordic Plastic Caps and Closures Market Volume Billion Forecast, by Country 2020 & 2033
- Table 17: United States Nordic Plastic Caps and Closures Market Revenue (Million) Forecast, by Application 2020 & 2033
- Table 18: United States Nordic Plastic Caps and Closures Market Volume (Billion) Forecast, by Application 2020 & 2033
- Table 19: Canada Nordic Plastic Caps and Closures Market Revenue (Million) Forecast, by Application 2020 & 2033
- Table 20: Canada Nordic Plastic Caps and Closures Market Volume (Billion) Forecast, by Application 2020 & 2033
- Table 21: Mexico Nordic Plastic Caps and Closures Market Revenue (Million) Forecast, by Application 2020 & 2033
- Table 22: Mexico Nordic Plastic Caps and Closures Market Volume (Billion) Forecast, by Application 2020 & 2033
- Table 23: Global Nordic Plastic Caps and Closures Market Revenue Million Forecast, by Resin 2020 & 2033
- Table 24: Global Nordic Plastic Caps and Closures Market Volume Billion Forecast, by Resin 2020 & 2033
- Table 25: Global Nordic Plastic Caps and Closures Market Revenue Million Forecast, by Product Type 2020 & 2033
- Table 26: Global Nordic Plastic Caps and Closures Market Volume Billion Forecast, by Product Type 2020 & 2033
- Table 27: Global Nordic Plastic Caps and Closures Market Revenue Million Forecast, by End-user Industries 2020 & 2033
- Table 28: Global Nordic Plastic Caps and Closures Market Volume Billion Forecast, by End-user Industries 2020 & 2033
- Table 29: Global Nordic Plastic Caps and Closures Market Revenue Million Forecast, by Country 2020 & 2033
- Table 30: Global Nordic Plastic Caps and Closures Market Volume Billion Forecast, by Country 2020 & 2033
- Table 31: Brazil Nordic Plastic Caps and Closures Market Revenue (Million) Forecast, by Application 2020 & 2033
- Table 32: Brazil Nordic Plastic Caps and Closures Market Volume (Billion) Forecast, by Application 2020 & 2033
- Table 33: Argentina Nordic Plastic Caps and Closures Market Revenue (Million) Forecast, by Application 2020 & 2033
- Table 34: Argentina Nordic Plastic Caps and Closures Market Volume (Billion) Forecast, by Application 2020 & 2033
- Table 35: Rest of South America Nordic Plastic Caps and Closures Market Revenue (Million) Forecast, by Application 2020 & 2033
- Table 36: Rest of South America Nordic Plastic Caps and Closures Market Volume (Billion) Forecast, by Application 2020 & 2033
- Table 37: Global Nordic Plastic Caps and Closures Market Revenue Million Forecast, by Resin 2020 & 2033
- Table 38: Global Nordic Plastic Caps and Closures Market Volume Billion Forecast, by Resin 2020 & 2033
- Table 39: Global Nordic Plastic Caps and Closures Market Revenue Million Forecast, by Product Type 2020 & 2033
- Table 40: Global Nordic Plastic Caps and Closures Market Volume Billion Forecast, by Product Type 2020 & 2033
- Table 41: Global Nordic Plastic Caps and Closures Market Revenue Million Forecast, by End-user Industries 2020 & 2033
- Table 42: Global Nordic Plastic Caps and Closures Market Volume Billion Forecast, by End-user Industries 2020 & 2033
- Table 43: Global Nordic Plastic Caps and Closures Market Revenue Million Forecast, by Country 2020 & 2033
- Table 44: Global Nordic Plastic Caps and Closures Market Volume Billion Forecast, by Country 2020 & 2033
- Table 45: United Kingdom Nordic Plastic Caps and Closures Market Revenue (Million) Forecast, by Application 2020 & 2033
- Table 46: United Kingdom Nordic Plastic Caps and Closures Market Volume (Billion) Forecast, by Application 2020 & 2033
- Table 47: Germany Nordic Plastic Caps and Closures Market Revenue (Million) Forecast, by Application 2020 & 2033
- Table 48: Germany Nordic Plastic Caps and Closures Market Volume (Billion) Forecast, by Application 2020 & 2033
- Table 49: France Nordic Plastic Caps and Closures Market Revenue (Million) Forecast, by Application 2020 & 2033
- Table 50: France Nordic Plastic Caps and Closures Market Volume (Billion) Forecast, by Application 2020 & 2033
- Table 51: Italy Nordic Plastic Caps and Closures Market Revenue (Million) Forecast, by Application 2020 & 2033
- Table 52: Italy Nordic Plastic Caps and Closures Market Volume (Billion) Forecast, by Application 2020 & 2033
- Table 53: Spain Nordic Plastic Caps and Closures Market Revenue (Million) Forecast, by Application 2020 & 2033
- Table 54: Spain Nordic Plastic Caps and Closures Market Volume (Billion) Forecast, by Application 2020 & 2033
- Table 55: Russia Nordic Plastic Caps and Closures Market Revenue (Million) Forecast, by Application 2020 & 2033
- Table 56: Russia Nordic Plastic Caps and Closures Market Volume (Billion) Forecast, by Application 2020 & 2033
- Table 57: Benelux Nordic Plastic Caps and Closures Market Revenue (Million) Forecast, by Application 2020 & 2033
- Table 58: Benelux Nordic Plastic Caps and Closures Market Volume (Billion) Forecast, by Application 2020 & 2033
- Table 59: Nordics Nordic Plastic Caps and Closures Market Revenue (Million) Forecast, by Application 2020 & 2033
- Table 60: Nordics Nordic Plastic Caps and Closures Market Volume (Billion) Forecast, by Application 2020 & 2033
- Table 61: Rest of Europe Nordic Plastic Caps and Closures Market Revenue (Million) Forecast, by Application 2020 & 2033
- Table 62: Rest of Europe Nordic Plastic Caps and Closures Market Volume (Billion) Forecast, by Application 2020 & 2033
- Table 63: Global Nordic Plastic Caps and Closures Market Revenue Million Forecast, by Resin 2020 & 2033
- Table 64: Global Nordic Plastic Caps and Closures Market Volume Billion Forecast, by Resin 2020 & 2033
- Table 65: Global Nordic Plastic Caps and Closures Market Revenue Million Forecast, by Product Type 2020 & 2033
- Table 66: Global Nordic Plastic Caps and Closures Market Volume Billion Forecast, by Product Type 2020 & 2033
- Table 67: Global Nordic Plastic Caps and Closures Market Revenue Million Forecast, by End-user Industries 2020 & 2033
- Table 68: Global Nordic Plastic Caps and Closures Market Volume Billion Forecast, by End-user Industries 2020 & 2033
- Table 69: Global Nordic Plastic Caps and Closures Market Revenue Million Forecast, by Country 2020 & 2033
- Table 70: Global Nordic Plastic Caps and Closures Market Volume Billion Forecast, by Country 2020 & 2033
- Table 71: Turkey Nordic Plastic Caps and Closures Market Revenue (Million) Forecast, by Application 2020 & 2033
- Table 72: Turkey Nordic Plastic Caps and Closures Market Volume (Billion) Forecast, by Application 2020 & 2033
- Table 73: Israel Nordic Plastic Caps and Closures Market Revenue (Million) Forecast, by Application 2020 & 2033
- Table 74: Israel Nordic Plastic Caps and Closures Market Volume (Billion) Forecast, by Application 2020 & 2033
- Table 75: GCC Nordic Plastic Caps and Closures Market Revenue (Million) Forecast, by Application 2020 & 2033
- Table 76: GCC Nordic Plastic Caps and Closures Market Volume (Billion) Forecast, by Application 2020 & 2033
- Table 77: North Africa Nordic Plastic Caps and Closures Market Revenue (Million) Forecast, by Application 2020 & 2033
- Table 78: North Africa Nordic Plastic Caps and Closures Market Volume (Billion) Forecast, by Application 2020 & 2033
- Table 79: South Africa Nordic Plastic Caps and Closures Market Revenue (Million) Forecast, by Application 2020 & 2033
- Table 80: South Africa Nordic Plastic Caps and Closures Market Volume (Billion) Forecast, by Application 2020 & 2033
- Table 81: Rest of Middle East & Africa Nordic Plastic Caps and Closures Market Revenue (Million) Forecast, by Application 2020 & 2033
- Table 82: Rest of Middle East & Africa Nordic Plastic Caps and Closures Market Volume (Billion) Forecast, by Application 2020 & 2033
- Table 83: Global Nordic Plastic Caps and Closures Market Revenue Million Forecast, by Resin 2020 & 2033
- Table 84: Global Nordic Plastic Caps and Closures Market Volume Billion Forecast, by Resin 2020 & 2033
- Table 85: Global Nordic Plastic Caps and Closures Market Revenue Million Forecast, by Product Type 2020 & 2033
- Table 86: Global Nordic Plastic Caps and Closures Market Volume Billion Forecast, by Product Type 2020 & 2033
- Table 87: Global Nordic Plastic Caps and Closures Market Revenue Million Forecast, by End-user Industries 2020 & 2033
- Table 88: Global Nordic Plastic Caps and Closures Market Volume Billion Forecast, by End-user Industries 2020 & 2033
- Table 89: Global Nordic Plastic Caps and Closures Market Revenue Million Forecast, by Country 2020 & 2033
- Table 90: Global Nordic Plastic Caps and Closures Market Volume Billion Forecast, by Country 2020 & 2033
- Table 91: China Nordic Plastic Caps and Closures Market Revenue (Million) Forecast, by Application 2020 & 2033
- Table 92: China Nordic Plastic Caps and Closures Market Volume (Billion) Forecast, by Application 2020 & 2033
- Table 93: India Nordic Plastic Caps and Closures Market Revenue (Million) Forecast, by Application 2020 & 2033
- Table 94: India Nordic Plastic Caps and Closures Market Volume (Billion) Forecast, by Application 2020 & 2033
- Table 95: Japan Nordic Plastic Caps and Closures Market Revenue (Million) Forecast, by Application 2020 & 2033
- Table 96: Japan Nordic Plastic Caps and Closures Market Volume (Billion) Forecast, by Application 2020 & 2033
- Table 97: South Korea Nordic Plastic Caps and Closures Market Revenue (Million) Forecast, by Application 2020 & 2033
- Table 98: South Korea Nordic Plastic Caps and Closures Market Volume (Billion) Forecast, by Application 2020 & 2033
- Table 99: ASEAN Nordic Plastic Caps and Closures Market Revenue (Million) Forecast, by Application 2020 & 2033
- Table 100: ASEAN Nordic Plastic Caps and Closures Market Volume (Billion) Forecast, by Application 2020 & 2033
- Table 101: Oceania Nordic Plastic Caps and Closures Market Revenue (Million) Forecast, by Application 2020 & 2033
- Table 102: Oceania Nordic Plastic Caps and Closures Market Volume (Billion) Forecast, by Application 2020 & 2033
- Table 103: Rest of Asia Pacific Nordic Plastic Caps and Closures Market Revenue (Million) Forecast, by Application 2020 & 2033
- Table 104: Rest of Asia Pacific Nordic Plastic Caps and Closures Market Volume (Billion) Forecast, by Application 2020 & 2033
Frequently Asked Questions
1. What is the projected Compound Annual Growth Rate (CAGR) of the Nordic Plastic Caps and Closures Market?
The projected CAGR is approximately 2.58%.
2. Which companies are prominent players in the Nordic Plastic Caps and Closures Market?
Key companies in the market include Amcor Group GmbH, Bericap Holding GmbH, Berry Global Inc, Carmo A/S, Fin-Korkki Oy, Modulpac AB, Tetra Pak International SV, Robinson PLC8 2 Heat Map Analysis8 3 Competitor Analysis - Emerging vs Established Player.
3. What are the main segments of the Nordic Plastic Caps and Closures Market?
The market segments include Resin, Product Type, End-user Industries.
4. Can you provide details about the market size?
The market size is estimated to be USD 1.25 Million as of 2022.
5. What are some drivers contributing to market growth?
Growing Tourism Boosts the Food and Beverage Industry; Increasing Product Innovation in the Market.
6. What are the notable trends driving market growth?
Polypropylene (PP) Segment is Estimated to Have the Largest Market Share.
7. Are there any restraints impacting market growth?
Growing Tourism Boosts the Food and Beverage Industry; Increasing Product Innovation in the Market.
8. Can you provide examples of recent developments in the market?
February 2024: Robinson PLC, a UK-based company operating in Denmark, exhibited its products at Packaging Innovations and Empack, hosted at Birmingham's National Exhibition Centre (NEC).
9. What pricing options are available for accessing the report?
Pricing options include single-user, multi-user, and enterprise licenses priced at USD 3800, USD 4500, and USD 5800 respectively.
10. Is the market size provided in terms of value or volume?
The market size is provided in terms of value, measured in Million and volume, measured in Billion.
11. Are there any specific market keywords associated with the report?
Yes, the market keyword associated with the report is "Nordic Plastic Caps and Closures Market," which aids in identifying and referencing the specific market segment covered.
12. How do I determine which pricing option suits my needs best?
The pricing options vary based on user requirements and access needs. Individual users may opt for single-user licenses, while businesses requiring broader access may choose multi-user or enterprise licenses for cost-effective access to the report.
13. Are there any additional resources or data provided in the Nordic Plastic Caps and Closures Market report?
While the report offers comprehensive insights, it's advisable to review the specific contents or supplementary materials provided to ascertain if additional resources or data are available.
14. How can I stay updated on further developments or reports in the Nordic Plastic Caps and Closures Market?
To stay informed about further developments, trends, and reports in the Nordic Plastic Caps and Closures Market, consider subscribing to industry newsletters, following relevant companies and organizations, or regularly checking reputable industry news sources and publications.
Methodology
Step 1 - Identification of Relevant Samples Size from Population Database


Step 2 - Approaches for Defining Global Market Size (Value, Volume* & Price*)

Note*: In applicable scenarios
Step 3 - Data Sources
Primary Research
- Web Analytics
- Survey Reports
- Research Institute
- Latest Research Reports
- Opinion Leaders
Secondary Research
- Annual Reports
- White Paper
- Latest Press Release
- Industry Association
- Paid Database
- Investor Presentations

Step 4 - Data Triangulation
Involves using different sources of information in order to increase the validity of a study
These sources are likely to be stakeholders in a program - participants, other researchers, program staff, other community members, and so on.
Then we put all data in single framework & apply various statistical tools to find out the dynamic on the market.
During the analysis stage, feedback from the stakeholder groups would be compared to determine areas of agreement as well as areas of divergence