

Key Insights
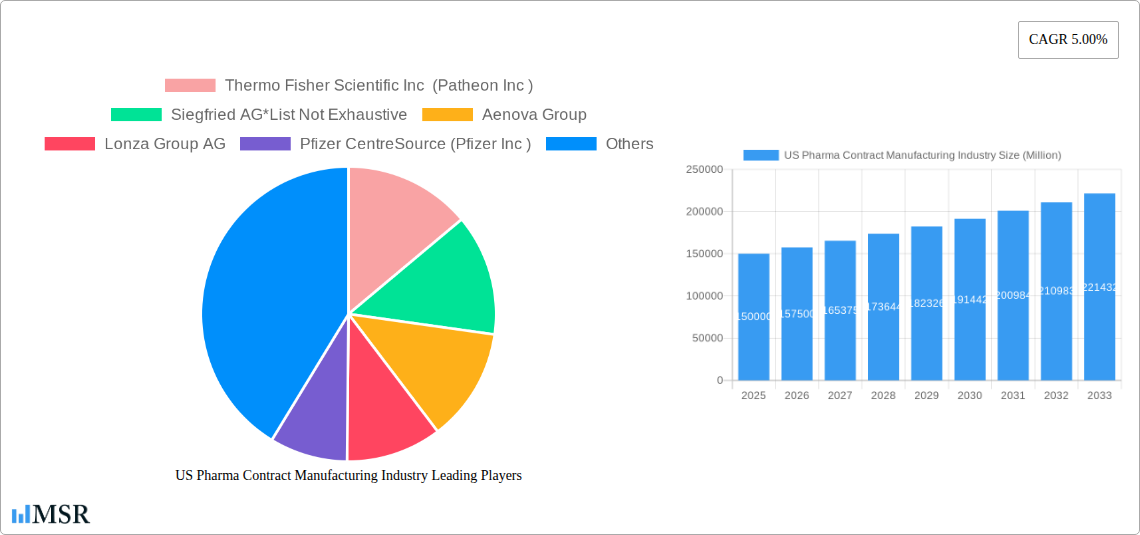
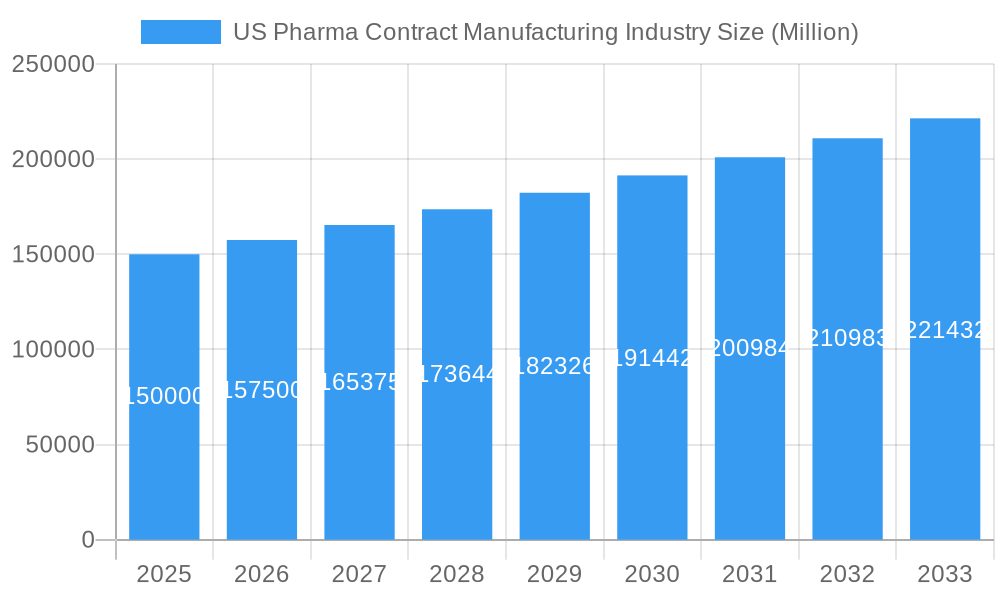
The US pharmaceutical contract manufacturing market is poised for significant expansion, projected to reach a substantial size of approximately $150,000 million by 2025, with an anticipated Compound Annual Growth Rate (CAGR) of 5.00% over the forecast period. This robust growth is primarily fueled by a confluence of critical drivers. The increasing prevalence of chronic diseases and an aging global population are directly contributing to a surge in drug development and manufacturing demand. Pharmaceutical companies are strategically outsourcing manufacturing to contract development and manufacturing organizations (CDMOs) to leverage specialized expertise, advanced technologies, and economies of scale, thereby reducing operational costs and accelerating time-to-market for new therapies. Furthermore, the relentless pursuit of innovative drug discovery, particularly in complex biologics and highly potent active pharmaceutical ingredients (HPAPIs), necessitates sophisticated manufacturing capabilities that many in-house facilities may lack, further bolstering the demand for contract manufacturing services.
US Pharma Contract Manufacturing Industry Market Size (In Billion)
The market's trajectory is also shaped by evolving trends and strategic considerations. The growing emphasis on complex generics and biosimilars, coupled with the rise of personalized medicine, demands flexible and adaptable manufacturing solutions that CDMOs are well-equipped to provide. Moreover, advancements in sterile injectables and advanced drug delivery systems are creating new avenues for growth. However, certain restraints could temper this growth. Stringent regulatory compliance requirements and the need for significant capital investment in specialized facilities can pose challenges. Supply chain disruptions, geopolitical uncertainties, and the increasing cost of raw materials also present potential headwinds. Nonetheless, the US pharmaceutical contract manufacturing sector, supported by a strong pipeline of innovative drugs and a strategic shift towards outsourcing, is set for a period of sustained and healthy expansion.
US Pharma Contract Manufacturing Industry Company Market Share
Unlocking Growth: US Pharma Contract Manufacturing Industry Market Outlook 2025-2033
This comprehensive report provides an in-depth analysis of the US Pharma Contract Manufacturing Industry, exploring market dynamics, key trends, and future opportunities. Delve into the evolving landscape, from active pharmaceutical ingredients (APIs) and finished dosage formulations to secondary packaging, and understand the strategic imperatives shaping this vital sector.
US Pharma Contract Manufacturing Industry Market Concentration & Dynamics
The US Pharma Contract Manufacturing Industry is characterized by a moderate to high level of market concentration, with a few prominent players holding significant market share. The study period, 2019–2033, with a base year of 2025, reveals a dynamic ecosystem driven by innovation and strategic alliances. Key companies like Thermo Fisher Scientific Inc (Patheon Inc) and Lonza Group AG are at the forefront, leveraging advanced technologies and extensive manufacturing capabilities. The forecast period 2025–2033 anticipates continued consolidation and strategic partnerships as companies seek to expand their service offerings and geographical reach. Regulatory frameworks, overseen by entities such as the FDA, play a crucial role in shaping industry practices, ensuring quality and compliance. The report analyzes the impact of substitute products and evolving end-user trends, such as the increasing demand for biologics and personalized medicine, on contract manufacturing strategies. Merger and acquisition (M&A) activities are a significant indicator of market consolidation, with an estimated XX M&A deal counts within the historical period (2019-2024), and projected to grow by XX% during the forecast period. These M&A activities are crucial for achieving economies of scale and expanding service portfolios.
US Pharma Contract Manufacturing Industry Industry Insights & Trends
The US Pharma Contract Manufacturing Industry is poised for significant expansion, projected to reach a market size of approximately $XXX Billion by 2033, exhibiting a robust Compound Annual Growth Rate (CAGR) of XX% between 2025 and 2033. This growth is fueled by several pivotal factors. Firstly, the increasing outsourcing of pharmaceutical manufacturing by both large pharmaceutical companies and emerging biotechs to specialized contract development and manufacturing organizations (CDMOs) continues to be a primary growth driver. This trend is driven by the need for cost efficiencies, access to specialized expertise, and the flexibility to scale production rapidly. The rising prevalence of chronic diseases globally, leading to an increased demand for a diverse range of pharmaceuticals, further propels market growth. Technological disruptions are revolutionizing the industry. Advancements in continuous manufacturing, single-use technologies, and sterile fill-finish operations are enhancing efficiency, reducing lead times, and improving product quality. The burgeoning field of biologics manufacturing, including monoclonal antibodies and gene therapies, represents a particularly high-growth segment, demanding specialized capabilities that many pharma companies choose to outsource. Evolving consumer behaviors, such as the growing preference for minimally invasive treatments and the demand for novel drug delivery systems, are also influencing the types of contract manufacturing services required. Furthermore, the increasing complexity of drug development, particularly in oncology and rare diseases, necessitates the expertise and infrastructure that CDMOs are uniquely positioned to provide. The report details how these industry insights and trends are creating both challenges and unprecedented opportunities for stakeholders within the US pharma contract manufacturing landscape.
Key Markets & Segments Leading US Pharma Contract Manufacturing Industry
The US Pharma Contract Manufacturing Industry is dominated by several key markets and segments, each contributing significantly to the overall growth trajectory.
Dominant Regions & Countries:
- United States: The US remains the largest and most influential market for pharmaceutical contract manufacturing, driven by its robust pharmaceutical R&D ecosystem, strong regulatory framework, and high demand for innovative medicines. Economic growth in the US further underpins this dominance.
- North America: This region, encompassing the US and Canada, benefits from advanced healthcare infrastructure and a high concentration of pharmaceutical companies, making it a focal point for contract manufacturing services.
Dominant Segments by Service Type:
Active P (API) Manufacturing:
- Small Molecule: This segment continues to be a cornerstone of pharmaceutical manufacturing, with substantial demand for cost-effective and large-scale production. The established infrastructure and expertise in small molecule synthesis make it a stable growth area.
- Large Molecule: The burgeoning demand for biologics, including proteins, antibodies, and vaccines, has propelled the growth of large molecule API manufacturing. This segment requires highly specialized capabilities and advanced biotechnological processes.
- High Potency API (HPAPI): The increasing development of highly potent drugs, particularly in oncology, has created a significant demand for specialized HPAPI manufacturing. These facilities require stringent containment protocols and advanced safety measures, representing a high-value niche.
Finished Dosage Formulations:
- Solid Dose Formulation: This remains the most prevalent dosage form, encompassing tablets and capsules. The consistent demand from a wide range of therapeutic areas ensures its continued importance in the contract manufacturing market.
- Liquid Dose Formulation: This segment caters to specific patient populations and drug types, including pediatric and geriatric formulations. Growth is driven by the development of new liquid-based therapies and the need for alternative delivery methods.
- Injectable Dose Formulation: The demand for sterile injectables, including pre-filled syringes and vials, is experiencing rapid growth, driven by the increasing prevalence of chronic diseases, the rise of biologics, and the demand for convenient drug administration. This segment requires highly specialized aseptic manufacturing capabilities.
Secondary Packaging: This crucial segment involves the labeling, kitting, and final packaging of pharmaceutical products. As regulatory requirements for serialization and track-and-trace become more stringent, demand for sophisticated secondary packaging solutions is escalating.
US Pharma Contract Manufacturing Industry Product Developments
The US Pharma Contract Manufacturing Industry is witnessing significant product developments driven by technological advancements and evolving therapeutic needs. Innovations in sterile fill-finish technologies, such as advanced isolator systems and robotic filling, are enhancing aseptic processing and reducing contamination risks for injectable formulations. The development of specialized facilities for manufacturing high-potency active pharmaceutical ingredients (HPAPIs) is crucial for the growing oncology pipeline, offering specialized containment and handling capabilities. Furthermore, CDMOs are investing in capabilities for producing complex biologics, including cell and gene therapies, requiring advanced bioprocessing and purification techniques. These product developments enable CDMOs to offer end-to-end solutions, from early-stage development to commercial manufacturing, providing a competitive edge in a dynamic market.
Challenges in the US Pharma Contract Manufacturing Industry Market
The US Pharma Contract Manufacturing Industry faces several significant challenges that can impact growth and operational efficiency. Stringent and evolving regulatory landscapes, including FDA compliance and GMP standards, necessitate continuous investment in quality systems and adherence to rigorous protocols. Supply chain disruptions, exacerbated by global events, can lead to material shortages and increased lead times, impacting production schedules. Intense competition among CDMOs drives pricing pressures, demanding optimized operational efficiencies and value-added services. Furthermore, the specialized nature of certain manufacturing processes, particularly for biologics and HPAPIs, requires substantial capital investment in advanced technologies and highly skilled personnel, posing a barrier to entry for some.
Forces Driving US Pharma Contract Manufacturing Industry Growth
Several powerful forces are propelling the growth of the US Pharma Contract Manufacturing Industry. The relentless pursuit of innovation within the pharmaceutical sector leads to a continuous pipeline of new drugs, many of which are outsourced for manufacturing. The increasing complexity of drug development, particularly in areas like biologics and personalized medicine, necessitates specialized expertise and advanced manufacturing capabilities that CDMOs provide. Cost optimization remains a critical driver, as pharmaceutical companies leverage the economies of scale and operational efficiencies offered by contract manufacturers. Furthermore, the need for flexible manufacturing capacity allows companies to scale production up or down based on market demand, without significant capital investment.
Challenges in the US Pharma Contract Manufacturing Industry Market
Long-term growth catalysts for the US Pharma Contract Manufacturing Industry are deeply rooted in technological advancements and strategic market expansions. The increasing adoption of digital manufacturing technologies, including AI-driven process optimization and advanced analytics, is enhancing efficiency and predictive maintenance. Investments in sustainable manufacturing practices are becoming crucial, driven by regulatory pressures and corporate social responsibility initiatives. Furthermore, the expansion of services into niche areas such as cell and gene therapy manufacturing and the development of lyophilization capabilities are opening new avenues for growth. Strategic partnerships and collaborations between CDMOs and pharmaceutical companies, particularly in early-stage development, foster innovation and ensure a steady flow of business.
Emerging Opportunities in US Pharma Contract Manufacturing Industry
Emerging opportunities within the US Pharma Contract Manufacturing Industry are abundant and diverse. The rapidly expanding market for biologics, including monoclonal antibodies, vaccines, and biosimilars, presents a significant growth area, demanding specialized manufacturing expertise. The burgeoning field of cell and gene therapies, while complex, offers immense therapeutic potential and a high-value manufacturing opportunity for CDMOs with the requisite capabilities. The increasing focus on personalized medicine and orphan drugs requires flexible and agile manufacturing solutions capable of handling smaller batch sizes and diverse product portfolios. Furthermore, the growing demand for advanced drug delivery systems and complex formulations, such as long-acting injectables and novel oral delivery technologies, opens new avenues for specialized contract manufacturing services.
Leading Players in the US Pharma Contract Manufacturing Industry Sector
- Thermo Fisher Scientific Inc (Patheon Inc)
- Siegfried AG
- Aenova Group
- Lonza Group AG
- Pfizer CentreSource (Pfizer Inc)
- Jubilant Life Sciences Ltd
- Catalent Inc
- AbbVie Contract Manufacturing
- Boehringer Ingelheim Group
- Recipharm AB
- Baxter Biopharma Solutions (Baxter International Inc)
Key Milestones in US Pharma Contract Manufacturing Industry Industry
- 2019: Increased investment in sterile injectables manufacturing capacity by major CDMOs to meet growing demand.
- 2020: Accelerated outsourcing of COVID-19 vaccine and therapeutic manufacturing, highlighting the critical role of contract manufacturers.
- 2021: Significant M&A activity focused on acquiring capabilities in biologics and HPAPI manufacturing.
- 2022: Growing adoption of advanced technologies like continuous manufacturing and single-use systems.
- 2023: Enhanced focus on supply chain resilience and diversification of manufacturing sites.
- 2024: Expansion of services to include advanced therapy medicinal products (ATMPs) and cell/gene therapy manufacturing.
Strategic Outlook for US Pharma Contract Manufacturing Industry Market
The strategic outlook for the US Pharma Contract Manufacturing Industry is overwhelmingly positive, driven by sustained demand for outsourced pharmaceutical manufacturing. Growth accelerators include continuous investment in cutting-edge technologies like advanced biologics processing, sterile fill-finish, and high-potency API manufacturing. CDMOs that can offer end-to-end solutions, from drug development to commercialization, will be best positioned for success. Strategic partnerships with pharmaceutical and biotech companies, particularly in emerging therapeutic areas, will be crucial for securing long-term contracts. Furthermore, a commitment to regulatory compliance, quality assurance, and supply chain reliability will remain paramount for maintaining a competitive edge and fostering client trust.
US Pharma Contract Manufacturing Industry Segmentation
-
1. Service Type
-
1.1. Active P
- 1.1.1. Small Molecule
- 1.1.2. Large Molecule
- 1.1.3. High Potency API (HPAPI)
-
1.2. Finished
- 1.2.1. Solid Dose Formulation
- 1.2.2. Liquid Dose Formulation
- 1.2.3. Injectable Dose Formulation
- 1.3. Secondary Packaging
-
1.1. Active P
US Pharma Contract Manufacturing Industry Segmentation By Geography
-
1. North America
- 1.1. United States
- 1.2. Canada
- 1.3. Mexico
-
2. South America
- 2.1. Brazil
- 2.2. Argentina
- 2.3. Rest of South America
-
3. Europe
- 3.1. United Kingdom
- 3.2. Germany
- 3.3. France
- 3.4. Italy
- 3.5. Spain
- 3.6. Russia
- 3.7. Benelux
- 3.8. Nordics
- 3.9. Rest of Europe
-
4. Middle East & Africa
- 4.1. Turkey
- 4.2. Israel
- 4.3. GCC
- 4.4. North Africa
- 4.5. South Africa
- 4.6. Rest of Middle East & Africa
-
5. Asia Pacific
- 5.1. China
- 5.2. India
- 5.3. Japan
- 5.4. South Korea
- 5.5. ASEAN
- 5.6. Oceania
- 5.7. Rest of Asia Pacific
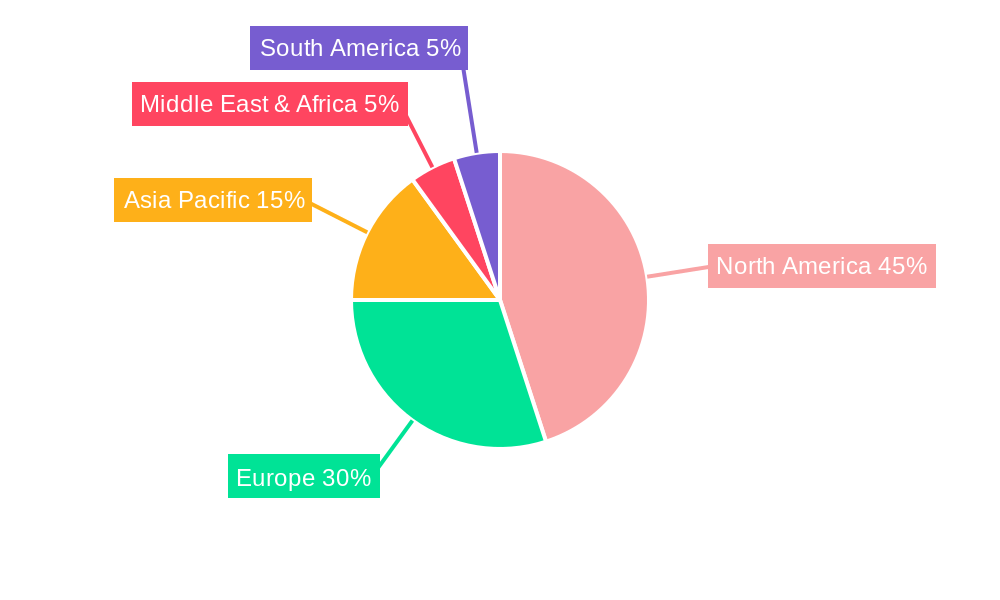
US Pharma Contract Manufacturing Industry Regional Market Share
Geographic Coverage of US Pharma Contract Manufacturing Industry
US Pharma Contract Manufacturing Industry REPORT HIGHLIGHTS
| Aspects | Details |
|---|---|
| Study Period | 2020-2034 |
| Base Year | 2025 |
| Estimated Year | 2026 |
| Forecast Period | 2026-2034 |
| Historical Period | 2020-2025 |
| Growth Rate | CAGR of 5.00% from 2020-2034 |
| Segmentation |
|
Table of Contents
- 1. Introduction
- 1.1. Research Scope
- 1.2. Market Segmentation
- 1.3. Research Objective
- 1.4. Definitions and Assumptions
- 2. Executive Summary
- 2.1. Market Snapshot
- 3. Market Dynamics
- 3.1. Market Drivers
- 3.2. Market Restrains
- 3.3. Market Trends
- 3.4. Market Opportunities
- 4. Market Factor Analysis
- 4.1. Porters Five Forces
- 4.1.1. Bargaining Power of Suppliers
- 4.1.2. Bargaining Power of Buyers
- 4.1.3. Threat of New Entrants
- 4.1.4. Threat of Substitutes
- 4.1.5. Competitive Rivalry
- 4.2. PESTEL analysis
- 4.3. BCG Analysis
- 4.3.1. Stars (High Growth, High Market Share)
- 4.3.2. Cash Cows (Low Growth, High Market Share)
- 4.3.3. Question Mark (High Growth, Low Market Share)
- 4.3.4. Dogs (Low Growth, Low Market Share)
- 4.4. Ansoff Matrix Analysis
- 4.5. Supply Chain Analysis
- 4.6. Regulatory Landscape
- 4.7. Current Market Potential and Opportunity Assessment (TAM–SAM–SOM Framework)
- 4.8. MSR Analyst Note
- 4.1. Porters Five Forces
- 5. Market Analysis, Insights and Forecast 2021-2033
- 5.1. Market Analysis, Insights and Forecast - by Service Type
- 5.1.1. Active P
- 5.1.1.1. Small Molecule
- 5.1.1.2. Large Molecule
- 5.1.1.3. High Potency API (HPAPI)
- 5.1.2. Finished
- 5.1.2.1. Solid Dose Formulation
- 5.1.2.2. Liquid Dose Formulation
- 5.1.2.3. Injectable Dose Formulation
- 5.1.3. Secondary Packaging
- 5.1.1. Active P
- 5.2. Market Analysis, Insights and Forecast - by Region
- 5.2.1. North America
- 5.2.2. South America
- 5.2.3. Europe
- 5.2.4. Middle East & Africa
- 5.2.5. Asia Pacific
- 5.1. Market Analysis, Insights and Forecast - by Service Type
- 6. Global US Pharma Contract Manufacturing Industry Analysis, Insights and Forecast, 2021-2033
- 6.1. Market Analysis, Insights and Forecast - by Service Type
- 6.1.1. Active P
- 6.1.1.1. Small Molecule
- 6.1.1.2. Large Molecule
- 6.1.1.3. High Potency API (HPAPI)
- 6.1.2. Finished
- 6.1.2.1. Solid Dose Formulation
- 6.1.2.2. Liquid Dose Formulation
- 6.1.2.3. Injectable Dose Formulation
- 6.1.3. Secondary Packaging
- 6.1.1. Active P
- 6.1. Market Analysis, Insights and Forecast - by Service Type
- 7. North America US Pharma Contract Manufacturing Industry Analysis, Insights and Forecast, 2020-2032
- 7.1. Market Analysis, Insights and Forecast - by Service Type
- 7.1.1. Active P
- 7.1.1.1. Small Molecule
- 7.1.1.2. Large Molecule
- 7.1.1.3. High Potency API (HPAPI)
- 7.1.2. Finished
- 7.1.2.1. Solid Dose Formulation
- 7.1.2.2. Liquid Dose Formulation
- 7.1.2.3. Injectable Dose Formulation
- 7.1.3. Secondary Packaging
- 7.1.1. Active P
- 7.1. Market Analysis, Insights and Forecast - by Service Type
- 8. South America US Pharma Contract Manufacturing Industry Analysis, Insights and Forecast, 2020-2032
- 8.1. Market Analysis, Insights and Forecast - by Service Type
- 8.1.1. Active P
- 8.1.1.1. Small Molecule
- 8.1.1.2. Large Molecule
- 8.1.1.3. High Potency API (HPAPI)
- 8.1.2. Finished
- 8.1.2.1. Solid Dose Formulation
- 8.1.2.2. Liquid Dose Formulation
- 8.1.2.3. Injectable Dose Formulation
- 8.1.3. Secondary Packaging
- 8.1.1. Active P
- 8.1. Market Analysis, Insights and Forecast - by Service Type
- 9. Europe US Pharma Contract Manufacturing Industry Analysis, Insights and Forecast, 2020-2032
- 9.1. Market Analysis, Insights and Forecast - by Service Type
- 9.1.1. Active P
- 9.1.1.1. Small Molecule
- 9.1.1.2. Large Molecule
- 9.1.1.3. High Potency API (HPAPI)
- 9.1.2. Finished
- 9.1.2.1. Solid Dose Formulation
- 9.1.2.2. Liquid Dose Formulation
- 9.1.2.3. Injectable Dose Formulation
- 9.1.3. Secondary Packaging
- 9.1.1. Active P
- 9.1. Market Analysis, Insights and Forecast - by Service Type
- 10. Middle East & Africa US Pharma Contract Manufacturing Industry Analysis, Insights and Forecast, 2020-2032
- 10.1. Market Analysis, Insights and Forecast - by Service Type
- 10.1.1. Active P
- 10.1.1.1. Small Molecule
- 10.1.1.2. Large Molecule
- 10.1.1.3. High Potency API (HPAPI)
- 10.1.2. Finished
- 10.1.2.1. Solid Dose Formulation
- 10.1.2.2. Liquid Dose Formulation
- 10.1.2.3. Injectable Dose Formulation
- 10.1.3. Secondary Packaging
- 10.1.1. Active P
- 10.1. Market Analysis, Insights and Forecast - by Service Type
- 11. Asia Pacific US Pharma Contract Manufacturing Industry Analysis, Insights and Forecast, 2020-2032
- 11.1. Market Analysis, Insights and Forecast - by Service Type
- 11.1.1. Active P
- 11.1.1.1. Small Molecule
- 11.1.1.2. Large Molecule
- 11.1.1.3. High Potency API (HPAPI)
- 11.1.2. Finished
- 11.1.2.1. Solid Dose Formulation
- 11.1.2.2. Liquid Dose Formulation
- 11.1.2.3. Injectable Dose Formulation
- 11.1.3. Secondary Packaging
- 11.1.1. Active P
- 11.1. Market Analysis, Insights and Forecast - by Service Type
- 12. Competitive Analysis
- 12.1. Company Profiles
- 12.1.1 Thermo Fisher Scientific Inc (Patheon Inc )
- 12.1.1.1. Company Overview
- 12.1.1.2. Products
- 12.1.1.3. Company Financials
- 12.1.1.4. SWOT Analysis
- 12.1.2 Siegfried AG*List Not Exhaustive
- 12.1.2.1. Company Overview
- 12.1.2.2. Products
- 12.1.2.3. Company Financials
- 12.1.2.4. SWOT Analysis
- 12.1.3 Aenova Group
- 12.1.3.1. Company Overview
- 12.1.3.2. Products
- 12.1.3.3. Company Financials
- 12.1.3.4. SWOT Analysis
- 12.1.4 Lonza Group AG
- 12.1.4.1. Company Overview
- 12.1.4.2. Products
- 12.1.4.3. Company Financials
- 12.1.4.4. SWOT Analysis
- 12.1.5 Pfizer CentreSource (Pfizer Inc )
- 12.1.5.1. Company Overview
- 12.1.5.2. Products
- 12.1.5.3. Company Financials
- 12.1.5.4. SWOT Analysis
- 12.1.6 Jubilant Life Sciences Ltd
- 12.1.6.1. Company Overview
- 12.1.6.2. Products
- 12.1.6.3. Company Financials
- 12.1.6.4. SWOT Analysis
- 12.1.7 Catalent Inc
- 12.1.7.1. Company Overview
- 12.1.7.2. Products
- 12.1.7.3. Company Financials
- 12.1.7.4. SWOT Analysis
- 12.1.8 AbbVie Contract Manufacturing
- 12.1.8.1. Company Overview
- 12.1.8.2. Products
- 12.1.8.3. Company Financials
- 12.1.8.4. SWOT Analysis
- 12.1.9 Boehringer Ingelheim Group
- 12.1.9.1. Company Overview
- 12.1.9.2. Products
- 12.1.9.3. Company Financials
- 12.1.9.4. SWOT Analysis
- 12.1.10 Recipharm AB
- 12.1.10.1. Company Overview
- 12.1.10.2. Products
- 12.1.10.3. Company Financials
- 12.1.10.4. SWOT Analysis
- 12.1.11 Baxter Biopharma Solutions (Baxter International Inc )
- 12.1.11.1. Company Overview
- 12.1.11.2. Products
- 12.1.11.3. Company Financials
- 12.1.11.4. SWOT Analysis
- 12.1.1 Thermo Fisher Scientific Inc (Patheon Inc )
- 12.2. Market Entropy
- 12.2.1 Company's Key Areas Served
- 12.2.2 Recent Developments
- 12.3. Company Market Share Analysis 2025
- 12.3.1 Top 5 Companies Market Share Analysis
- 12.3.2 Top 3 Companies Market Share Analysis
- 12.4. List of Potential Customers
- 13. Research Methodology
List of Figures
- Figure 1: Global US Pharma Contract Manufacturing Industry Revenue Breakdown (Million, %) by Region 2025 & 2033
- Figure 2: North America US Pharma Contract Manufacturing Industry Revenue (Million), by Service Type 2025 & 2033
- Figure 3: North America US Pharma Contract Manufacturing Industry Revenue Share (%), by Service Type 2025 & 2033
- Figure 4: North America US Pharma Contract Manufacturing Industry Revenue (Million), by Country 2025 & 2033
- Figure 5: North America US Pharma Contract Manufacturing Industry Revenue Share (%), by Country 2025 & 2033
- Figure 6: South America US Pharma Contract Manufacturing Industry Revenue (Million), by Service Type 2025 & 2033
- Figure 7: South America US Pharma Contract Manufacturing Industry Revenue Share (%), by Service Type 2025 & 2033
- Figure 8: South America US Pharma Contract Manufacturing Industry Revenue (Million), by Country 2025 & 2033
- Figure 9: South America US Pharma Contract Manufacturing Industry Revenue Share (%), by Country 2025 & 2033
- Figure 10: Europe US Pharma Contract Manufacturing Industry Revenue (Million), by Service Type 2025 & 2033
- Figure 11: Europe US Pharma Contract Manufacturing Industry Revenue Share (%), by Service Type 2025 & 2033
- Figure 12: Europe US Pharma Contract Manufacturing Industry Revenue (Million), by Country 2025 & 2033
- Figure 13: Europe US Pharma Contract Manufacturing Industry Revenue Share (%), by Country 2025 & 2033
- Figure 14: Middle East & Africa US Pharma Contract Manufacturing Industry Revenue (Million), by Service Type 2025 & 2033
- Figure 15: Middle East & Africa US Pharma Contract Manufacturing Industry Revenue Share (%), by Service Type 2025 & 2033
- Figure 16: Middle East & Africa US Pharma Contract Manufacturing Industry Revenue (Million), by Country 2025 & 2033
- Figure 17: Middle East & Africa US Pharma Contract Manufacturing Industry Revenue Share (%), by Country 2025 & 2033
- Figure 18: Asia Pacific US Pharma Contract Manufacturing Industry Revenue (Million), by Service Type 2025 & 2033
- Figure 19: Asia Pacific US Pharma Contract Manufacturing Industry Revenue Share (%), by Service Type 2025 & 2033
- Figure 20: Asia Pacific US Pharma Contract Manufacturing Industry Revenue (Million), by Country 2025 & 2033
- Figure 21: Asia Pacific US Pharma Contract Manufacturing Industry Revenue Share (%), by Country 2025 & 2033
List of Tables
- Table 1: Global US Pharma Contract Manufacturing Industry Revenue Million Forecast, by Service Type 2020 & 2033
- Table 2: Global US Pharma Contract Manufacturing Industry Revenue Million Forecast, by Region 2020 & 2033
- Table 3: Global US Pharma Contract Manufacturing Industry Revenue Million Forecast, by Service Type 2020 & 2033
- Table 4: Global US Pharma Contract Manufacturing Industry Revenue Million Forecast, by Country 2020 & 2033
- Table 5: United States US Pharma Contract Manufacturing Industry Revenue (Million) Forecast, by Application 2020 & 2033
- Table 6: Canada US Pharma Contract Manufacturing Industry Revenue (Million) Forecast, by Application 2020 & 2033
- Table 7: Mexico US Pharma Contract Manufacturing Industry Revenue (Million) Forecast, by Application 2020 & 2033
- Table 8: Global US Pharma Contract Manufacturing Industry Revenue Million Forecast, by Service Type 2020 & 2033
- Table 9: Global US Pharma Contract Manufacturing Industry Revenue Million Forecast, by Country 2020 & 2033
- Table 10: Brazil US Pharma Contract Manufacturing Industry Revenue (Million) Forecast, by Application 2020 & 2033
- Table 11: Argentina US Pharma Contract Manufacturing Industry Revenue (Million) Forecast, by Application 2020 & 2033
- Table 12: Rest of South America US Pharma Contract Manufacturing Industry Revenue (Million) Forecast, by Application 2020 & 2033
- Table 13: Global US Pharma Contract Manufacturing Industry Revenue Million Forecast, by Service Type 2020 & 2033
- Table 14: Global US Pharma Contract Manufacturing Industry Revenue Million Forecast, by Country 2020 & 2033
- Table 15: United Kingdom US Pharma Contract Manufacturing Industry Revenue (Million) Forecast, by Application 2020 & 2033
- Table 16: Germany US Pharma Contract Manufacturing Industry Revenue (Million) Forecast, by Application 2020 & 2033
- Table 17: France US Pharma Contract Manufacturing Industry Revenue (Million) Forecast, by Application 2020 & 2033
- Table 18: Italy US Pharma Contract Manufacturing Industry Revenue (Million) Forecast, by Application 2020 & 2033
- Table 19: Spain US Pharma Contract Manufacturing Industry Revenue (Million) Forecast, by Application 2020 & 2033
- Table 20: Russia US Pharma Contract Manufacturing Industry Revenue (Million) Forecast, by Application 2020 & 2033
- Table 21: Benelux US Pharma Contract Manufacturing Industry Revenue (Million) Forecast, by Application 2020 & 2033
- Table 22: Nordics US Pharma Contract Manufacturing Industry Revenue (Million) Forecast, by Application 2020 & 2033
- Table 23: Rest of Europe US Pharma Contract Manufacturing Industry Revenue (Million) Forecast, by Application 2020 & 2033
- Table 24: Global US Pharma Contract Manufacturing Industry Revenue Million Forecast, by Service Type 2020 & 2033
- Table 25: Global US Pharma Contract Manufacturing Industry Revenue Million Forecast, by Country 2020 & 2033
- Table 26: Turkey US Pharma Contract Manufacturing Industry Revenue (Million) Forecast, by Application 2020 & 2033
- Table 27: Israel US Pharma Contract Manufacturing Industry Revenue (Million) Forecast, by Application 2020 & 2033
- Table 28: GCC US Pharma Contract Manufacturing Industry Revenue (Million) Forecast, by Application 2020 & 2033
- Table 29: North Africa US Pharma Contract Manufacturing Industry Revenue (Million) Forecast, by Application 2020 & 2033
- Table 30: South Africa US Pharma Contract Manufacturing Industry Revenue (Million) Forecast, by Application 2020 & 2033
- Table 31: Rest of Middle East & Africa US Pharma Contract Manufacturing Industry Revenue (Million) Forecast, by Application 2020 & 2033
- Table 32: Global US Pharma Contract Manufacturing Industry Revenue Million Forecast, by Service Type 2020 & 2033
- Table 33: Global US Pharma Contract Manufacturing Industry Revenue Million Forecast, by Country 2020 & 2033
- Table 34: China US Pharma Contract Manufacturing Industry Revenue (Million) Forecast, by Application 2020 & 2033
- Table 35: India US Pharma Contract Manufacturing Industry Revenue (Million) Forecast, by Application 2020 & 2033
- Table 36: Japan US Pharma Contract Manufacturing Industry Revenue (Million) Forecast, by Application 2020 & 2033
- Table 37: South Korea US Pharma Contract Manufacturing Industry Revenue (Million) Forecast, by Application 2020 & 2033
- Table 38: ASEAN US Pharma Contract Manufacturing Industry Revenue (Million) Forecast, by Application 2020 & 2033
- Table 39: Oceania US Pharma Contract Manufacturing Industry Revenue (Million) Forecast, by Application 2020 & 2033
- Table 40: Rest of Asia Pacific US Pharma Contract Manufacturing Industry Revenue (Million) Forecast, by Application 2020 & 2033
Frequently Asked Questions
1. What is the projected Compound Annual Growth Rate (CAGR) of the US Pharma Contract Manufacturing Industry?
The projected CAGR is approximately 5.00%.
2. Which companies are prominent players in the US Pharma Contract Manufacturing Industry?
Key companies in the market include Thermo Fisher Scientific Inc (Patheon Inc ), Siegfried AG*List Not Exhaustive, Aenova Group, Lonza Group AG, Pfizer CentreSource (Pfizer Inc ), Jubilant Life Sciences Ltd, Catalent Inc, AbbVie Contract Manufacturing, Boehringer Ingelheim Group, Recipharm AB, Baxter Biopharma Solutions (Baxter International Inc ).
3. What are the main segments of the US Pharma Contract Manufacturing Industry?
The market segments include Service Type.
4. Can you provide details about the market size?
The market size is estimated to be USD XX Million as of 2022.
5. What are some drivers contributing to market growth?
; Increasing Emphasis on Drug Discovery and Outsourcing of Manufacturing; Strong R&D Investments.
6. What are the notable trends driving market growth?
Increasing Demand of API to Witness Significant Market Growth.
7. Are there any restraints impacting market growth?
Increasing Lead Time and Logistics Costs; Stringent Regulatory Requirements; Capacity Utilization Issues Affecting the Profitability of CMOs.
8. Can you provide examples of recent developments in the market?
N/A
9. What pricing options are available for accessing the report?
Pricing options include single-user, multi-user, and enterprise licenses priced at USD 3800, USD 4500, and USD 5800 respectively.
10. Is the market size provided in terms of value or volume?
The market size is provided in terms of value, measured in Million.
11. Are there any specific market keywords associated with the report?
Yes, the market keyword associated with the report is "US Pharma Contract Manufacturing Industry," which aids in identifying and referencing the specific market segment covered.
12. How do I determine which pricing option suits my needs best?
The pricing options vary based on user requirements and access needs. Individual users may opt for single-user licenses, while businesses requiring broader access may choose multi-user or enterprise licenses for cost-effective access to the report.
13. Are there any additional resources or data provided in the US Pharma Contract Manufacturing Industry report?
While the report offers comprehensive insights, it's advisable to review the specific contents or supplementary materials provided to ascertain if additional resources or data are available.
14. How can I stay updated on further developments or reports in the US Pharma Contract Manufacturing Industry?
To stay informed about further developments, trends, and reports in the US Pharma Contract Manufacturing Industry, consider subscribing to industry newsletters, following relevant companies and organizations, or regularly checking reputable industry news sources and publications.
Methodology
Step 1 - Identification of Relevant Samples Size from Population Database


Step 2 - Approaches for Defining Global Market Size (Value, Volume* & Price*)

Note*: In applicable scenarios
Step 3 - Data Sources
Primary Research
- Web Analytics
- Survey Reports
- Research Institute
- Latest Research Reports
- Opinion Leaders
Secondary Research
- Annual Reports
- White Paper
- Latest Press Release
- Industry Association
- Paid Database
- Investor Presentations

Step 4 - Data Triangulation
Involves using different sources of information in order to increase the validity of a study
These sources are likely to be stakeholders in a program - participants, other researchers, program staff, other community members, and so on.
Then we put all data in single framework & apply various statistical tools to find out the dynamic on the market.
During the analysis stage, feedback from the stakeholder groups would be compared to determine areas of agreement as well as areas of divergence