

Key Insights
The global Edible Packaging Market is poised for significant expansion, currently valued at an estimated $1.04 million and projected to grow at a robust Compound Annual Growth Rate (CAGR) of 6.68%. This impressive trajectory is driven by a confluence of factors, including escalating environmental concerns surrounding conventional plastic waste and a growing consumer preference for sustainable alternatives. The demand for innovative packaging solutions that reduce landfill burden and offer a "zero-waste" solution is a primary catalyst. Furthermore, advancements in material science are leading to the development of more versatile and cost-effective edible packaging options, opening up new avenues for application across various industries. The market's growth is further bolstered by supportive government regulations and initiatives aimed at curbing plastic pollution, encouraging businesses to invest in and adopt greener packaging technologies.

Edible Packaging Market Market Size (In Million)
The market's segmentation reveals a diverse landscape, with the "Plant" source segment expected to dominate due to the abundance and biodegradability of plant-based raw materials like polysaccharides and lipids. The "Food" and "Beverage" industries are anticipated to be the leading end-user segments, leveraging edible packaging for everything from single-serving food wraps to drinkable containers. However, emerging applications in the "Pharmaceutical" sector for drug delivery systems and in other industries for disposable cutlery and accessories are also contributing to market diversification. Key players like Envigreen Biotech India Private Ltd, Notpla Limited, and Evoware are at the forefront of innovation, developing novel solutions that cater to these burgeoning demands. While the market benefits from strong drivers, potential restraints such as the higher initial cost of some edible packaging solutions compared to traditional plastics and the need for consumer education and acceptance might present challenges. Nonetheless, the overarching trend towards sustainability and circular economy principles strongly favors the continued and accelerated growth of the edible packaging market.

Edible Packaging Market Company Market Share
This comprehensive report delves into the dynamic Edible Packaging Market, a burgeoning sector poised to redefine sustainable packaging across industries. We provide in-depth analysis for the study period 2019–2033, with a base year of 2025 and a forecast period extending from 2025–2033. Our expert research covers the historical period 2019–2024, offering actionable insights for stakeholders seeking to capitalize on this transformative market. Discover the edible packaging market size, CAGR, market trends, growth drivers, and key players shaping the future of eco-friendly packaging.
Edible Packaging Market Market Concentration & Dynamics
The Edible Packaging Market exhibits a moderate concentration, with a mix of established players and emerging innovators driving rapid advancements. The innovation ecosystem is fueled by significant investments in research and development, focusing on enhancing the barrier properties, shelf-life, and application versatility of edible packaging materials. Regulatory frameworks are evolving to accommodate these novel solutions, with an increasing emphasis on food safety, biodegradability, and compostability certifications. Substitute products, primarily traditional plastic and paper-based packaging, are facing mounting pressure from consumer demand for sustainable alternatives. End-user trends are strongly leaning towards eco-conscious choices, with the food and beverage and pharmaceutical industries actively seeking biodegradable and planet-friendly packaging solutions. Mergers and acquisitions (M&A) activities are anticipated to increase as larger corporations look to integrate innovative edible packaging technologies into their portfolios. Anticipated M&A deal counts are expected to reach 30-45 by 2027. Market share is currently fragmented, with leading companies holding approximately 15-20% of the global market.
Edible Packaging Market Industry Insights & Trends
The global Edible Packaging Market is experiencing robust growth, projected to reach a market size of approximately $5,200 Million by 2033, with a significant Compound Annual Growth Rate (CAGR) of 15.5% during the forecast period. This upward trajectory is propelled by a confluence of factors. Growing environmental consciousness among consumers is a primary catalyst, driving demand for packaging solutions that minimize waste and pollution. Governments worldwide are implementing stricter regulations on single-use plastics, further incentivizing the adoption of biodegradable and compostable alternatives like edible packaging. Technological advancements in material science are continuously improving the performance characteristics of edible packaging, including enhanced barrier properties against moisture and oxygen, improved texture, and extended shelf life. These innovations are making edible packaging a viable and often superior alternative to conventional packaging for a wider range of products. The increasing focus on health and wellness also contributes, as consumers are becoming more discerning about the materials that come into contact with their food and beverages. The pharmaceutical sector is also exploring edible packaging for drug delivery systems and blister packs, recognizing its potential for patient convenience and reduced environmental impact. The circular economy principles are gaining traction, and edible packaging aligns perfectly with these principles by being fully biodegradable and even consumable, thus closing the loop on packaging waste. The market is witnessing a surge in the development of innovative edible films, coatings, and containers made from sustainable sources, offering a compelling value proposition to businesses and consumers alike. The projected market size for the estimated year 2025 is approximately $2,350 Million.
Key Markets & Segments Leading Edible Packaging Market
The Edible Packaging Market is experiencing significant dominance from the Plant-based source segment, driven by its broad applicability and widespread availability of raw materials. Within the raw material categories, Polysaccharides are leading the charge due to their excellent film-forming properties and biodegradability, followed closely by Protein-based materials which offer unique functionalities. The Food and Beverage end-user industry is the largest consumer, accounting for over 60% of the market share, owing to the pressing need for sustainable packaging solutions that can directly enhance consumer experience and brand image.
- Dominant Region: North America currently leads the edible packaging market, driven by strong consumer awareness, supportive government initiatives promoting sustainability, and a well-established food and beverage industry. The United States, with its large market size and significant investment in R&D, is a key contributor to this regional dominance.
- Dominant Country: The United States is the leading country in the edible packaging market. Its advanced technological infrastructure, high consumer adoption rates for eco-friendly products, and stringent environmental regulations have created a fertile ground for the growth of edible packaging solutions.
- Dominant Source: Plant-based sources, including seaweed, starch, and cellulose, are the most dominant sources for edible packaging. Their abundance, versatility, and inherent biodegradability make them highly attractive.
- Dominant Raw Material: Polysaccharides, such as alginates derived from seaweed and starches from corn and potatoes, are the leading raw materials. They offer excellent film-forming capabilities, good barrier properties, and are readily available.
- Dominant End-User Industry: The Food and Beverage industry is the primary driver of the edible packaging market. This includes applications in confectionery, dairy products, ready-to-eat meals, and beverages where direct consumer interaction with packaging is common.
Edible Packaging Market Product Developments
Product innovation in the Edible Packaging Market is rapidly expanding. Companies are developing novel edible films and coatings derived from sources like seaweed and plant-based starches, offering superior barrier properties against moisture and oxygen, thereby extending product shelf-life. Applications range from edible sachets for beverages and single-serving food items to edible coatings for fruits and vegetables, reducing food waste. The market is also seeing the development of edible straws and cutlery made from natural ingredients, directly addressing the plastic pollution crisis. These advancements are driven by a focus on functionality, safety, and consumer appeal, creating a competitive edge for early adopters.
Challenges in the Edible Packaging Market Market
Despite its immense potential, the Edible Packaging Market faces several challenges. Regulatory hurdles and the lack of standardized guidelines for edible packaging across different regions can slow down adoption. High production costs compared to conventional packaging remain a significant barrier for widespread commercialization. Ensuring adequate shelf-life and barrier properties for a diverse range of products, especially those requiring protection against moisture and oxygen, is an ongoing R&D challenge. Supply chain complexities in sourcing and processing raw materials also need to be addressed. The current estimated market value for challenges is around xx Million.
Forces Driving Edible Packaging Market Growth
The Edible Packaging Market is propelled by a potent combination of forces. Escalating global environmental concerns and a growing consumer demand for sustainable alternatives are paramount. Stringent government regulations aimed at curbing plastic waste, such as bans on single-use plastics, directly favor edible packaging solutions. Technological advancements in material science are continuously enhancing the functionality, safety, and cost-effectiveness of edible packaging materials. The rising trend of conscious consumerism, where consumers prioritize brands with eco-friendly practices, further fuels this growth. The pharmaceutical industry's increasing interest in novel drug delivery systems and patient-friendly packaging also represents a significant growth avenue.
Challenges in the Edible Packaging Market Market
Long-term growth catalysts for the Edible Packaging Market lie in continuous innovation and strategic market expansion. Further research into developing edible packaging with enhanced barrier properties comparable to conventional plastics, especially for complex food products, will be crucial. Forging strategic partnerships between edible packaging manufacturers and major food, beverage, and pharmaceutical companies will accelerate adoption and scale production. Expanding into emerging economies with growing environmental awareness and evolving consumer preferences will unlock new market potential. Investments in robust and scalable manufacturing processes will be key to reducing costs and meeting increasing demand.
Emerging Opportunities in Edible Packaging Market
Emerging opportunities in the Edible Packaging Market are vast and varied. The development of edible packaging for niche applications, such as culinary films for gourmet food presentation or biodegradable nutrient encapsulation for agriculture, presents significant potential. Advancements in nanotechnology for edible coatings to improve shelf-life and introduce active packaging functionalities are on the horizon. The growing trend of personalized nutrition and the demand for convenient, healthy snack options create opportunities for single-serving edible packaging solutions. Furthermore, the exploration of novel, underutilized plant and animal by-products as raw materials for edible packaging can unlock cost-effective and sustainable solutions.
Leading Players in the Edible Packaging Market Sector
- Envigreen Biotech India Private Ltd
- Notpla Limited
- Evoware (PT Evogaia Karya Indonesia)
- Amtrex Nature Care Pvt Ltd
- Nagase America LLC (Nagase & Co Ltd )
- TSUKIOKA FILM PHARMA CO LTD
- ECOLOTEC LIMITED
- Devro PLC (Saria Nederland BV)
- Tipa Corp Ltd
- JRF Technology LLC
- Glanbia Plc
Key Milestones in Edible Packaging Market Industry
- 2020: Notpla Limited secures significant funding to scale its seaweed-based edible packaging solutions.
- 2021: Evoware (PT Evogaia Karya Indonesia) launches a new range of edible straws made from natural ingredients.
- 2022: Envigreen Biotech India Private Ltd introduces biodegradable and compostable packaging films derived from agricultural waste.
- 2023: Glanbia Plc announces research into edible protein-based packaging for sports nutrition products.
- 2024 (Q1): TSUKIOKA FILM PHARMA CO LTD patents a new edible film technology for pharmaceutical applications.
- 2024 (Q3): JRF Technology LLC announces a joint venture to develop advanced edible coatings for the food industry.
- 2025 (Base Year): Increased adoption of edible packaging in the food and beverage sector as regulatory pressures on plastics intensify.
Strategic Outlook for Edible Packaging Market Market
The strategic outlook for the Edible Packaging Market is exceptionally positive, driven by the imperative for sustainable solutions. Growth accelerators include further technological advancements in material science to enhance barrier properties and reduce costs, alongside strategic collaborations with major CPG companies to drive large-scale adoption. The expansion into new geographies with increasing environmental awareness and favorable regulatory landscapes will be pivotal. Focus on developing innovative applications across diverse end-user industries, beyond just food and beverages, such as pharmaceuticals and cosmetics, will unlock significant market potential. Continuous investment in research and development, coupled with a commitment to consumer safety and product efficacy, will solidify the market's long-term growth trajectory. The projected market value for 2033 is estimated at $5,200 Million.
Edible Packaging Market Segmentation
-
1. Source
- 1.1. Plant
- 1.2. Animal
-
2. Raw Material
- 2.1. Protein
- 2.2. Polysaccharides
- 2.3. Lipids
- 2.4. Other Raw Materials
-
3. End-User Industry
- 3.1. Food
- 3.2. Bevergae
- 3.3. Pharmaceutical
Edible Packaging Market Segmentation By Geography
-
1. North America
- 1.1. United States
- 1.2. Canada
- 1.3. Mexico
-
2. South America
- 2.1. Brazil
- 2.2. Argentina
- 2.3. Rest of South America
-
3. Europe
- 3.1. United Kingdom
- 3.2. Germany
- 3.3. France
- 3.4. Italy
- 3.5. Spain
- 3.6. Russia
- 3.7. Benelux
- 3.8. Nordics
- 3.9. Rest of Europe
-
4. Middle East & Africa
- 4.1. Turkey
- 4.2. Israel
- 4.3. GCC
- 4.4. North Africa
- 4.5. South Africa
- 4.6. Rest of Middle East & Africa
-
5. Asia Pacific
- 5.1. China
- 5.2. India
- 5.3. Japan
- 5.4. South Korea
- 5.5. ASEAN
- 5.6. Oceania
- 5.7. Rest of Asia Pacific
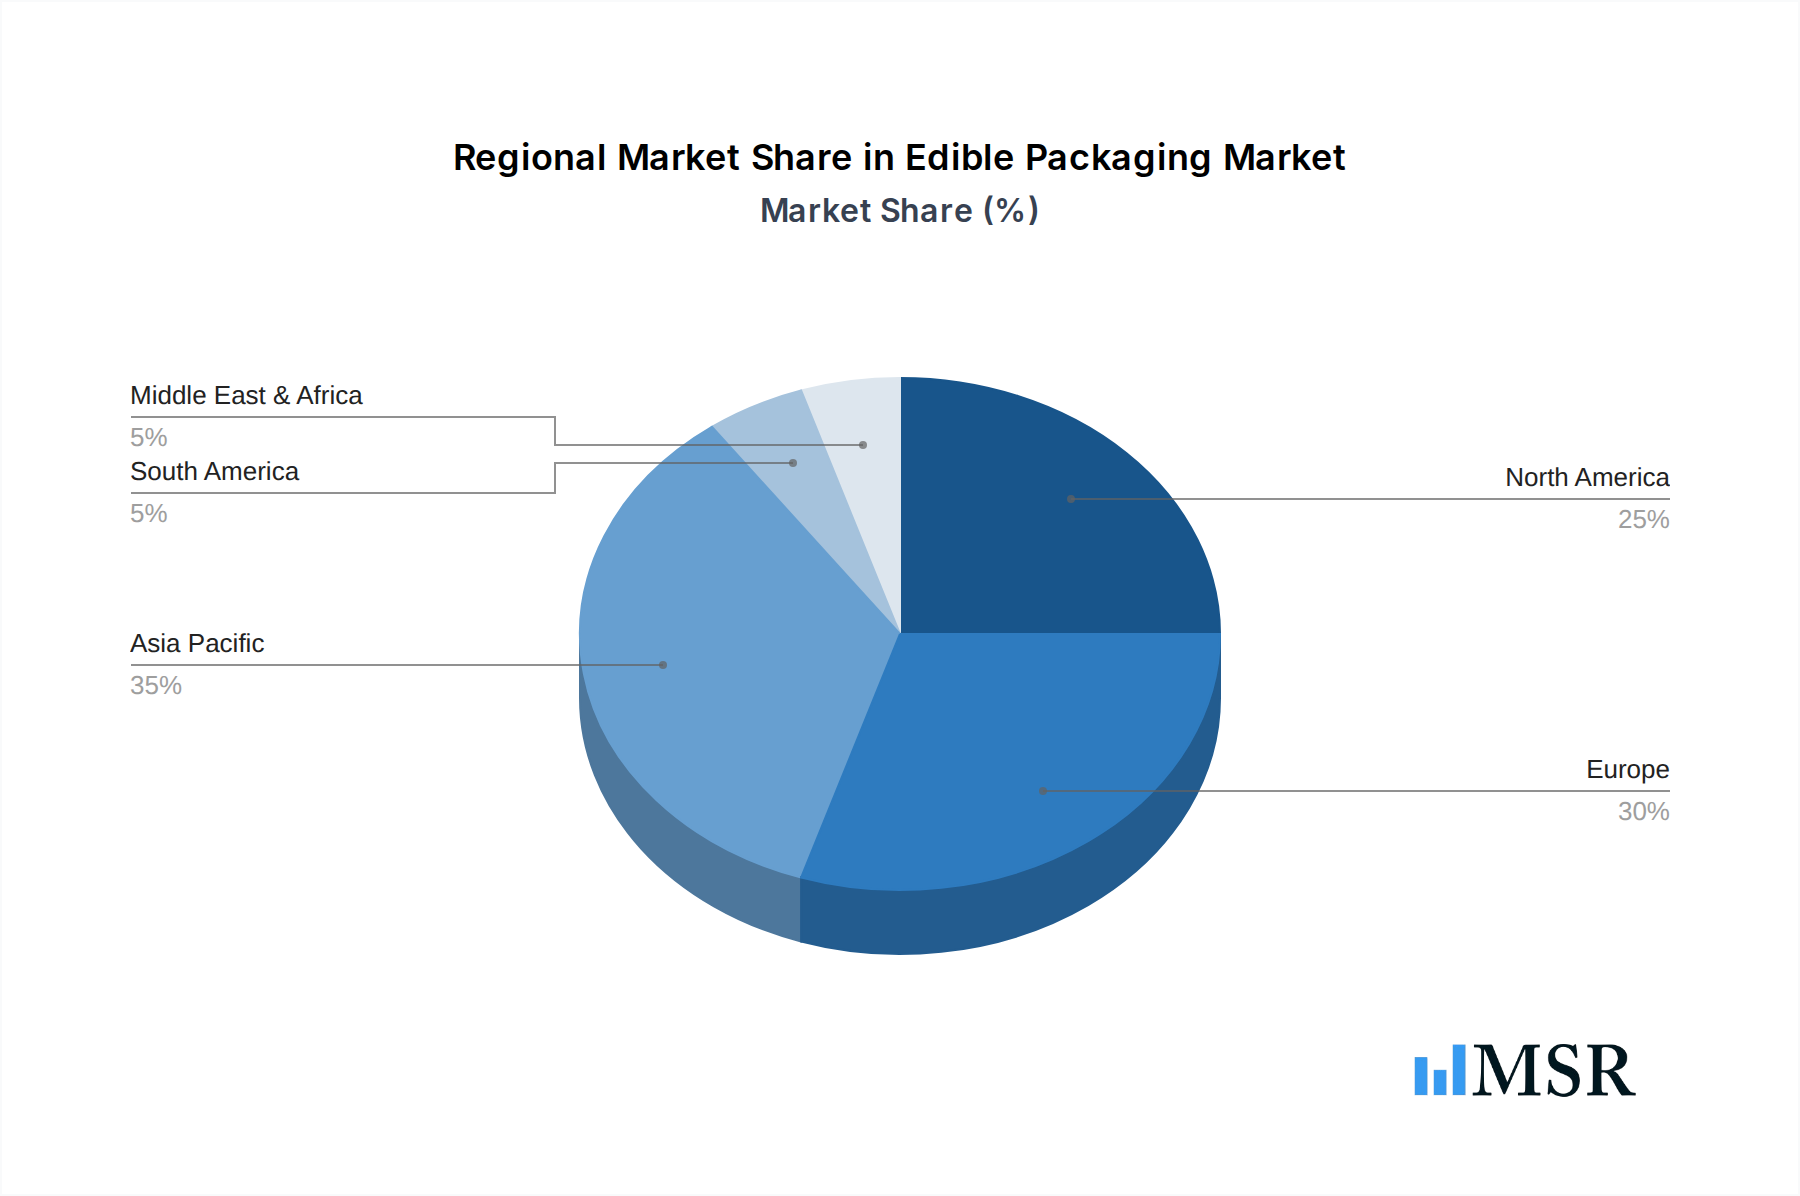
Edible Packaging Market Regional Market Share
Geographic Coverage of Edible Packaging Market
Edible Packaging Market REPORT HIGHLIGHTS
| Aspects | Details |
|---|---|
| Study Period | 2020-2034 |
| Base Year | 2025 |
| Estimated Year | 2026 |
| Forecast Period | 2026-2034 |
| Historical Period | 2020-2025 |
| Growth Rate | CAGR of 6.68% from 2020-2034 |
| Segmentation |
|
Table of Contents
- 1. Introduction
- 1.1. Research Scope
- 1.2. Market Segmentation
- 1.3. Research Objective
- 1.4. Definitions and Assumptions
- 2. Executive Summary
- 2.1. Market Snapshot
- 3. Market Dynamics
- 3.1. Market Drivers
- 3.2. Market Restrains
- 3.3. Market Trends
- 3.4. Market Opportunities
- 4. Market Factor Analysis
- 4.1. Porters Five Forces
- 4.1.1. Bargaining Power of Suppliers
- 4.1.2. Bargaining Power of Buyers
- 4.1.3. Threat of New Entrants
- 4.1.4. Threat of Substitutes
- 4.1.5. Competitive Rivalry
- 4.2. PESTEL analysis
- 4.3. BCG Analysis
- 4.3.1. Stars (High Growth, High Market Share)
- 4.3.2. Cash Cows (Low Growth, High Market Share)
- 4.3.3. Question Mark (High Growth, Low Market Share)
- 4.3.4. Dogs (Low Growth, Low Market Share)
- 4.4. Ansoff Matrix Analysis
- 4.5. Supply Chain Analysis
- 4.6. Regulatory Landscape
- 4.7. Current Market Potential and Opportunity Assessment (TAM–SAM–SOM Framework)
- 4.8. MSR Analyst Note
- 4.1. Porters Five Forces
- 5. Market Analysis, Insights and Forecast 2021-2033
- 5.1. Market Analysis, Insights and Forecast - by Source
- 5.1.1. Plant
- 5.1.2. Animal
- 5.2. Market Analysis, Insights and Forecast - by Raw Material
- 5.2.1. Protein
- 5.2.2. Polysaccharides
- 5.2.3. Lipids
- 5.2.4. Other Raw Materials
- 5.3. Market Analysis, Insights and Forecast - by End-User Industry
- 5.3.1. Food
- 5.3.2. Bevergae
- 5.3.3. Pharmaceutical
- 5.4. Market Analysis, Insights and Forecast - by Region
- 5.4.1. North America
- 5.4.2. South America
- 5.4.3. Europe
- 5.4.4. Middle East & Africa
- 5.4.5. Asia Pacific
- 5.1. Market Analysis, Insights and Forecast - by Source
- 6. Global Edible Packaging Market Analysis, Insights and Forecast, 2021-2033
- 6.1. Market Analysis, Insights and Forecast - by Source
- 6.1.1. Plant
- 6.1.2. Animal
- 6.2. Market Analysis, Insights and Forecast - by Raw Material
- 6.2.1. Protein
- 6.2.2. Polysaccharides
- 6.2.3. Lipids
- 6.2.4. Other Raw Materials
- 6.3. Market Analysis, Insights and Forecast - by End-User Industry
- 6.3.1. Food
- 6.3.2. Bevergae
- 6.3.3. Pharmaceutical
- 6.1. Market Analysis, Insights and Forecast - by Source
- 7. North America Edible Packaging Market Analysis, Insights and Forecast, 2020-2032
- 7.1. Market Analysis, Insights and Forecast - by Source
- 7.1.1. Plant
- 7.1.2. Animal
- 7.2. Market Analysis, Insights and Forecast - by Raw Material
- 7.2.1. Protein
- 7.2.2. Polysaccharides
- 7.2.3. Lipids
- 7.2.4. Other Raw Materials
- 7.3. Market Analysis, Insights and Forecast - by End-User Industry
- 7.3.1. Food
- 7.3.2. Bevergae
- 7.3.3. Pharmaceutical
- 7.1. Market Analysis, Insights and Forecast - by Source
- 8. South America Edible Packaging Market Analysis, Insights and Forecast, 2020-2032
- 8.1. Market Analysis, Insights and Forecast - by Source
- 8.1.1. Plant
- 8.1.2. Animal
- 8.2. Market Analysis, Insights and Forecast - by Raw Material
- 8.2.1. Protein
- 8.2.2. Polysaccharides
- 8.2.3. Lipids
- 8.2.4. Other Raw Materials
- 8.3. Market Analysis, Insights and Forecast - by End-User Industry
- 8.3.1. Food
- 8.3.2. Bevergae
- 8.3.3. Pharmaceutical
- 8.1. Market Analysis, Insights and Forecast - by Source
- 9. Europe Edible Packaging Market Analysis, Insights and Forecast, 2020-2032
- 9.1. Market Analysis, Insights and Forecast - by Source
- 9.1.1. Plant
- 9.1.2. Animal
- 9.2. Market Analysis, Insights and Forecast - by Raw Material
- 9.2.1. Protein
- 9.2.2. Polysaccharides
- 9.2.3. Lipids
- 9.2.4. Other Raw Materials
- 9.3. Market Analysis, Insights and Forecast - by End-User Industry
- 9.3.1. Food
- 9.3.2. Bevergae
- 9.3.3. Pharmaceutical
- 9.1. Market Analysis, Insights and Forecast - by Source
- 10. Middle East & Africa Edible Packaging Market Analysis, Insights and Forecast, 2020-2032
- 10.1. Market Analysis, Insights and Forecast - by Source
- 10.1.1. Plant
- 10.1.2. Animal
- 10.2. Market Analysis, Insights and Forecast - by Raw Material
- 10.2.1. Protein
- 10.2.2. Polysaccharides
- 10.2.3. Lipids
- 10.2.4. Other Raw Materials
- 10.3. Market Analysis, Insights and Forecast - by End-User Industry
- 10.3.1. Food
- 10.3.2. Bevergae
- 10.3.3. Pharmaceutical
- 10.1. Market Analysis, Insights and Forecast - by Source
- 11. Asia Pacific Edible Packaging Market Analysis, Insights and Forecast, 2020-2032
- 11.1. Market Analysis, Insights and Forecast - by Source
- 11.1.1. Plant
- 11.1.2. Animal
- 11.2. Market Analysis, Insights and Forecast - by Raw Material
- 11.2.1. Protein
- 11.2.2. Polysaccharides
- 11.2.3. Lipids
- 11.2.4. Other Raw Materials
- 11.3. Market Analysis, Insights and Forecast - by End-User Industry
- 11.3.1. Food
- 11.3.2. Bevergae
- 11.3.3. Pharmaceutical
- 11.1. Market Analysis, Insights and Forecast - by Source
- 12. Competitive Analysis
- 12.1. Company Profiles
- 12.1.1 Envigreen Biotech India Private Ltd
- 12.1.1.1. Company Overview
- 12.1.1.2. Products
- 12.1.1.3. Company Financials
- 12.1.1.4. SWOT Analysis
- 12.1.2 Notpla Limited
- 12.1.2.1. Company Overview
- 12.1.2.2. Products
- 12.1.2.3. Company Financials
- 12.1.2.4. SWOT Analysis
- 12.1.3 Evoware (PT Evogaia Karya Indonesia)
- 12.1.3.1. Company Overview
- 12.1.3.2. Products
- 12.1.3.3. Company Financials
- 12.1.3.4. SWOT Analysis
- 12.1.4 Amtrex Nature Care Pvt Ltd
- 12.1.4.1. Company Overview
- 12.1.4.2. Products
- 12.1.4.3. Company Financials
- 12.1.4.4. SWOT Analysis
- 12.1.5 Nagase America LLC (Nagase & Co Ltd )
- 12.1.5.1. Company Overview
- 12.1.5.2. Products
- 12.1.5.3. Company Financials
- 12.1.5.4. SWOT Analysis
- 12.1.6 TSUKIOKA FILM PHARMA CO LTD
- 12.1.6.1. Company Overview
- 12.1.6.2. Products
- 12.1.6.3. Company Financials
- 12.1.6.4. SWOT Analysis
- 12.1.7 ECOLOTEC LIMITED
- 12.1.7.1. Company Overview
- 12.1.7.2. Products
- 12.1.7.3. Company Financials
- 12.1.7.4. SWOT Analysis
- 12.1.8 Devro PLC (Saria Nederland BV)
- 12.1.8.1. Company Overview
- 12.1.8.2. Products
- 12.1.8.3. Company Financials
- 12.1.8.4. SWOT Analysis
- 12.1.9 Tipa Corp Ltd
- 12.1.9.1. Company Overview
- 12.1.9.2. Products
- 12.1.9.3. Company Financials
- 12.1.9.4. SWOT Analysis
- 12.1.10 JRF Technology LLC
- 12.1.10.1. Company Overview
- 12.1.10.2. Products
- 12.1.10.3. Company Financials
- 12.1.10.4. SWOT Analysis
- 12.1.11 Glanbia Plc
- 12.1.11.1. Company Overview
- 12.1.11.2. Products
- 12.1.11.3. Company Financials
- 12.1.11.4. SWOT Analysis
- 12.1.1 Envigreen Biotech India Private Ltd
- 12.2. Market Entropy
- 12.2.1 Company's Key Areas Served
- 12.2.2 Recent Developments
- 12.3. Company Market Share Analysis 2025
- 12.3.1 Top 5 Companies Market Share Analysis
- 12.3.2 Top 3 Companies Market Share Analysis
- 12.4. List of Potential Customers
- 13. Research Methodology
List of Figures
- Figure 1: Global Edible Packaging Market Revenue Breakdown (Million, %) by Region 2025 & 2033
- Figure 2: Global Edible Packaging Market Volume Breakdown (K Tons, %) by Region 2025 & 2033
- Figure 3: North America Edible Packaging Market Revenue (Million), by Source 2025 & 2033
- Figure 4: North America Edible Packaging Market Volume (K Tons), by Source 2025 & 2033
- Figure 5: North America Edible Packaging Market Revenue Share (%), by Source 2025 & 2033
- Figure 6: North America Edible Packaging Market Volume Share (%), by Source 2025 & 2033
- Figure 7: North America Edible Packaging Market Revenue (Million), by Raw Material 2025 & 2033
- Figure 8: North America Edible Packaging Market Volume (K Tons), by Raw Material 2025 & 2033
- Figure 9: North America Edible Packaging Market Revenue Share (%), by Raw Material 2025 & 2033
- Figure 10: North America Edible Packaging Market Volume Share (%), by Raw Material 2025 & 2033
- Figure 11: North America Edible Packaging Market Revenue (Million), by End-User Industry 2025 & 2033
- Figure 12: North America Edible Packaging Market Volume (K Tons), by End-User Industry 2025 & 2033
- Figure 13: North America Edible Packaging Market Revenue Share (%), by End-User Industry 2025 & 2033
- Figure 14: North America Edible Packaging Market Volume Share (%), by End-User Industry 2025 & 2033
- Figure 15: North America Edible Packaging Market Revenue (Million), by Country 2025 & 2033
- Figure 16: North America Edible Packaging Market Volume (K Tons), by Country 2025 & 2033
- Figure 17: North America Edible Packaging Market Revenue Share (%), by Country 2025 & 2033
- Figure 18: North America Edible Packaging Market Volume Share (%), by Country 2025 & 2033
- Figure 19: South America Edible Packaging Market Revenue (Million), by Source 2025 & 2033
- Figure 20: South America Edible Packaging Market Volume (K Tons), by Source 2025 & 2033
- Figure 21: South America Edible Packaging Market Revenue Share (%), by Source 2025 & 2033
- Figure 22: South America Edible Packaging Market Volume Share (%), by Source 2025 & 2033
- Figure 23: South America Edible Packaging Market Revenue (Million), by Raw Material 2025 & 2033
- Figure 24: South America Edible Packaging Market Volume (K Tons), by Raw Material 2025 & 2033
- Figure 25: South America Edible Packaging Market Revenue Share (%), by Raw Material 2025 & 2033
- Figure 26: South America Edible Packaging Market Volume Share (%), by Raw Material 2025 & 2033
- Figure 27: South America Edible Packaging Market Revenue (Million), by End-User Industry 2025 & 2033
- Figure 28: South America Edible Packaging Market Volume (K Tons), by End-User Industry 2025 & 2033
- Figure 29: South America Edible Packaging Market Revenue Share (%), by End-User Industry 2025 & 2033
- Figure 30: South America Edible Packaging Market Volume Share (%), by End-User Industry 2025 & 2033
- Figure 31: South America Edible Packaging Market Revenue (Million), by Country 2025 & 2033
- Figure 32: South America Edible Packaging Market Volume (K Tons), by Country 2025 & 2033
- Figure 33: South America Edible Packaging Market Revenue Share (%), by Country 2025 & 2033
- Figure 34: South America Edible Packaging Market Volume Share (%), by Country 2025 & 2033
- Figure 35: Europe Edible Packaging Market Revenue (Million), by Source 2025 & 2033
- Figure 36: Europe Edible Packaging Market Volume (K Tons), by Source 2025 & 2033
- Figure 37: Europe Edible Packaging Market Revenue Share (%), by Source 2025 & 2033
- Figure 38: Europe Edible Packaging Market Volume Share (%), by Source 2025 & 2033
- Figure 39: Europe Edible Packaging Market Revenue (Million), by Raw Material 2025 & 2033
- Figure 40: Europe Edible Packaging Market Volume (K Tons), by Raw Material 2025 & 2033
- Figure 41: Europe Edible Packaging Market Revenue Share (%), by Raw Material 2025 & 2033
- Figure 42: Europe Edible Packaging Market Volume Share (%), by Raw Material 2025 & 2033
- Figure 43: Europe Edible Packaging Market Revenue (Million), by End-User Industry 2025 & 2033
- Figure 44: Europe Edible Packaging Market Volume (K Tons), by End-User Industry 2025 & 2033
- Figure 45: Europe Edible Packaging Market Revenue Share (%), by End-User Industry 2025 & 2033
- Figure 46: Europe Edible Packaging Market Volume Share (%), by End-User Industry 2025 & 2033
- Figure 47: Europe Edible Packaging Market Revenue (Million), by Country 2025 & 2033
- Figure 48: Europe Edible Packaging Market Volume (K Tons), by Country 2025 & 2033
- Figure 49: Europe Edible Packaging Market Revenue Share (%), by Country 2025 & 2033
- Figure 50: Europe Edible Packaging Market Volume Share (%), by Country 2025 & 2033
- Figure 51: Middle East & Africa Edible Packaging Market Revenue (Million), by Source 2025 & 2033
- Figure 52: Middle East & Africa Edible Packaging Market Volume (K Tons), by Source 2025 & 2033
- Figure 53: Middle East & Africa Edible Packaging Market Revenue Share (%), by Source 2025 & 2033
- Figure 54: Middle East & Africa Edible Packaging Market Volume Share (%), by Source 2025 & 2033
- Figure 55: Middle East & Africa Edible Packaging Market Revenue (Million), by Raw Material 2025 & 2033
- Figure 56: Middle East & Africa Edible Packaging Market Volume (K Tons), by Raw Material 2025 & 2033
- Figure 57: Middle East & Africa Edible Packaging Market Revenue Share (%), by Raw Material 2025 & 2033
- Figure 58: Middle East & Africa Edible Packaging Market Volume Share (%), by Raw Material 2025 & 2033
- Figure 59: Middle East & Africa Edible Packaging Market Revenue (Million), by End-User Industry 2025 & 2033
- Figure 60: Middle East & Africa Edible Packaging Market Volume (K Tons), by End-User Industry 2025 & 2033
- Figure 61: Middle East & Africa Edible Packaging Market Revenue Share (%), by End-User Industry 2025 & 2033
- Figure 62: Middle East & Africa Edible Packaging Market Volume Share (%), by End-User Industry 2025 & 2033
- Figure 63: Middle East & Africa Edible Packaging Market Revenue (Million), by Country 2025 & 2033
- Figure 64: Middle East & Africa Edible Packaging Market Volume (K Tons), by Country 2025 & 2033
- Figure 65: Middle East & Africa Edible Packaging Market Revenue Share (%), by Country 2025 & 2033
- Figure 66: Middle East & Africa Edible Packaging Market Volume Share (%), by Country 2025 & 2033
- Figure 67: Asia Pacific Edible Packaging Market Revenue (Million), by Source 2025 & 2033
- Figure 68: Asia Pacific Edible Packaging Market Volume (K Tons), by Source 2025 & 2033
- Figure 69: Asia Pacific Edible Packaging Market Revenue Share (%), by Source 2025 & 2033
- Figure 70: Asia Pacific Edible Packaging Market Volume Share (%), by Source 2025 & 2033
- Figure 71: Asia Pacific Edible Packaging Market Revenue (Million), by Raw Material 2025 & 2033
- Figure 72: Asia Pacific Edible Packaging Market Volume (K Tons), by Raw Material 2025 & 2033
- Figure 73: Asia Pacific Edible Packaging Market Revenue Share (%), by Raw Material 2025 & 2033
- Figure 74: Asia Pacific Edible Packaging Market Volume Share (%), by Raw Material 2025 & 2033
- Figure 75: Asia Pacific Edible Packaging Market Revenue (Million), by End-User Industry 2025 & 2033
- Figure 76: Asia Pacific Edible Packaging Market Volume (K Tons), by End-User Industry 2025 & 2033
- Figure 77: Asia Pacific Edible Packaging Market Revenue Share (%), by End-User Industry 2025 & 2033
- Figure 78: Asia Pacific Edible Packaging Market Volume Share (%), by End-User Industry 2025 & 2033
- Figure 79: Asia Pacific Edible Packaging Market Revenue (Million), by Country 2025 & 2033
- Figure 80: Asia Pacific Edible Packaging Market Volume (K Tons), by Country 2025 & 2033
- Figure 81: Asia Pacific Edible Packaging Market Revenue Share (%), by Country 2025 & 2033
- Figure 82: Asia Pacific Edible Packaging Market Volume Share (%), by Country 2025 & 2033
List of Tables
- Table 1: Global Edible Packaging Market Revenue Million Forecast, by Source 2020 & 2033
- Table 2: Global Edible Packaging Market Volume K Tons Forecast, by Source 2020 & 2033
- Table 3: Global Edible Packaging Market Revenue Million Forecast, by Raw Material 2020 & 2033
- Table 4: Global Edible Packaging Market Volume K Tons Forecast, by Raw Material 2020 & 2033
- Table 5: Global Edible Packaging Market Revenue Million Forecast, by End-User Industry 2020 & 2033
- Table 6: Global Edible Packaging Market Volume K Tons Forecast, by End-User Industry 2020 & 2033
- Table 7: Global Edible Packaging Market Revenue Million Forecast, by Region 2020 & 2033
- Table 8: Global Edible Packaging Market Volume K Tons Forecast, by Region 2020 & 2033
- Table 9: Global Edible Packaging Market Revenue Million Forecast, by Source 2020 & 2033
- Table 10: Global Edible Packaging Market Volume K Tons Forecast, by Source 2020 & 2033
- Table 11: Global Edible Packaging Market Revenue Million Forecast, by Raw Material 2020 & 2033
- Table 12: Global Edible Packaging Market Volume K Tons Forecast, by Raw Material 2020 & 2033
- Table 13: Global Edible Packaging Market Revenue Million Forecast, by End-User Industry 2020 & 2033
- Table 14: Global Edible Packaging Market Volume K Tons Forecast, by End-User Industry 2020 & 2033
- Table 15: Global Edible Packaging Market Revenue Million Forecast, by Country 2020 & 2033
- Table 16: Global Edible Packaging Market Volume K Tons Forecast, by Country 2020 & 2033
- Table 17: United States Edible Packaging Market Revenue (Million) Forecast, by Application 2020 & 2033
- Table 18: United States Edible Packaging Market Volume (K Tons) Forecast, by Application 2020 & 2033
- Table 19: Canada Edible Packaging Market Revenue (Million) Forecast, by Application 2020 & 2033
- Table 20: Canada Edible Packaging Market Volume (K Tons) Forecast, by Application 2020 & 2033
- Table 21: Mexico Edible Packaging Market Revenue (Million) Forecast, by Application 2020 & 2033
- Table 22: Mexico Edible Packaging Market Volume (K Tons) Forecast, by Application 2020 & 2033
- Table 23: Global Edible Packaging Market Revenue Million Forecast, by Source 2020 & 2033
- Table 24: Global Edible Packaging Market Volume K Tons Forecast, by Source 2020 & 2033
- Table 25: Global Edible Packaging Market Revenue Million Forecast, by Raw Material 2020 & 2033
- Table 26: Global Edible Packaging Market Volume K Tons Forecast, by Raw Material 2020 & 2033
- Table 27: Global Edible Packaging Market Revenue Million Forecast, by End-User Industry 2020 & 2033
- Table 28: Global Edible Packaging Market Volume K Tons Forecast, by End-User Industry 2020 & 2033
- Table 29: Global Edible Packaging Market Revenue Million Forecast, by Country 2020 & 2033
- Table 30: Global Edible Packaging Market Volume K Tons Forecast, by Country 2020 & 2033
- Table 31: Brazil Edible Packaging Market Revenue (Million) Forecast, by Application 2020 & 2033
- Table 32: Brazil Edible Packaging Market Volume (K Tons) Forecast, by Application 2020 & 2033
- Table 33: Argentina Edible Packaging Market Revenue (Million) Forecast, by Application 2020 & 2033
- Table 34: Argentina Edible Packaging Market Volume (K Tons) Forecast, by Application 2020 & 2033
- Table 35: Rest of South America Edible Packaging Market Revenue (Million) Forecast, by Application 2020 & 2033
- Table 36: Rest of South America Edible Packaging Market Volume (K Tons) Forecast, by Application 2020 & 2033
- Table 37: Global Edible Packaging Market Revenue Million Forecast, by Source 2020 & 2033
- Table 38: Global Edible Packaging Market Volume K Tons Forecast, by Source 2020 & 2033
- Table 39: Global Edible Packaging Market Revenue Million Forecast, by Raw Material 2020 & 2033
- Table 40: Global Edible Packaging Market Volume K Tons Forecast, by Raw Material 2020 & 2033
- Table 41: Global Edible Packaging Market Revenue Million Forecast, by End-User Industry 2020 & 2033
- Table 42: Global Edible Packaging Market Volume K Tons Forecast, by End-User Industry 2020 & 2033
- Table 43: Global Edible Packaging Market Revenue Million Forecast, by Country 2020 & 2033
- Table 44: Global Edible Packaging Market Volume K Tons Forecast, by Country 2020 & 2033
- Table 45: United Kingdom Edible Packaging Market Revenue (Million) Forecast, by Application 2020 & 2033
- Table 46: United Kingdom Edible Packaging Market Volume (K Tons) Forecast, by Application 2020 & 2033
- Table 47: Germany Edible Packaging Market Revenue (Million) Forecast, by Application 2020 & 2033
- Table 48: Germany Edible Packaging Market Volume (K Tons) Forecast, by Application 2020 & 2033
- Table 49: France Edible Packaging Market Revenue (Million) Forecast, by Application 2020 & 2033
- Table 50: France Edible Packaging Market Volume (K Tons) Forecast, by Application 2020 & 2033
- Table 51: Italy Edible Packaging Market Revenue (Million) Forecast, by Application 2020 & 2033
- Table 52: Italy Edible Packaging Market Volume (K Tons) Forecast, by Application 2020 & 2033
- Table 53: Spain Edible Packaging Market Revenue (Million) Forecast, by Application 2020 & 2033
- Table 54: Spain Edible Packaging Market Volume (K Tons) Forecast, by Application 2020 & 2033
- Table 55: Russia Edible Packaging Market Revenue (Million) Forecast, by Application 2020 & 2033
- Table 56: Russia Edible Packaging Market Volume (K Tons) Forecast, by Application 2020 & 2033
- Table 57: Benelux Edible Packaging Market Revenue (Million) Forecast, by Application 2020 & 2033
- Table 58: Benelux Edible Packaging Market Volume (K Tons) Forecast, by Application 2020 & 2033
- Table 59: Nordics Edible Packaging Market Revenue (Million) Forecast, by Application 2020 & 2033
- Table 60: Nordics Edible Packaging Market Volume (K Tons) Forecast, by Application 2020 & 2033
- Table 61: Rest of Europe Edible Packaging Market Revenue (Million) Forecast, by Application 2020 & 2033
- Table 62: Rest of Europe Edible Packaging Market Volume (K Tons) Forecast, by Application 2020 & 2033
- Table 63: Global Edible Packaging Market Revenue Million Forecast, by Source 2020 & 2033
- Table 64: Global Edible Packaging Market Volume K Tons Forecast, by Source 2020 & 2033
- Table 65: Global Edible Packaging Market Revenue Million Forecast, by Raw Material 2020 & 2033
- Table 66: Global Edible Packaging Market Volume K Tons Forecast, by Raw Material 2020 & 2033
- Table 67: Global Edible Packaging Market Revenue Million Forecast, by End-User Industry 2020 & 2033
- Table 68: Global Edible Packaging Market Volume K Tons Forecast, by End-User Industry 2020 & 2033
- Table 69: Global Edible Packaging Market Revenue Million Forecast, by Country 2020 & 2033
- Table 70: Global Edible Packaging Market Volume K Tons Forecast, by Country 2020 & 2033
- Table 71: Turkey Edible Packaging Market Revenue (Million) Forecast, by Application 2020 & 2033
- Table 72: Turkey Edible Packaging Market Volume (K Tons) Forecast, by Application 2020 & 2033
- Table 73: Israel Edible Packaging Market Revenue (Million) Forecast, by Application 2020 & 2033
- Table 74: Israel Edible Packaging Market Volume (K Tons) Forecast, by Application 2020 & 2033
- Table 75: GCC Edible Packaging Market Revenue (Million) Forecast, by Application 2020 & 2033
- Table 76: GCC Edible Packaging Market Volume (K Tons) Forecast, by Application 2020 & 2033
- Table 77: North Africa Edible Packaging Market Revenue (Million) Forecast, by Application 2020 & 2033
- Table 78: North Africa Edible Packaging Market Volume (K Tons) Forecast, by Application 2020 & 2033
- Table 79: South Africa Edible Packaging Market Revenue (Million) Forecast, by Application 2020 & 2033
- Table 80: South Africa Edible Packaging Market Volume (K Tons) Forecast, by Application 2020 & 2033
- Table 81: Rest of Middle East & Africa Edible Packaging Market Revenue (Million) Forecast, by Application 2020 & 2033
- Table 82: Rest of Middle East & Africa Edible Packaging Market Volume (K Tons) Forecast, by Application 2020 & 2033
- Table 83: Global Edible Packaging Market Revenue Million Forecast, by Source 2020 & 2033
- Table 84: Global Edible Packaging Market Volume K Tons Forecast, by Source 2020 & 2033
- Table 85: Global Edible Packaging Market Revenue Million Forecast, by Raw Material 2020 & 2033
- Table 86: Global Edible Packaging Market Volume K Tons Forecast, by Raw Material 2020 & 2033
- Table 87: Global Edible Packaging Market Revenue Million Forecast, by End-User Industry 2020 & 2033
- Table 88: Global Edible Packaging Market Volume K Tons Forecast, by End-User Industry 2020 & 2033
- Table 89: Global Edible Packaging Market Revenue Million Forecast, by Country 2020 & 2033
- Table 90: Global Edible Packaging Market Volume K Tons Forecast, by Country 2020 & 2033
- Table 91: China Edible Packaging Market Revenue (Million) Forecast, by Application 2020 & 2033
- Table 92: China Edible Packaging Market Volume (K Tons) Forecast, by Application 2020 & 2033
- Table 93: India Edible Packaging Market Revenue (Million) Forecast, by Application 2020 & 2033
- Table 94: India Edible Packaging Market Volume (K Tons) Forecast, by Application 2020 & 2033
- Table 95: Japan Edible Packaging Market Revenue (Million) Forecast, by Application 2020 & 2033
- Table 96: Japan Edible Packaging Market Volume (K Tons) Forecast, by Application 2020 & 2033
- Table 97: South Korea Edible Packaging Market Revenue (Million) Forecast, by Application 2020 & 2033
- Table 98: South Korea Edible Packaging Market Volume (K Tons) Forecast, by Application 2020 & 2033
- Table 99: ASEAN Edible Packaging Market Revenue (Million) Forecast, by Application 2020 & 2033
- Table 100: ASEAN Edible Packaging Market Volume (K Tons) Forecast, by Application 2020 & 2033
- Table 101: Oceania Edible Packaging Market Revenue (Million) Forecast, by Application 2020 & 2033
- Table 102: Oceania Edible Packaging Market Volume (K Tons) Forecast, by Application 2020 & 2033
- Table 103: Rest of Asia Pacific Edible Packaging Market Revenue (Million) Forecast, by Application 2020 & 2033
- Table 104: Rest of Asia Pacific Edible Packaging Market Volume (K Tons) Forecast, by Application 2020 & 2033
Frequently Asked Questions
1. What is the projected Compound Annual Growth Rate (CAGR) of the Edible Packaging Market?
The projected CAGR is approximately 6.68%.
2. Which companies are prominent players in the Edible Packaging Market?
Key companies in the market include Envigreen Biotech India Private Ltd, Notpla Limited, Evoware (PT Evogaia Karya Indonesia), Amtrex Nature Care Pvt Ltd, Nagase America LLC (Nagase & Co Ltd ), TSUKIOKA FILM PHARMA CO LTD, ECOLOTEC LIMITED, Devro PLC (Saria Nederland BV), Tipa Corp Ltd, JRF Technology LLC, Glanbia Plc.
3. What are the main segments of the Edible Packaging Market?
The market segments include Source, Raw Material, End-User Industry.
4. Can you provide details about the market size?
The market size is estimated to be USD 1.04 Million as of 2022.
5. What are some drivers contributing to market growth?
Need to Eliminate Type Waste Cycle and Increase Shelf-Life of the Product; Ban on Single-Use-Plastic and Growing Sustainability Concern.
6. What are the notable trends driving market growth?
The Increasing Demand for Sustainable Solutions and the Need for Extended Product Shelf-Life are helping drive market growth.
7. Are there any restraints impacting market growth?
High Cost of Production.
8. Can you provide examples of recent developments in the market?
N/A
9. What pricing options are available for accessing the report?
Pricing options include single-user, multi-user, and enterprise licenses priced at USD 4750, USD 5250, and USD 8750 respectively.
10. Is the market size provided in terms of value or volume?
The market size is provided in terms of value, measured in Million and volume, measured in K Tons.
11. Are there any specific market keywords associated with the report?
Yes, the market keyword associated with the report is "Edible Packaging Market," which aids in identifying and referencing the specific market segment covered.
12. How do I determine which pricing option suits my needs best?
The pricing options vary based on user requirements and access needs. Individual users may opt for single-user licenses, while businesses requiring broader access may choose multi-user or enterprise licenses for cost-effective access to the report.
13. Are there any additional resources or data provided in the Edible Packaging Market report?
While the report offers comprehensive insights, it's advisable to review the specific contents or supplementary materials provided to ascertain if additional resources or data are available.
14. How can I stay updated on further developments or reports in the Edible Packaging Market?
To stay informed about further developments, trends, and reports in the Edible Packaging Market, consider subscribing to industry newsletters, following relevant companies and organizations, or regularly checking reputable industry news sources and publications.
Methodology
Step 1 - Identification of Relevant Samples Size from Population Database


Step 2 - Approaches for Defining Global Market Size (Value, Volume* & Price*)

Note*: In applicable scenarios
Step 3 - Data Sources
Primary Research
- Web Analytics
- Survey Reports
- Research Institute
- Latest Research Reports
- Opinion Leaders
Secondary Research
- Annual Reports
- White Paper
- Latest Press Release
- Industry Association
- Paid Database
- Investor Presentations

Step 4 - Data Triangulation
Involves using different sources of information in order to increase the validity of a study
These sources are likely to be stakeholders in a program - participants, other researchers, program staff, other community members, and so on.
Then we put all data in single framework & apply various statistical tools to find out the dynamic on the market.
During the analysis stage, feedback from the stakeholder groups would be compared to determine areas of agreement as well as areas of divergence