

Key Insights
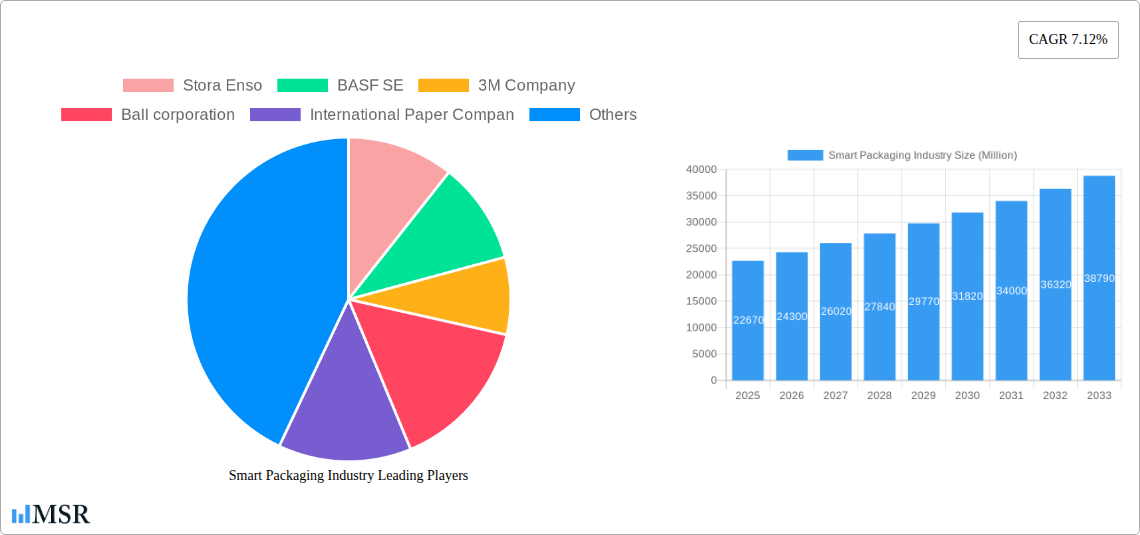
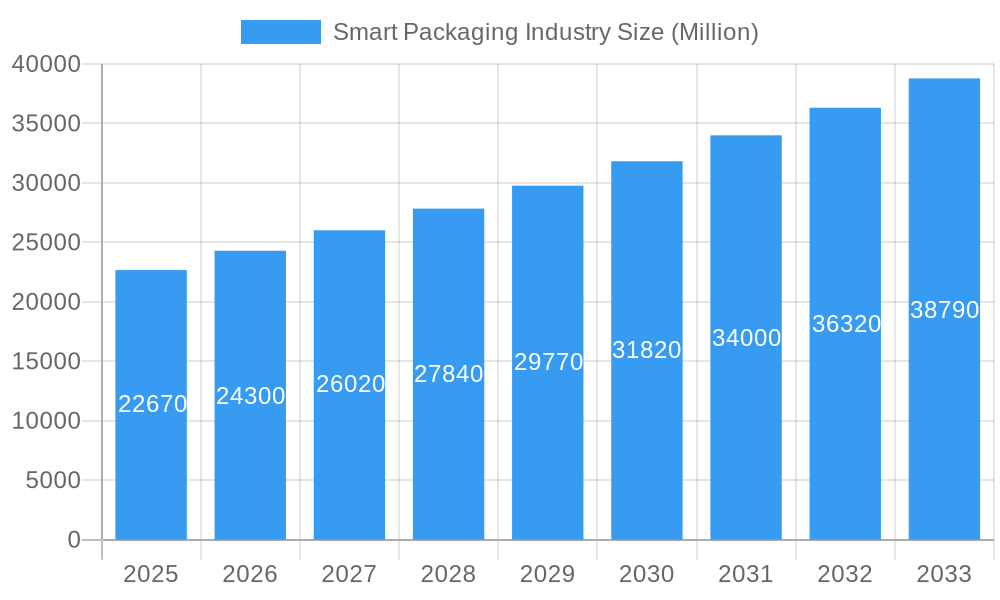
The global smart packaging market is poised for robust expansion, projected to reach a significant valuation of approximately $22.67 billion by 2025. This growth is underpinned by a healthy Compound Annual Growth Rate (CAGR) of 7.12% between 2019 and 2033, indicating sustained momentum in the industry. Key drivers fueling this upward trajectory include the increasing demand for enhanced food safety and traceability, a growing consumer preference for sustainable packaging solutions, and the integration of advanced technologies like the Internet of Things (IoT) and artificial intelligence. The evolution of active packaging, which actively interacts with the product to extend shelf life or improve quality, and intelligent packaging, offering real-time monitoring and communication capabilities, are central to this market's dynamism. These advancements are particularly critical in high-value sectors such as food and beverages, where product integrity and consumer trust are paramount, and in healthcare, where the safe delivery and monitoring of sensitive pharmaceuticals are essential.
Smart Packaging Industry Market Size (In Billion)
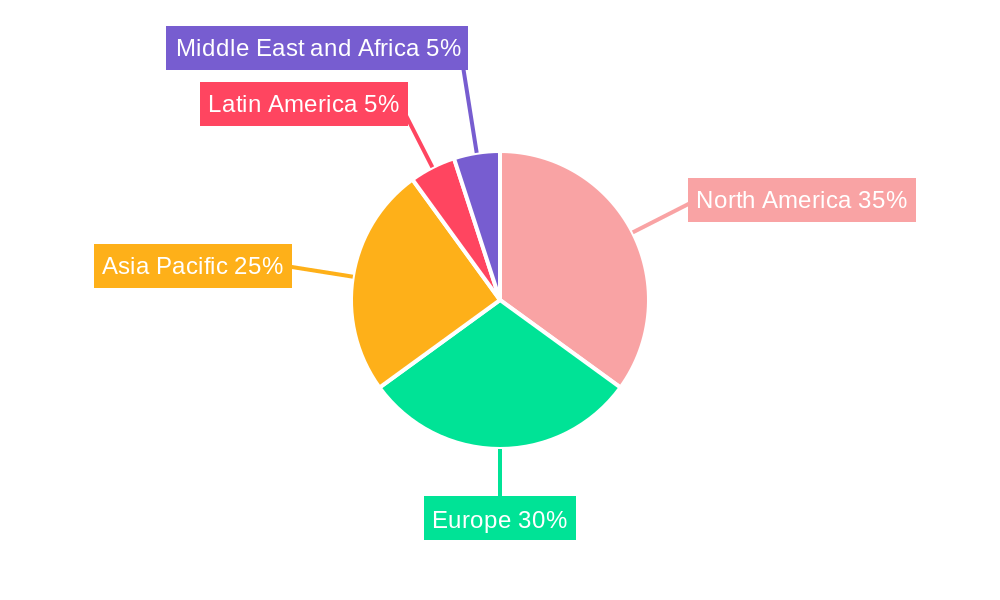
The market's growth is further propelled by emerging trends such as the adoption of printed electronics for embedded functionalities, the rise of connected packaging enabling direct consumer engagement and supply chain visibility, and the increasing focus on recyclability and biodegradability within the smart packaging ecosystem. While the market presents substantial opportunities, certain restraints may influence its pace. These include the relatively higher initial cost of implementing smart packaging technologies compared to traditional alternatives, the complexity of integrating these systems into existing supply chains, and the need for standardized protocols and regulatory frameworks. Nonetheless, the overwhelming benefits in terms of waste reduction, enhanced product appeal, and improved consumer experience are expected to outweigh these challenges. Geographically, North America and Europe are anticipated to lead the market, driven by advanced technological infrastructure and stringent regulations favoring product safety. The Asia Pacific region, however, is emerging as a significant growth engine due to rapid industrialization and a burgeoning middle class with increasing purchasing power and demand for premium packaged goods.
Smart Packaging Industry Company Market Share
Unlock unparalleled insights into the smart packaging market, a rapidly evolving sector projected to reach USD xx Million by 2033. This comprehensive report, covering the historical period 2019–2024 and forecast period 2025–2033, delves into the core of active packaging and intelligent packaging technologies. Discover how innovations in food packaging, beverage packaging, healthcare packaging, and personal care packaging are reshaping global supply chains and consumer engagement. Essential for packaging manufacturers, technology providers, brand owners, and supply chain professionals seeking to capitalize on this USD xx Million market, this analysis provides data-driven strategies and actionable intelligence.
Smart Packaging Industry Market Concentration & Dynamics
The smart packaging industry exhibits a moderately concentrated market landscape, with a blend of established multinational corporations and agile emerging players. Key innovators like Stora Enso, BASF SE, 3M Company, Ball Corporation, International Paper Company, Amcor PLC, Avery Dennison Corporation, Huhtamaki OYJ, Zebra Technologies Corporation, and Sealed Air Corporation dominate market share through extensive R&D investment and strategic partnerships. The innovation ecosystem is fueled by a growing demand for sustainable, traceable, and interactive packaging solutions. Regulatory frameworks are progressively favoring the adoption of smart technologies to enhance product safety, reduce waste, and improve consumer information. While traditional packaging materials remain substitutes, their limitations in providing real-time data and enhanced functionality are increasingly apparent. End-user trends are strongly influenced by consumer desire for authenticity, convenience, and transparency, driving the adoption of smart features. Mergers and acquisitions (M&A) activities are on the rise as companies seek to consolidate market positions, acquire cutting-edge technologies, and expand their global reach. M&A deal counts are projected to increase by xx% over the forecast period, signifying robust consolidation.
Smart Packaging Industry Industry Insights & Trends
The smart packaging industry is poised for extraordinary growth, driven by a confluence of technological advancements, evolving consumer expectations, and increasing regulatory pressures. The global market size was valued at approximately USD xx Million in 2025, and it is projected to expand at a robust Compound Annual Growth Rate (CAGR) of xx% from 2025 to 2033. This expansion is fundamentally fueled by the escalating demand for enhanced product safety, extended shelf life, and improved traceability across various end-user verticals, including food, beverage, healthcare, and personal care. Technological disruptions are at the forefront of this growth, with advancements in active packaging – which actively interacts with the product or its environment to extend shelf life or improve condition – and intelligent packaging – which communicates information about the product's history, status, or authenticity. The integration of IoT, AI, and advanced sensor technologies is enabling sophisticated functionalities such as real-time temperature monitoring, authentication, and consumer engagement through QR codes and NFC tags. Evolving consumer behaviors, characterized by a greater emphasis on sustainability, health consciousness, and digital interaction, are compelling brands to adopt smart packaging solutions that offer greater transparency, convenience, and personalized experiences. For instance, the ability of smart packaging to provide detailed product provenance information aligns with growing consumer demand for ethically sourced and sustainably produced goods. Furthermore, the increasing prevalence of e-commerce and direct-to-consumer models necessitates packaging that can withstand transit stresses, provide tamper evidence, and offer a superior unboxing experience, all of which are enhanced by smart features. The growing concern over counterfeit products, particularly in the pharmaceutical and luxury goods sectors, is also a significant driver for the adoption of authentication and anti-counterfeiting technologies embedded in smart packaging. As supply chains become more complex and globalized, the need for end-to-end visibility and control, facilitated by smart packaging, will only intensify.
Key Markets & Segments Leading Smart Packaging Industry
The smart packaging industry is witnessing significant growth across various regions and segments, with particular dominance observed in North America and Europe, driven by advanced technological infrastructure and high consumer adoption rates of innovative products.
Dominant Regions:
- North America: Leading the market due to substantial investments in R&D, a mature e-commerce landscape, and strong consumer demand for convenience and safety in food and healthcare packaging. Key countries like the United States and Canada are at the forefront of adopting intelligent packaging solutions.
- Europe: A strong second, propelled by stringent regulations concerning food safety, waste reduction, and a growing emphasis on sustainable packaging practices. The region's advanced manufacturing capabilities and widespread adoption of RFID technology further bolster its market position.
Dominant Segments:
- Technology - Intelligent Packaging: This segment is experiencing exponential growth due to its ability to provide real-time data, enhance traceability, and facilitate consumer interaction. The development of QR codes, NFC tags, and RFID labels is revolutionizing supply chain visibility and brand engagement.
- Drivers: Increasing demand for supply chain transparency, rising concerns over product counterfeiting, and the growing adoption of IoT devices.
- End-user Vertical - Food: The largest and fastest-growing segment, driven by the need for extended shelf life, improved food safety, and enhanced consumer information regarding nutrition and origin. Active packaging solutions that reduce spoilage and waste are particularly in demand.
- Drivers: Growing global population, increasing demand for convenience foods, and stringent food safety regulations.
- End-user Vertical - Beverage: This segment benefits from innovations in spoilage detection, tamper evidence, and interactive branding. The rise of premium beverages and craft drinks is also driving demand for packaging that communicates quality and authenticity.
- Drivers: Expanding global beverage market, consumer preference for on-the-go consumption, and brand differentiation strategies.
- End-user Vertical - Healthcare: Crucial for ensuring the integrity and efficacy of pharmaceuticals and medical devices. Intelligent packaging plays a vital role in tracking temperature excursions, verifying authenticity, and improving patient compliance.
- Drivers: Increasing demand for counterfeit drug prevention, growing prevalence of chronic diseases, and stringent regulatory requirements for drug safety.
- End-user Vertical - Personal Care: This segment is seeing increased adoption of smart packaging for enhanced consumer engagement, product authenticity verification, and personalized product information through digital interfaces.
- Drivers: Growing beauty and wellness industry, demand for premium and personalized cosmetic products, and brand loyalty initiatives.
- Technology - Intelligent Packaging: This segment is experiencing exponential growth due to its ability to provide real-time data, enhance traceability, and facilitate consumer interaction. The development of QR codes, NFC tags, and RFID labels is revolutionizing supply chain visibility and brand engagement.
The synergistic interplay between these technologies and end-user verticals, supported by favorable economic growth and infrastructure development in key markets, is propelling the smart packaging industry forward.
Smart Packaging Industry Product Developments
Product innovation in the smart packaging industry is rapidly advancing, focusing on enhancing functionality and sustainability. Key developments include the integration of advanced sensors for real-time monitoring of temperature, humidity, and gas levels in active packaging, crucial for extending the shelf life of food and beverage products. Intelligent packaging is seeing innovations in printable electronics, NFC tags, and QR codes that offer seamless connectivity, enabling supply chain traceability, product authentication, and direct consumer engagement. For instance, the March 2023 joint research project between Amcor and Nfinite Nanotechnology Inc. aims to validate nanocoating technology for improved recyclability and compostability, showcasing a commitment to eco-friendly solutions. Avery Dennison's significant investment in expanding its RFID manufacturing capacity by over USD 100 Million highlights the growing importance of digital IDs for creating connected and transparent supply chains across multiple industries. These advancements not only provide competitive edges but also address critical industry needs for efficiency, safety, and consumer trust.
Challenges in the Smart Packaging Industry Market
Despite its promising trajectory, the smart packaging industry faces several significant challenges. The high initial cost of implementing smart technologies, including sensors, connectivity modules, and data management systems, poses a barrier for many small and medium-sized enterprises. Integrating these advanced solutions into existing manufacturing lines can also be complex and capital-intensive. Furthermore, the development and standardization of data protocols for interoperability across different smart packaging systems remain a challenge, hindering seamless data flow. Consumer awareness and education regarding the benefits and usage of smart packaging also need improvement to drive wider adoption. Supply chain disruptions and the fluctuating cost of raw materials for electronic components can impact production efficiency and profitability. Overcoming these hurdles is crucial for unlocking the full potential of this transformative industry.
Forces Driving Smart Packaging Industry Growth
The smart packaging industry is propelled by a potent mix of technological advancements, economic imperatives, and evolving regulatory landscapes. The increasing demand for food and beverage safety, coupled with stringent regulations aimed at reducing waste and ensuring product authenticity, provides a strong impetus for adoption. The proliferation of the Internet of Things (IoT) and advancements in sensor technology are making intelligent packaging solutions more accessible and cost-effective. Furthermore, growing consumer awareness and preference for sustainable and traceable products are compelling brands to invest in smart packaging that offers transparency and enhances brand loyalty. The expansion of e-commerce also necessitates packaging that ensures product integrity during transit and provides a superior unboxing experience, areas where smart packaging excels.
Challenges in the Smart Packaging Industry Market
Long-term growth catalysts for the smart packaging industry lie in continued innovation and strategic market expansion. The development of more cost-effective, biodegradable, and energy-efficient smart components will be crucial for broader market penetration, especially in price-sensitive segments. Partnerships between packaging manufacturers, technology providers, and end-user industries are vital for co-creating bespoke solutions and fostering wider adoption. Moreover, expanding smart packaging applications into emerging end-user verticals beyond the traditional food, beverage, healthcare, and personal care sectors, such as logistics and industrial goods, presents significant growth potential. Focus on circular economy principles and the development of smart packaging that supports recycling and reuse will also drive sustainable long-term growth.
Emerging Opportunities in Smart Packaging Industry
Emerging opportunities in the smart packaging industry are abundant, driven by innovation and changing consumer preferences. The rise of personalized medicine and tailored nutrition creates a significant demand for smart packaging that can deliver specific dosages or personalized health information. The burgeoning market for smart home devices also opens avenues for packaging that can interact with these systems, providing usage instructions or reorder prompts. Furthermore, the growing focus on reducing food waste presents an opportunity for advanced spoilage indication technologies embedded in packaging. The development of self-healing or self-cleaning packaging materials, though nascent, represents a futuristic frontier with immense potential. Exploring these new markets and consumer preferences will be key to capturing future growth.
Leading Players in the Smart Packaging Industry Sector
- Stora Enso
- BASF SE
- 3M Company
- Ball Corporation
- International Paper Company
- Amcor PLC
- Avery Dennison Corporation
- Huhtamaki OYJ
- Zebra Technologies Corporation
- Sealed Air Corporation
Key Milestones in Smart Packaging Industry Industry
- March 2023: Amcor announced a joint research project agreement with Nfinite Nanotechnology Inc. to validate the application of Nfinite's nanocoating technology to improve packaging that can be recycled and composted. This initiative underscores the industry's focus on sustainable and environmentally friendly smart packaging solutions.
- January 2023: Avery Dennison announced a major investment of more than USD 100 million to expand its manufacturing capacity in the Americas region by constructing a new facility in Queretaro, Mexico. This investment supports their goal of becoming the world's largest RFID provider, aiming to assign a unique digital ID to each item and foster a more connected and transparent supply chain across multiple industries.
Strategic Outlook for Smart Packaging Industry Market
The strategic outlook for the smart packaging industry market is exceptionally positive, marked by accelerating innovation and expanding applications. Key growth accelerators include the ongoing integration of advanced sensing technologies, the proliferation of IoT connectivity, and the increasing consumer demand for transparency and sustainability. Strategic opportunities lie in leveraging smart packaging to enhance brand engagement, optimize supply chain efficiency, and meet evolving regulatory requirements for product safety and traceability. The focus on developing intelligent solutions for emerging markets and diversifying applications beyond traditional sectors will be crucial for sustained long-term growth. This market is set to revolutionize how products are delivered, consumed, and managed, creating significant value for stakeholders across the entire ecosystem.
Smart Packaging Industry Segmentation
-
1. Technology
- 1.1. Active Packaging
- 1.2. Intelligent Packaging
-
2. End-user Vertical
- 2.1. Food
- 2.2. Beverage
- 2.3. Healthcare
- 2.4. Personal Care
- 2.5. Other End-user Verticals
Smart Packaging Industry Segmentation By Geography
-
1. North America
- 1.1. United States
- 1.2. Canada
-
2. Europe
- 2.1. Germany
- 2.2. United Kingdom
- 2.3. France
- 2.4. Rest of Europe
-
3. Asia Pacific
- 3.1. China
- 3.2. Japan
- 3.3. India
- 3.4. Rest of Asia Pacific
- 4. Latin America
- 5. Middle East and Africa
Smart Packaging Industry Regional Market Share
Geographic Coverage of Smart Packaging Industry
Smart Packaging Industry REPORT HIGHLIGHTS
| Aspects | Details |
|---|---|
| Study Period | 2020-2034 |
| Base Year | 2025 |
| Estimated Year | 2026 |
| Forecast Period | 2026-2034 |
| Historical Period | 2020-2025 |
| Growth Rate | CAGR of 7.12% from 2020-2034 |
| Segmentation |
|
Table of Contents
- 1. Introduction
- 1.1. Research Scope
- 1.2. Market Segmentation
- 1.3. Research Objective
- 1.4. Definitions and Assumptions
- 2. Executive Summary
- 2.1. Market Snapshot
- 3. Market Dynamics
- 3.1. Market Drivers
- 3.2. Market Restrains
- 3.3. Market Trends
- 3.4. Market Opportunities
- 4. Market Factor Analysis
- 4.1. Porters Five Forces
- 4.1.1. Bargaining Power of Suppliers
- 4.1.2. Bargaining Power of Buyers
- 4.1.3. Threat of New Entrants
- 4.1.4. Threat of Substitutes
- 4.1.5. Competitive Rivalry
- 4.2. PESTEL analysis
- 4.3. BCG Analysis
- 4.3.1. Stars (High Growth, High Market Share)
- 4.3.2. Cash Cows (Low Growth, High Market Share)
- 4.3.3. Question Mark (High Growth, Low Market Share)
- 4.3.4. Dogs (Low Growth, Low Market Share)
- 4.4. Ansoff Matrix Analysis
- 4.5. Supply Chain Analysis
- 4.6. Regulatory Landscape
- 4.7. Current Market Potential and Opportunity Assessment (TAM–SAM–SOM Framework)
- 4.8. MSR Analyst Note
- 4.1. Porters Five Forces
- 5. Market Analysis, Insights and Forecast 2021-2033
- 5.1. Market Analysis, Insights and Forecast - by Technology
- 5.1.1. Active Packaging
- 5.1.2. Intelligent Packaging
- 5.2. Market Analysis, Insights and Forecast - by End-user Vertical
- 5.2.1. Food
- 5.2.2. Beverage
- 5.2.3. Healthcare
- 5.2.4. Personal Care
- 5.2.5. Other End-user Verticals
- 5.3. Market Analysis, Insights and Forecast - by Region
- 5.3.1. North America
- 5.3.2. Europe
- 5.3.3. Asia Pacific
- 5.3.4. Latin America
- 5.3.5. Middle East and Africa
- 5.1. Market Analysis, Insights and Forecast - by Technology
- 6. Global Smart Packaging Industry Analysis, Insights and Forecast, 2021-2033
- 6.1. Market Analysis, Insights and Forecast - by Technology
- 6.1.1. Active Packaging
- 6.1.2. Intelligent Packaging
- 6.2. Market Analysis, Insights and Forecast - by End-user Vertical
- 6.2.1. Food
- 6.2.2. Beverage
- 6.2.3. Healthcare
- 6.2.4. Personal Care
- 6.2.5. Other End-user Verticals
- 6.1. Market Analysis, Insights and Forecast - by Technology
- 7. North America Smart Packaging Industry Analysis, Insights and Forecast, 2020-2032
- 7.1. Market Analysis, Insights and Forecast - by Technology
- 7.1.1. Active Packaging
- 7.1.2. Intelligent Packaging
- 7.2. Market Analysis, Insights and Forecast - by End-user Vertical
- 7.2.1. Food
- 7.2.2. Beverage
- 7.2.3. Healthcare
- 7.2.4. Personal Care
- 7.2.5. Other End-user Verticals
- 7.1. Market Analysis, Insights and Forecast - by Technology
- 8. Europe Smart Packaging Industry Analysis, Insights and Forecast, 2020-2032
- 8.1. Market Analysis, Insights and Forecast - by Technology
- 8.1.1. Active Packaging
- 8.1.2. Intelligent Packaging
- 8.2. Market Analysis, Insights and Forecast - by End-user Vertical
- 8.2.1. Food
- 8.2.2. Beverage
- 8.2.3. Healthcare
- 8.2.4. Personal Care
- 8.2.5. Other End-user Verticals
- 8.1. Market Analysis, Insights and Forecast - by Technology
- 9. Asia Pacific Smart Packaging Industry Analysis, Insights and Forecast, 2020-2032
- 9.1. Market Analysis, Insights and Forecast - by Technology
- 9.1.1. Active Packaging
- 9.1.2. Intelligent Packaging
- 9.2. Market Analysis, Insights and Forecast - by End-user Vertical
- 9.2.1. Food
- 9.2.2. Beverage
- 9.2.3. Healthcare
- 9.2.4. Personal Care
- 9.2.5. Other End-user Verticals
- 9.1. Market Analysis, Insights and Forecast - by Technology
- 10. Latin America Smart Packaging Industry Analysis, Insights and Forecast, 2020-2032
- 10.1. Market Analysis, Insights and Forecast - by Technology
- 10.1.1. Active Packaging
- 10.1.2. Intelligent Packaging
- 10.2. Market Analysis, Insights and Forecast - by End-user Vertical
- 10.2.1. Food
- 10.2.2. Beverage
- 10.2.3. Healthcare
- 10.2.4. Personal Care
- 10.2.5. Other End-user Verticals
- 10.1. Market Analysis, Insights and Forecast - by Technology
- 11. Middle East and Africa Smart Packaging Industry Analysis, Insights and Forecast, 2020-2032
- 11.1. Market Analysis, Insights and Forecast - by Technology
- 11.1.1. Active Packaging
- 11.1.2. Intelligent Packaging
- 11.2. Market Analysis, Insights and Forecast - by End-user Vertical
- 11.2.1. Food
- 11.2.2. Beverage
- 11.2.3. Healthcare
- 11.2.4. Personal Care
- 11.2.5. Other End-user Verticals
- 11.1. Market Analysis, Insights and Forecast - by Technology
- 12. Competitive Analysis
- 12.1. Company Profiles
- 12.1.1 Stora Enso
- 12.1.1.1. Company Overview
- 12.1.1.2. Products
- 12.1.1.3. Company Financials
- 12.1.1.4. SWOT Analysis
- 12.1.2 BASF SE
- 12.1.2.1. Company Overview
- 12.1.2.2. Products
- 12.1.2.3. Company Financials
- 12.1.2.4. SWOT Analysis
- 12.1.3 3M Company
- 12.1.3.1. Company Overview
- 12.1.3.2. Products
- 12.1.3.3. Company Financials
- 12.1.3.4. SWOT Analysis
- 12.1.4 Ball corporation
- 12.1.4.1. Company Overview
- 12.1.4.2. Products
- 12.1.4.3. Company Financials
- 12.1.4.4. SWOT Analysis
- 12.1.5 International Paper Compan
- 12.1.5.1. Company Overview
- 12.1.5.2. Products
- 12.1.5.3. Company Financials
- 12.1.5.4. SWOT Analysis
- 12.1.6 Amcor PLC
- 12.1.6.1. Company Overview
- 12.1.6.2. Products
- 12.1.6.3. Company Financials
- 12.1.6.4. SWOT Analysis
- 12.1.7 Avery Dennison Corporation
- 12.1.7.1. Company Overview
- 12.1.7.2. Products
- 12.1.7.3. Company Financials
- 12.1.7.4. SWOT Analysis
- 12.1.8 Huhtamaki OYJ
- 12.1.8.1. Company Overview
- 12.1.8.2. Products
- 12.1.8.3. Company Financials
- 12.1.8.4. SWOT Analysis
- 12.1.9 Zebra Technologies Corporation
- 12.1.9.1. Company Overview
- 12.1.9.2. Products
- 12.1.9.3. Company Financials
- 12.1.9.4. SWOT Analysis
- 12.1.10 Sealed Air Corporation
- 12.1.10.1. Company Overview
- 12.1.10.2. Products
- 12.1.10.3. Company Financials
- 12.1.10.4. SWOT Analysis
- 12.1.1 Stora Enso
- 12.2. Market Entropy
- 12.2.1 Company's Key Areas Served
- 12.2.2 Recent Developments
- 12.3. Company Market Share Analysis 2025
- 12.3.1 Top 5 Companies Market Share Analysis
- 12.3.2 Top 3 Companies Market Share Analysis
- 12.4. List of Potential Customers
- 13. Research Methodology
List of Figures
- Figure 1: Global Smart Packaging Industry Revenue Breakdown (Million, %) by Region 2025 & 2033
- Figure 2: North America Smart Packaging Industry Revenue (Million), by Technology 2025 & 2033
- Figure 3: North America Smart Packaging Industry Revenue Share (%), by Technology 2025 & 2033
- Figure 4: North America Smart Packaging Industry Revenue (Million), by End-user Vertical 2025 & 2033
- Figure 5: North America Smart Packaging Industry Revenue Share (%), by End-user Vertical 2025 & 2033
- Figure 6: North America Smart Packaging Industry Revenue (Million), by Country 2025 & 2033
- Figure 7: North America Smart Packaging Industry Revenue Share (%), by Country 2025 & 2033
- Figure 8: Europe Smart Packaging Industry Revenue (Million), by Technology 2025 & 2033
- Figure 9: Europe Smart Packaging Industry Revenue Share (%), by Technology 2025 & 2033
- Figure 10: Europe Smart Packaging Industry Revenue (Million), by End-user Vertical 2025 & 2033
- Figure 11: Europe Smart Packaging Industry Revenue Share (%), by End-user Vertical 2025 & 2033
- Figure 12: Europe Smart Packaging Industry Revenue (Million), by Country 2025 & 2033
- Figure 13: Europe Smart Packaging Industry Revenue Share (%), by Country 2025 & 2033
- Figure 14: Asia Pacific Smart Packaging Industry Revenue (Million), by Technology 2025 & 2033
- Figure 15: Asia Pacific Smart Packaging Industry Revenue Share (%), by Technology 2025 & 2033
- Figure 16: Asia Pacific Smart Packaging Industry Revenue (Million), by End-user Vertical 2025 & 2033
- Figure 17: Asia Pacific Smart Packaging Industry Revenue Share (%), by End-user Vertical 2025 & 2033
- Figure 18: Asia Pacific Smart Packaging Industry Revenue (Million), by Country 2025 & 2033
- Figure 19: Asia Pacific Smart Packaging Industry Revenue Share (%), by Country 2025 & 2033
- Figure 20: Latin America Smart Packaging Industry Revenue (Million), by Technology 2025 & 2033
- Figure 21: Latin America Smart Packaging Industry Revenue Share (%), by Technology 2025 & 2033
- Figure 22: Latin America Smart Packaging Industry Revenue (Million), by End-user Vertical 2025 & 2033
- Figure 23: Latin America Smart Packaging Industry Revenue Share (%), by End-user Vertical 2025 & 2033
- Figure 24: Latin America Smart Packaging Industry Revenue (Million), by Country 2025 & 2033
- Figure 25: Latin America Smart Packaging Industry Revenue Share (%), by Country 2025 & 2033
- Figure 26: Middle East and Africa Smart Packaging Industry Revenue (Million), by Technology 2025 & 2033
- Figure 27: Middle East and Africa Smart Packaging Industry Revenue Share (%), by Technology 2025 & 2033
- Figure 28: Middle East and Africa Smart Packaging Industry Revenue (Million), by End-user Vertical 2025 & 2033
- Figure 29: Middle East and Africa Smart Packaging Industry Revenue Share (%), by End-user Vertical 2025 & 2033
- Figure 30: Middle East and Africa Smart Packaging Industry Revenue (Million), by Country 2025 & 2033
- Figure 31: Middle East and Africa Smart Packaging Industry Revenue Share (%), by Country 2025 & 2033
List of Tables
- Table 1: Global Smart Packaging Industry Revenue Million Forecast, by Technology 2020 & 2033
- Table 2: Global Smart Packaging Industry Revenue Million Forecast, by End-user Vertical 2020 & 2033
- Table 3: Global Smart Packaging Industry Revenue Million Forecast, by Region 2020 & 2033
- Table 4: Global Smart Packaging Industry Revenue Million Forecast, by Technology 2020 & 2033
- Table 5: Global Smart Packaging Industry Revenue Million Forecast, by End-user Vertical 2020 & 2033
- Table 6: Global Smart Packaging Industry Revenue Million Forecast, by Country 2020 & 2033
- Table 7: United States Smart Packaging Industry Revenue (Million) Forecast, by Application 2020 & 2033
- Table 8: Canada Smart Packaging Industry Revenue (Million) Forecast, by Application 2020 & 2033
- Table 9: Global Smart Packaging Industry Revenue Million Forecast, by Technology 2020 & 2033
- Table 10: Global Smart Packaging Industry Revenue Million Forecast, by End-user Vertical 2020 & 2033
- Table 11: Global Smart Packaging Industry Revenue Million Forecast, by Country 2020 & 2033
- Table 12: Germany Smart Packaging Industry Revenue (Million) Forecast, by Application 2020 & 2033
- Table 13: United Kingdom Smart Packaging Industry Revenue (Million) Forecast, by Application 2020 & 2033
- Table 14: France Smart Packaging Industry Revenue (Million) Forecast, by Application 2020 & 2033
- Table 15: Rest of Europe Smart Packaging Industry Revenue (Million) Forecast, by Application 2020 & 2033
- Table 16: Global Smart Packaging Industry Revenue Million Forecast, by Technology 2020 & 2033
- Table 17: Global Smart Packaging Industry Revenue Million Forecast, by End-user Vertical 2020 & 2033
- Table 18: Global Smart Packaging Industry Revenue Million Forecast, by Country 2020 & 2033
- Table 19: China Smart Packaging Industry Revenue (Million) Forecast, by Application 2020 & 2033
- Table 20: Japan Smart Packaging Industry Revenue (Million) Forecast, by Application 2020 & 2033
- Table 21: India Smart Packaging Industry Revenue (Million) Forecast, by Application 2020 & 2033
- Table 22: Rest of Asia Pacific Smart Packaging Industry Revenue (Million) Forecast, by Application 2020 & 2033
- Table 23: Global Smart Packaging Industry Revenue Million Forecast, by Technology 2020 & 2033
- Table 24: Global Smart Packaging Industry Revenue Million Forecast, by End-user Vertical 2020 & 2033
- Table 25: Global Smart Packaging Industry Revenue Million Forecast, by Country 2020 & 2033
- Table 26: Global Smart Packaging Industry Revenue Million Forecast, by Technology 2020 & 2033
- Table 27: Global Smart Packaging Industry Revenue Million Forecast, by End-user Vertical 2020 & 2033
- Table 28: Global Smart Packaging Industry Revenue Million Forecast, by Country 2020 & 2033
Frequently Asked Questions
1. What is the projected Compound Annual Growth Rate (CAGR) of the Smart Packaging Industry?
The projected CAGR is approximately 7.12%.
2. Which companies are prominent players in the Smart Packaging Industry?
Key companies in the market include Stora Enso, BASF SE, 3M Company, Ball corporation, International Paper Compan, Amcor PLC, Avery Dennison Corporation, Huhtamaki OYJ, Zebra Technologies Corporation, Sealed Air Corporation.
3. What are the main segments of the Smart Packaging Industry?
The market segments include Technology, End-user Vertical.
4. Can you provide details about the market size?
The market size is estimated to be USD 22.67 Million as of 2022.
5. What are some drivers contributing to market growth?
Advancement in Technology in Food Packaging for Quality Inspection; Rising Awareness Regarding Food Safety; Development in the Printing Industry Due to Various Applications of Smart Packaging.
6. What are the notable trends driving market growth?
Active Packaging to Hold Major Share in the Market.
7. Are there any restraints impacting market growth?
High Costs Due to Initial Requirement.
8. Can you provide examples of recent developments in the market?
March 2023: Amcor, a company that creates and manufactures environment-friendly packaging solutions, announced a joint research project agreement with NfiniteNanotechnology Inc. to validate the application of Nfinite's nanocoating technology to improve packaging that can be recycled and composted.
9. What pricing options are available for accessing the report?
Pricing options include single-user, multi-user, and enterprise licenses priced at USD 4750, USD 5250, and USD 8750 respectively.
10. Is the market size provided in terms of value or volume?
The market size is provided in terms of value, measured in Million.
11. Are there any specific market keywords associated with the report?
Yes, the market keyword associated with the report is "Smart Packaging Industry," which aids in identifying and referencing the specific market segment covered.
12. How do I determine which pricing option suits my needs best?
The pricing options vary based on user requirements and access needs. Individual users may opt for single-user licenses, while businesses requiring broader access may choose multi-user or enterprise licenses for cost-effective access to the report.
13. Are there any additional resources or data provided in the Smart Packaging Industry report?
While the report offers comprehensive insights, it's advisable to review the specific contents or supplementary materials provided to ascertain if additional resources or data are available.
14. How can I stay updated on further developments or reports in the Smart Packaging Industry?
To stay informed about further developments, trends, and reports in the Smart Packaging Industry, consider subscribing to industry newsletters, following relevant companies and organizations, or regularly checking reputable industry news sources and publications.
Methodology
Step 1 - Identification of Relevant Samples Size from Population Database


Step 2 - Approaches for Defining Global Market Size (Value, Volume* & Price*)

Note*: In applicable scenarios
Step 3 - Data Sources
Primary Research
- Web Analytics
- Survey Reports
- Research Institute
- Latest Research Reports
- Opinion Leaders
Secondary Research
- Annual Reports
- White Paper
- Latest Press Release
- Industry Association
- Paid Database
- Investor Presentations

Step 4 - Data Triangulation
Involves using different sources of information in order to increase the validity of a study
These sources are likely to be stakeholders in a program - participants, other researchers, program staff, other community members, and so on.
Then we put all data in single framework & apply various statistical tools to find out the dynamic on the market.
During the analysis stage, feedback from the stakeholder groups would be compared to determine areas of agreement as well as areas of divergence