

Key Insights
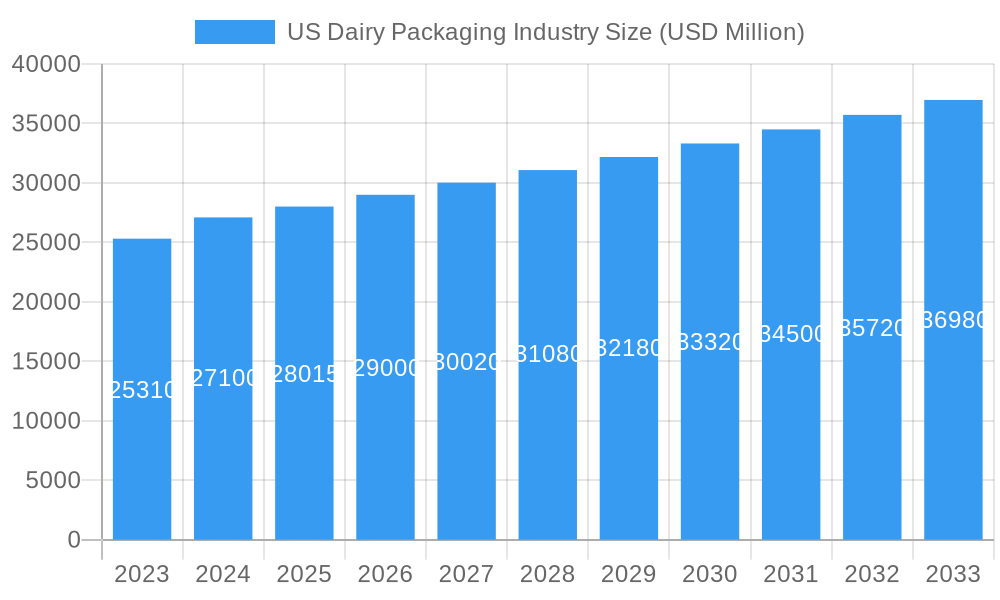
The US dairy packaging market is a dynamic and essential sector, projected to reach $27.1 billion in 2024 and experience a CAGR of 3.52% through 2033. This growth is underpinned by increasing consumer demand for convenient, sustainable, and safe dairy products. Key drivers include the rising popularity of high-protein dairy options, the expansion of cheese and frozen dairy product segments, and a growing preference for healthier food choices. Consumers are increasingly looking for packaging that not only preserves product integrity but also offers ease of use and aligns with environmental values. This has spurred innovation in materials, with a notable shift towards more sustainable options like paper and paperboard alongside continued reliance on plastics, glass, and metal for their specific protective qualities. The evolving retail landscape, including the growth of e-commerce for groceries, also influences packaging design, emphasizing durability and efficient logistics.
US Dairy Packaging Industry Market Size (In Billion)
The market is segmented across various material types, product types, and packaging formats to cater to diverse dairy categories. In terms of materials, plastics continue to dominate due to their versatility and cost-effectiveness, but paper and paperboard are gaining traction, driven by sustainability initiatives and consumer preference. Cheese and frozen products represent significant growth areas within product types, requiring specialized packaging solutions that ensure extended shelf life and protection. On the packaging type front, bottles and cartons remain staples for liquid dairy, while pouches and bags are increasingly adopted for convenience and single-serving options. The competitive landscape features established global players like Amcor Plc, Berry Global Group Inc., and Tetra Pak International SA, alongside regional specialists, all vying for market share through product innovation, strategic partnerships, and a focus on sustainability. Addressing restraints such as fluctuating raw material costs and stringent regulatory requirements will be crucial for sustained growth.
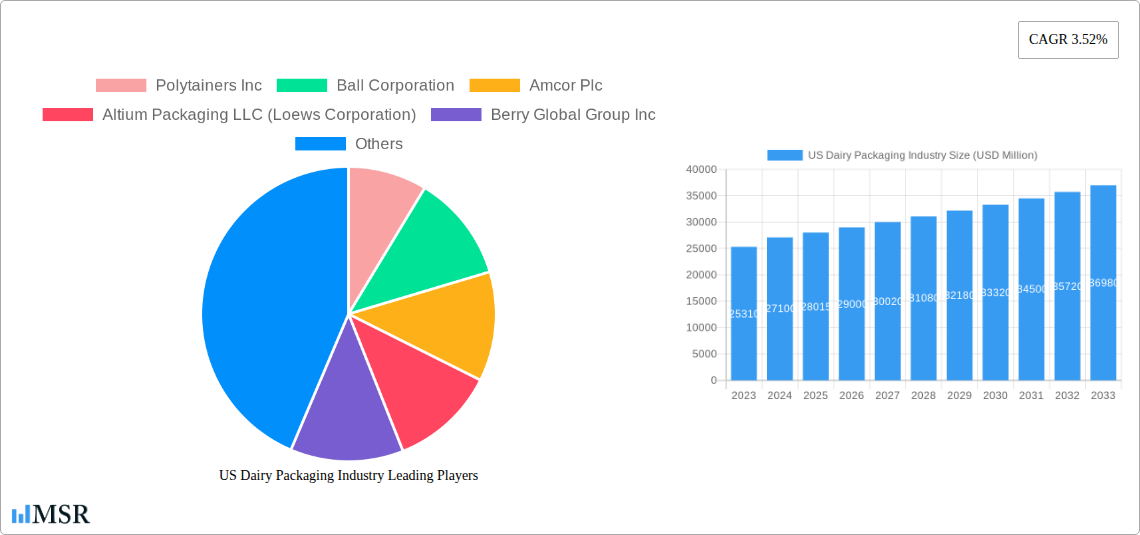
US Dairy Packaging Industry Company Market Share
Unlock critical intelligence for the US dairy packaging market. This comprehensive report delves into market dynamics, growth drivers, technological innovations, and emerging opportunities within the dairy packaging sector. Discover actionable insights for stakeholders aiming to capitalize on evolving consumer demands for sustainable and functional packaging solutions. This report covers the US dairy packaging market from 2019 to 2033, with a base year of 2025.
US Dairy Packaging Industry Market Concentration & Dynamics
The US dairy packaging industry exhibits a moderate to high level of market concentration, with several large multinational corporations and a significant number of regional players vying for market share. Key players like Amcor Plc, Ball Corporation, and Berry Global Group Inc. hold substantial influence, driven by their extensive product portfolios and global manufacturing capabilities. Innovation ecosystems are vibrant, fueled by increasing R&D investments in sustainable materials and advanced barrier technologies. Regulatory frameworks, particularly those concerning food safety and environmental impact, play a crucial role in shaping market strategies and product development. The threat of substitute products, such as plant-based alternatives requiring different packaging, necessitates continuous adaptation. End-user trends, including a growing demand for convenience, single-serve portions, and eco-friendly options, are profoundly influencing packaging design and material choices. Mergers and acquisitions (M&A) activities, though not excessively high, are strategic moves by key players to enhance market presence, acquire new technologies, or consolidate their positions. For instance, significant M&A deals in recent years have reshaped the competitive landscape, with a focus on expanding capabilities in sustainable packaging solutions and e-commerce fulfillment. The market share of leading companies is constantly evolving due to these strategic maneuvers and product innovations.
US Dairy Packaging Industry Industry Insights & Trends
The US dairy packaging industry is poised for robust growth, driven by a confluence of economic factors, technological advancements, and shifting consumer behaviors. The market size is projected to reach $XX billion by 2025, with a Compound Annual Growth Rate (CAGR) of approximately XX% during the forecast period of 2025–2033. This expansion is largely fueled by the increasing consumption of dairy products, including milk, cheese, and cultured products, coupled with the rising demand for convenient and sustainable packaging solutions. Technological disruptions are playing a pivotal role, with innovations in material science leading to the development of advanced barrier technologies that enhance product shelf life and maintain flavor integrity. The adoption of recyclable and biodegradable materials is a significant trend, responding to heightened consumer awareness regarding environmental sustainability. E-commerce growth is also a key driver, necessitating packaging that can withstand the rigors of online distribution while maintaining product quality and brand appeal. Consumer preferences are increasingly leaning towards smaller, more portable packaging formats, as well as aesthetically pleasing designs that enhance product visibility and appeal on store shelves. The emphasis on health and wellness also influences packaging choices, with consumers seeking clear labeling and transparency regarding ingredients and sourcing. Furthermore, the dairy industry's ongoing commitment to reducing its environmental footprint, including minimizing plastic waste and promoting circular economy principles, will continue to shape packaging strategies. The integration of smart packaging technologies, offering enhanced traceability and consumer engagement, is another emerging trend that is expected to gain traction. The base year of 2025 is critical, setting the stage for further market expansion driven by these intertwined factors.
Key Markets & Segments Leading US Dairy Packaging Industry
The US dairy packaging industry is predominantly led by the Plastic material segment, which accounts for the largest market share due to its versatility, cost-effectiveness, and lightweight properties. Within this segment, PET (Polyethylene Terephthalate) and HDPE (High-Density Polyethylene) are the most widely used materials for a variety of dairy products, offering excellent barrier properties and recyclability. The Milk product type is the primary volume driver, necessitating large-scale production of packaging solutions like Bottles and Cartons and Boxes. These packaging types are favored for their convenience, ease of handling, and established supply chain infrastructure.
- Material Type Dominance:
- Plastic: Dominates due to its cost-effectiveness, durability, and excellent barrier properties for extending shelf life. Its lightweight nature also reduces transportation costs.
- Paper and Paperboard: Growing in importance due to sustainability initiatives and advancements in barrier coatings, particularly for yogurt cups and cheese packaging.
- Product Type Dominance:
- Milk: The largest segment, driving demand for high-volume packaging like HDPE and PET bottles, as well as gable-top cartons.
- Cheese: Diverse packaging needs, from flexible pouches and bags for shredded cheese to rigid containers for blocks and slices.
- Packaging Type Dominance:
- Bottles: Essential for liquid milk and cultured products, with increasing innovation in design for enhanced shelf appeal and functionality.
- Cartons and Boxes: Widely used for milk, yogurt, and frozen dairy products, offering good printability and stacking capabilities.
US Dairy Packaging Industry Product Developments
Recent product developments in the US dairy packaging industry underscore a strong commitment to sustainability and enhanced functionality. A prime example is Amcor Rigid Packaging's (ARP) DairySeal range, featuring ClearCor, an advanced PET barrier technology. This innovation allows for the production of packaging with up to 80% recyclable materials, while simultaneously improving flavor protection and product performance. The DairySeal line in PET offers businesses streamlined access to e-commerce and convenience store distribution channels, with its round, firm plastic bottles designed for optimal refrigerator shelf placement. These advancements reflect the industry's proactive response to evolving consumer demands for eco-friendly and convenient packaging.
Challenges in the US Dairy Packaging Industry Market
The US dairy packaging market faces several significant challenges. Regulatory hurdles, particularly concerning food contact materials and increasing mandates for recycled content, can lead to increased compliance costs and necessitate R&D investments in new materials. Supply chain disruptions, including raw material price volatility and availability issues, can impact production schedules and profit margins. Furthermore, intense competitive pressures from both established players and emerging innovators drive a constant need for cost optimization and product differentiation. The growing consumer preference for plant-based alternatives, which often require distinct packaging solutions, also presents a competitive challenge.
Forces Driving US Dairy Packaging Industry Growth
Several key forces are propelling the growth of the US dairy packaging industry. Technological innovation in sustainable materials, such as recycled PET and biodegradable alternatives, is a significant driver, aligning with consumer and regulatory demands. The expanding e-commerce channel necessitates robust and appealing packaging solutions capable of ensuring product integrity during transit. Economic growth and rising disposable incomes generally correlate with increased consumption of dairy products, thereby boosting packaging demand. Moreover, evolving consumer preferences for convenience, portion control, and visually appealing packaging encourage manufacturers to invest in innovative designs and formats. Government initiatives promoting sustainability and circular economy principles are also indirectly fostering growth by incentivizing the adoption of eco-friendly packaging solutions.
Challenges in the US Dairy Packaging Industry Market
Long-term growth catalysts in the US dairy packaging market are deeply intertwined with innovation and strategic market expansions. Continued investment in research and development for novel biodegradable and compostable materials will be crucial for meeting future sustainability targets. Partnerships between dairy processors and packaging manufacturers to co-create bespoke solutions tailored to specific product needs and market segments will foster deeper integration and loyalty. Expansion into emerging dairy product categories, such as specialized yogurts and high-protein dairy beverages, will open new avenues for packaging innovation. Furthermore, leveraging advancements in smart packaging technology for enhanced traceability, consumer engagement, and supply chain efficiency will create significant long-term value and competitive advantage.
Emerging Opportunities in US Dairy Packaging Industry
Emerging opportunities in the US dairy packaging industry are ripe for exploration. The growing demand for premium and artisanal dairy products presents a market for specialized, aesthetically appealing packaging that can enhance brand perception. The increasing focus on health and wellness fuels demand for smaller, single-serve formats and clear labeling that highlights nutritional benefits. Innovations in active and intelligent packaging, offering extended shelf life and real-time product monitoring, represent a significant technological frontier. Furthermore, the expansion of direct-to-consumer (DTC) models for dairy products necessitates packaging solutions optimized for online delivery and consumer unboxing experiences. The drive towards a circular economy creates opportunities for businesses that can effectively implement and scale closed-loop recycling systems for dairy packaging.
Leading Players in the US Dairy Packaging Industry Sector
- Polytainers Inc
- Ball Corporation
- Amcor Plc
- Altium Packaging LLC (Loews Corporation)
- Berry Global Group Inc
- Winpak Ltd
- International Paper Company
- Smurfit Kappa Group PLC
- Tetra Pak International SA*
- Sealed Air Corporation
- Huhtamaki Oyj
Key Milestones in US Dairy Packaging Industry Industry
- September 2022: Amcor Rigid Packaging (ARP) launched its DairySeal range, featuring ClearCor, an advanced PET barrier. This innovation enables the production of up to 80% recyclable packaging, offering improved flavor and function, and facilitating e-commerce and convenience store distribution with its optimized bottle design.
- August 2022: The Vermont Agency of Agriculture, Food and Markets, via the Northeast Dairy Business Innovation Center (NE-DBIC), awarded a Dairy Product Packaging Innovation Grant totaling USD 1.1 million to five players. This initiative aims to minimize virgin plastic usage and reduce the environmental impact of dairy supply chain packaging, supporting research, development, and customer receptivity analysis of sustainable alternatives, with findings shared to enhance accessibility for small and medium-sized processors.
Strategic Outlook for US Dairy Packaging Industry Market
The strategic outlook for the US dairy packaging industry is characterized by a strong emphasis on sustainability, innovation, and market diversification. Growth accelerators include the ongoing development and adoption of advanced recycled materials and biodegradable alternatives, driven by both consumer demand and regulatory pressures. Investments in e-commerce-ready packaging solutions will continue to be a priority, ensuring product integrity and brand appeal throughout the online supply chain. The industry is also expected to witness further consolidation and strategic partnerships as companies seek to enhance their capabilities in sustainable packaging technologies and expand their market reach. Opportunities lie in catering to niche dairy segments with specialized packaging, leveraging smart packaging for enhanced consumer engagement, and championing circular economy models to minimize waste and promote resource efficiency. Companies that can effectively balance cost, performance, and environmental responsibility will be well-positioned for sustained success in this dynamic market.
US Dairy Packaging Industry Segmentation
-
1. Material Type
- 1.1. Plastic
- 1.2. Paper and Paperboard
- 1.3. Glass
- 1.4. Metal
-
2. Product Type
- 2.1. Milk
- 2.2. Cheese
- 2.3. Frozen Products
- 2.4. Cultured Products
- 2.5. Other Product Types
-
3. Packaging Type
- 3.1. Bottles
- 3.2. Pouches
- 3.3. Cartons and Boxes
- 3.4. Bags and Wraps
- 3.5. Other Packaging Types
US Dairy Packaging Industry Segmentation By Geography
-
1. North America
- 1.1. United States
- 1.2. Canada
- 1.3. Mexico
-
2. South America
- 2.1. Brazil
- 2.2. Argentina
- 2.3. Rest of South America
-
3. Europe
- 3.1. United Kingdom
- 3.2. Germany
- 3.3. France
- 3.4. Italy
- 3.5. Spain
- 3.6. Russia
- 3.7. Benelux
- 3.8. Nordics
- 3.9. Rest of Europe
-
4. Middle East & Africa
- 4.1. Turkey
- 4.2. Israel
- 4.3. GCC
- 4.4. North Africa
- 4.5. South Africa
- 4.6. Rest of Middle East & Africa
-
5. Asia Pacific
- 5.1. China
- 5.2. India
- 5.3. Japan
- 5.4. South Korea
- 5.5. ASEAN
- 5.6. Oceania
- 5.7. Rest of Asia Pacific
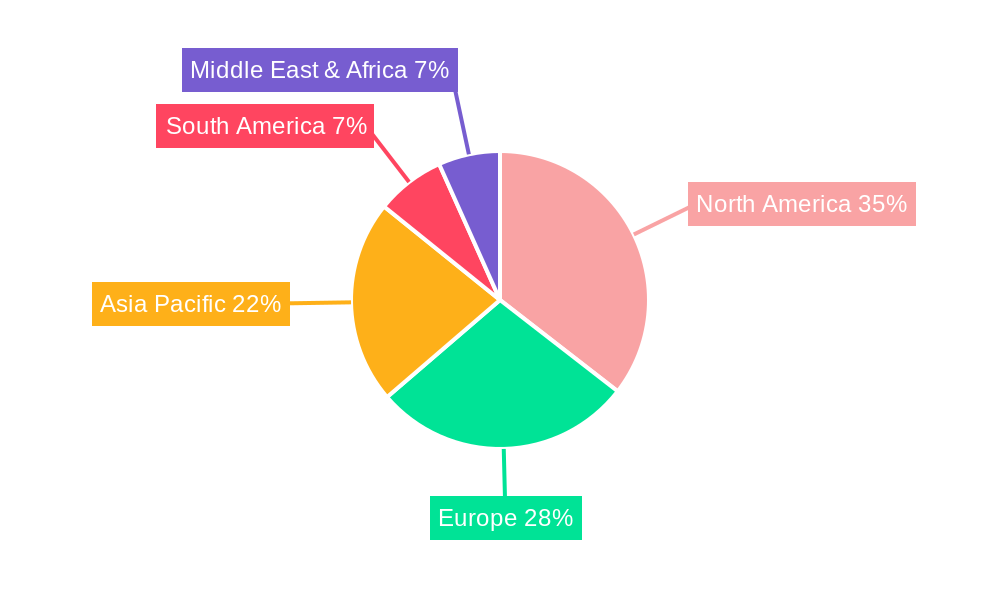
US Dairy Packaging Industry Regional Market Share
Geographic Coverage of US Dairy Packaging Industry
US Dairy Packaging Industry REPORT HIGHLIGHTS
| Aspects | Details |
|---|---|
| Study Period | 2020-2034 |
| Base Year | 2025 |
| Estimated Year | 2026 |
| Forecast Period | 2026-2034 |
| Historical Period | 2020-2025 |
| Growth Rate | CAGR of 2.7% from 2020-2034 |
| Segmentation |
|
Table of Contents
- 1. Introduction
- 1.1. Research Scope
- 1.2. Market Segmentation
- 1.3. Research Objective
- 1.4. Definitions and Assumptions
- 2. Executive Summary
- 2.1. Market Snapshot
- 3. Market Dynamics
- 3.1. Market Drivers
- 3.2. Market Restrains
- 3.3. Market Trends
- 3.4. Market Opportunities
- 4. Market Factor Analysis
- 4.1. Porters Five Forces
- 4.1.1. Bargaining Power of Suppliers
- 4.1.2. Bargaining Power of Buyers
- 4.1.3. Threat of New Entrants
- 4.1.4. Threat of Substitutes
- 4.1.5. Competitive Rivalry
- 4.2. PESTEL analysis
- 4.3. BCG Analysis
- 4.3.1. Stars (High Growth, High Market Share)
- 4.3.2. Cash Cows (Low Growth, High Market Share)
- 4.3.3. Question Mark (High Growth, Low Market Share)
- 4.3.4. Dogs (Low Growth, Low Market Share)
- 4.4. Ansoff Matrix Analysis
- 4.5. Supply Chain Analysis
- 4.6. Regulatory Landscape
- 4.7. Current Market Potential and Opportunity Assessment (TAM–SAM–SOM Framework)
- 4.8. MSR Analyst Note
- 4.1. Porters Five Forces
- 5. Market Analysis, Insights and Forecast 2021-2033
- 5.1. Market Analysis, Insights and Forecast - by Material Type
- 5.1.1. Plastic
- 5.1.2. Paper and Paperboard
- 5.1.3. Glass
- 5.1.4. Metal
- 5.2. Market Analysis, Insights and Forecast - by Product Type
- 5.2.1. Milk
- 5.2.2. Cheese
- 5.2.3. Frozen Products
- 5.2.4. Cultured Products
- 5.2.5. Other Product Types
- 5.3. Market Analysis, Insights and Forecast - by Packaging Type
- 5.3.1. Bottles
- 5.3.2. Pouches
- 5.3.3. Cartons and Boxes
- 5.3.4. Bags and Wraps
- 5.3.5. Other Packaging Types
- 5.4. Market Analysis, Insights and Forecast - by Region
- 5.4.1. North America
- 5.4.2. South America
- 5.4.3. Europe
- 5.4.4. Middle East & Africa
- 5.4.5. Asia Pacific
- 5.1. Market Analysis, Insights and Forecast - by Material Type
- 6. Global US Dairy Packaging Industry Analysis, Insights and Forecast, 2021-2033
- 6.1. Market Analysis, Insights and Forecast - by Material Type
- 6.1.1. Plastic
- 6.1.2. Paper and Paperboard
- 6.1.3. Glass
- 6.1.4. Metal
- 6.2. Market Analysis, Insights and Forecast - by Product Type
- 6.2.1. Milk
- 6.2.2. Cheese
- 6.2.3. Frozen Products
- 6.2.4. Cultured Products
- 6.2.5. Other Product Types
- 6.3. Market Analysis, Insights and Forecast - by Packaging Type
- 6.3.1. Bottles
- 6.3.2. Pouches
- 6.3.3. Cartons and Boxes
- 6.3.4. Bags and Wraps
- 6.3.5. Other Packaging Types
- 6.1. Market Analysis, Insights and Forecast - by Material Type
- 7. North America US Dairy Packaging Industry Analysis, Insights and Forecast, 2020-2032
- 7.1. Market Analysis, Insights and Forecast - by Material Type
- 7.1.1. Plastic
- 7.1.2. Paper and Paperboard
- 7.1.3. Glass
- 7.1.4. Metal
- 7.2. Market Analysis, Insights and Forecast - by Product Type
- 7.2.1. Milk
- 7.2.2. Cheese
- 7.2.3. Frozen Products
- 7.2.4. Cultured Products
- 7.2.5. Other Product Types
- 7.3. Market Analysis, Insights and Forecast - by Packaging Type
- 7.3.1. Bottles
- 7.3.2. Pouches
- 7.3.3. Cartons and Boxes
- 7.3.4. Bags and Wraps
- 7.3.5. Other Packaging Types
- 7.1. Market Analysis, Insights and Forecast - by Material Type
- 8. South America US Dairy Packaging Industry Analysis, Insights and Forecast, 2020-2032
- 8.1. Market Analysis, Insights and Forecast - by Material Type
- 8.1.1. Plastic
- 8.1.2. Paper and Paperboard
- 8.1.3. Glass
- 8.1.4. Metal
- 8.2. Market Analysis, Insights and Forecast - by Product Type
- 8.2.1. Milk
- 8.2.2. Cheese
- 8.2.3. Frozen Products
- 8.2.4. Cultured Products
- 8.2.5. Other Product Types
- 8.3. Market Analysis, Insights and Forecast - by Packaging Type
- 8.3.1. Bottles
- 8.3.2. Pouches
- 8.3.3. Cartons and Boxes
- 8.3.4. Bags and Wraps
- 8.3.5. Other Packaging Types
- 8.1. Market Analysis, Insights and Forecast - by Material Type
- 9. Europe US Dairy Packaging Industry Analysis, Insights and Forecast, 2020-2032
- 9.1. Market Analysis, Insights and Forecast - by Material Type
- 9.1.1. Plastic
- 9.1.2. Paper and Paperboard
- 9.1.3. Glass
- 9.1.4. Metal
- 9.2. Market Analysis, Insights and Forecast - by Product Type
- 9.2.1. Milk
- 9.2.2. Cheese
- 9.2.3. Frozen Products
- 9.2.4. Cultured Products
- 9.2.5. Other Product Types
- 9.3. Market Analysis, Insights and Forecast - by Packaging Type
- 9.3.1. Bottles
- 9.3.2. Pouches
- 9.3.3. Cartons and Boxes
- 9.3.4. Bags and Wraps
- 9.3.5. Other Packaging Types
- 9.1. Market Analysis, Insights and Forecast - by Material Type
- 10. Middle East & Africa US Dairy Packaging Industry Analysis, Insights and Forecast, 2020-2032
- 10.1. Market Analysis, Insights and Forecast - by Material Type
- 10.1.1. Plastic
- 10.1.2. Paper and Paperboard
- 10.1.3. Glass
- 10.1.4. Metal
- 10.2. Market Analysis, Insights and Forecast - by Product Type
- 10.2.1. Milk
- 10.2.2. Cheese
- 10.2.3. Frozen Products
- 10.2.4. Cultured Products
- 10.2.5. Other Product Types
- 10.3. Market Analysis, Insights and Forecast - by Packaging Type
- 10.3.1. Bottles
- 10.3.2. Pouches
- 10.3.3. Cartons and Boxes
- 10.3.4. Bags and Wraps
- 10.3.5. Other Packaging Types
- 10.1. Market Analysis, Insights and Forecast - by Material Type
- 11. Asia Pacific US Dairy Packaging Industry Analysis, Insights and Forecast, 2020-2032
- 11.1. Market Analysis, Insights and Forecast - by Material Type
- 11.1.1. Plastic
- 11.1.2. Paper and Paperboard
- 11.1.3. Glass
- 11.1.4. Metal
- 11.2. Market Analysis, Insights and Forecast - by Product Type
- 11.2.1. Milk
- 11.2.2. Cheese
- 11.2.3. Frozen Products
- 11.2.4. Cultured Products
- 11.2.5. Other Product Types
- 11.3. Market Analysis, Insights and Forecast - by Packaging Type
- 11.3.1. Bottles
- 11.3.2. Pouches
- 11.3.3. Cartons and Boxes
- 11.3.4. Bags and Wraps
- 11.3.5. Other Packaging Types
- 11.1. Market Analysis, Insights and Forecast - by Material Type
- 12. Competitive Analysis
- 12.1. Company Profiles
- 12.1.1 Polytainers Inc
- 12.1.1.1. Company Overview
- 12.1.1.2. Products
- 12.1.1.3. Company Financials
- 12.1.1.4. SWOT Analysis
- 12.1.2 Ball Corporation
- 12.1.2.1. Company Overview
- 12.1.2.2. Products
- 12.1.2.3. Company Financials
- 12.1.2.4. SWOT Analysis
- 12.1.3 Amcor Plc
- 12.1.3.1. Company Overview
- 12.1.3.2. Products
- 12.1.3.3. Company Financials
- 12.1.3.4. SWOT Analysis
- 12.1.4 Altium Packaging LLC (Loews Corporation)
- 12.1.4.1. Company Overview
- 12.1.4.2. Products
- 12.1.4.3. Company Financials
- 12.1.4.4. SWOT Analysis
- 12.1.5 Berry Global Group Inc
- 12.1.5.1. Company Overview
- 12.1.5.2. Products
- 12.1.5.3. Company Financials
- 12.1.5.4. SWOT Analysis
- 12.1.6 Winpak Ltd
- 12.1.6.1. Company Overview
- 12.1.6.2. Products
- 12.1.6.3. Company Financials
- 12.1.6.4. SWOT Analysis
- 12.1.7 International Paper Company
- 12.1.7.1. Company Overview
- 12.1.7.2. Products
- 12.1.7.3. Company Financials
- 12.1.7.4. SWOT Analysis
- 12.1.8 Smurfit Kappa Group PLC
- 12.1.8.1. Company Overview
- 12.1.8.2. Products
- 12.1.8.3. Company Financials
- 12.1.8.4. SWOT Analysis
- 12.1.9 Tetra Pak International SA*List Not Exhaustive
- 12.1.9.1. Company Overview
- 12.1.9.2. Products
- 12.1.9.3. Company Financials
- 12.1.9.4. SWOT Analysis
- 12.1.10 Sealed Air Corporation
- 12.1.10.1. Company Overview
- 12.1.10.2. Products
- 12.1.10.3. Company Financials
- 12.1.10.4. SWOT Analysis
- 12.1.11 Huhtamaki Oyj
- 12.1.11.1. Company Overview
- 12.1.11.2. Products
- 12.1.11.3. Company Financials
- 12.1.11.4. SWOT Analysis
- 12.1.1 Polytainers Inc
- 12.2. Market Entropy
- 12.2.1 Company's Key Areas Served
- 12.2.2 Recent Developments
- 12.3. Company Market Share Analysis 2025
- 12.3.1 Top 5 Companies Market Share Analysis
- 12.3.2 Top 3 Companies Market Share Analysis
- 12.4. List of Potential Customers
- 13. Research Methodology
List of Figures
- Figure 1: Global US Dairy Packaging Industry Revenue Breakdown (billion, %) by Region 2025 & 2033
- Figure 2: North America US Dairy Packaging Industry Revenue (billion), by Material Type 2025 & 2033
- Figure 3: North America US Dairy Packaging Industry Revenue Share (%), by Material Type 2025 & 2033
- Figure 4: North America US Dairy Packaging Industry Revenue (billion), by Product Type 2025 & 2033
- Figure 5: North America US Dairy Packaging Industry Revenue Share (%), by Product Type 2025 & 2033
- Figure 6: North America US Dairy Packaging Industry Revenue (billion), by Packaging Type 2025 & 2033
- Figure 7: North America US Dairy Packaging Industry Revenue Share (%), by Packaging Type 2025 & 2033
- Figure 8: North America US Dairy Packaging Industry Revenue (billion), by Country 2025 & 2033
- Figure 9: North America US Dairy Packaging Industry Revenue Share (%), by Country 2025 & 2033
- Figure 10: South America US Dairy Packaging Industry Revenue (billion), by Material Type 2025 & 2033
- Figure 11: South America US Dairy Packaging Industry Revenue Share (%), by Material Type 2025 & 2033
- Figure 12: South America US Dairy Packaging Industry Revenue (billion), by Product Type 2025 & 2033
- Figure 13: South America US Dairy Packaging Industry Revenue Share (%), by Product Type 2025 & 2033
- Figure 14: South America US Dairy Packaging Industry Revenue (billion), by Packaging Type 2025 & 2033
- Figure 15: South America US Dairy Packaging Industry Revenue Share (%), by Packaging Type 2025 & 2033
- Figure 16: South America US Dairy Packaging Industry Revenue (billion), by Country 2025 & 2033
- Figure 17: South America US Dairy Packaging Industry Revenue Share (%), by Country 2025 & 2033
- Figure 18: Europe US Dairy Packaging Industry Revenue (billion), by Material Type 2025 & 2033
- Figure 19: Europe US Dairy Packaging Industry Revenue Share (%), by Material Type 2025 & 2033
- Figure 20: Europe US Dairy Packaging Industry Revenue (billion), by Product Type 2025 & 2033
- Figure 21: Europe US Dairy Packaging Industry Revenue Share (%), by Product Type 2025 & 2033
- Figure 22: Europe US Dairy Packaging Industry Revenue (billion), by Packaging Type 2025 & 2033
- Figure 23: Europe US Dairy Packaging Industry Revenue Share (%), by Packaging Type 2025 & 2033
- Figure 24: Europe US Dairy Packaging Industry Revenue (billion), by Country 2025 & 2033
- Figure 25: Europe US Dairy Packaging Industry Revenue Share (%), by Country 2025 & 2033
- Figure 26: Middle East & Africa US Dairy Packaging Industry Revenue (billion), by Material Type 2025 & 2033
- Figure 27: Middle East & Africa US Dairy Packaging Industry Revenue Share (%), by Material Type 2025 & 2033
- Figure 28: Middle East & Africa US Dairy Packaging Industry Revenue (billion), by Product Type 2025 & 2033
- Figure 29: Middle East & Africa US Dairy Packaging Industry Revenue Share (%), by Product Type 2025 & 2033
- Figure 30: Middle East & Africa US Dairy Packaging Industry Revenue (billion), by Packaging Type 2025 & 2033
- Figure 31: Middle East & Africa US Dairy Packaging Industry Revenue Share (%), by Packaging Type 2025 & 2033
- Figure 32: Middle East & Africa US Dairy Packaging Industry Revenue (billion), by Country 2025 & 2033
- Figure 33: Middle East & Africa US Dairy Packaging Industry Revenue Share (%), by Country 2025 & 2033
- Figure 34: Asia Pacific US Dairy Packaging Industry Revenue (billion), by Material Type 2025 & 2033
- Figure 35: Asia Pacific US Dairy Packaging Industry Revenue Share (%), by Material Type 2025 & 2033
- Figure 36: Asia Pacific US Dairy Packaging Industry Revenue (billion), by Product Type 2025 & 2033
- Figure 37: Asia Pacific US Dairy Packaging Industry Revenue Share (%), by Product Type 2025 & 2033
- Figure 38: Asia Pacific US Dairy Packaging Industry Revenue (billion), by Packaging Type 2025 & 2033
- Figure 39: Asia Pacific US Dairy Packaging Industry Revenue Share (%), by Packaging Type 2025 & 2033
- Figure 40: Asia Pacific US Dairy Packaging Industry Revenue (billion), by Country 2025 & 2033
- Figure 41: Asia Pacific US Dairy Packaging Industry Revenue Share (%), by Country 2025 & 2033
List of Tables
- Table 1: Global US Dairy Packaging Industry Revenue billion Forecast, by Material Type 2020 & 2033
- Table 2: Global US Dairy Packaging Industry Revenue billion Forecast, by Product Type 2020 & 2033
- Table 3: Global US Dairy Packaging Industry Revenue billion Forecast, by Packaging Type 2020 & 2033
- Table 4: Global US Dairy Packaging Industry Revenue billion Forecast, by Region 2020 & 2033
- Table 5: Global US Dairy Packaging Industry Revenue billion Forecast, by Material Type 2020 & 2033
- Table 6: Global US Dairy Packaging Industry Revenue billion Forecast, by Product Type 2020 & 2033
- Table 7: Global US Dairy Packaging Industry Revenue billion Forecast, by Packaging Type 2020 & 2033
- Table 8: Global US Dairy Packaging Industry Revenue billion Forecast, by Country 2020 & 2033
- Table 9: United States US Dairy Packaging Industry Revenue (billion) Forecast, by Application 2020 & 2033
- Table 10: Canada US Dairy Packaging Industry Revenue (billion) Forecast, by Application 2020 & 2033
- Table 11: Mexico US Dairy Packaging Industry Revenue (billion) Forecast, by Application 2020 & 2033
- Table 12: Global US Dairy Packaging Industry Revenue billion Forecast, by Material Type 2020 & 2033
- Table 13: Global US Dairy Packaging Industry Revenue billion Forecast, by Product Type 2020 & 2033
- Table 14: Global US Dairy Packaging Industry Revenue billion Forecast, by Packaging Type 2020 & 2033
- Table 15: Global US Dairy Packaging Industry Revenue billion Forecast, by Country 2020 & 2033
- Table 16: Brazil US Dairy Packaging Industry Revenue (billion) Forecast, by Application 2020 & 2033
- Table 17: Argentina US Dairy Packaging Industry Revenue (billion) Forecast, by Application 2020 & 2033
- Table 18: Rest of South America US Dairy Packaging Industry Revenue (billion) Forecast, by Application 2020 & 2033
- Table 19: Global US Dairy Packaging Industry Revenue billion Forecast, by Material Type 2020 & 2033
- Table 20: Global US Dairy Packaging Industry Revenue billion Forecast, by Product Type 2020 & 2033
- Table 21: Global US Dairy Packaging Industry Revenue billion Forecast, by Packaging Type 2020 & 2033
- Table 22: Global US Dairy Packaging Industry Revenue billion Forecast, by Country 2020 & 2033
- Table 23: United Kingdom US Dairy Packaging Industry Revenue (billion) Forecast, by Application 2020 & 2033
- Table 24: Germany US Dairy Packaging Industry Revenue (billion) Forecast, by Application 2020 & 2033
- Table 25: France US Dairy Packaging Industry Revenue (billion) Forecast, by Application 2020 & 2033
- Table 26: Italy US Dairy Packaging Industry Revenue (billion) Forecast, by Application 2020 & 2033
- Table 27: Spain US Dairy Packaging Industry Revenue (billion) Forecast, by Application 2020 & 2033
- Table 28: Russia US Dairy Packaging Industry Revenue (billion) Forecast, by Application 2020 & 2033
- Table 29: Benelux US Dairy Packaging Industry Revenue (billion) Forecast, by Application 2020 & 2033
- Table 30: Nordics US Dairy Packaging Industry Revenue (billion) Forecast, by Application 2020 & 2033
- Table 31: Rest of Europe US Dairy Packaging Industry Revenue (billion) Forecast, by Application 2020 & 2033
- Table 32: Global US Dairy Packaging Industry Revenue billion Forecast, by Material Type 2020 & 2033
- Table 33: Global US Dairy Packaging Industry Revenue billion Forecast, by Product Type 2020 & 2033
- Table 34: Global US Dairy Packaging Industry Revenue billion Forecast, by Packaging Type 2020 & 2033
- Table 35: Global US Dairy Packaging Industry Revenue billion Forecast, by Country 2020 & 2033
- Table 36: Turkey US Dairy Packaging Industry Revenue (billion) Forecast, by Application 2020 & 2033
- Table 37: Israel US Dairy Packaging Industry Revenue (billion) Forecast, by Application 2020 & 2033
- Table 38: GCC US Dairy Packaging Industry Revenue (billion) Forecast, by Application 2020 & 2033
- Table 39: North Africa US Dairy Packaging Industry Revenue (billion) Forecast, by Application 2020 & 2033
- Table 40: South Africa US Dairy Packaging Industry Revenue (billion) Forecast, by Application 2020 & 2033
- Table 41: Rest of Middle East & Africa US Dairy Packaging Industry Revenue (billion) Forecast, by Application 2020 & 2033
- Table 42: Global US Dairy Packaging Industry Revenue billion Forecast, by Material Type 2020 & 2033
- Table 43: Global US Dairy Packaging Industry Revenue billion Forecast, by Product Type 2020 & 2033
- Table 44: Global US Dairy Packaging Industry Revenue billion Forecast, by Packaging Type 2020 & 2033
- Table 45: Global US Dairy Packaging Industry Revenue billion Forecast, by Country 2020 & 2033
- Table 46: China US Dairy Packaging Industry Revenue (billion) Forecast, by Application 2020 & 2033
- Table 47: India US Dairy Packaging Industry Revenue (billion) Forecast, by Application 2020 & 2033
- Table 48: Japan US Dairy Packaging Industry Revenue (billion) Forecast, by Application 2020 & 2033
- Table 49: South Korea US Dairy Packaging Industry Revenue (billion) Forecast, by Application 2020 & 2033
- Table 50: ASEAN US Dairy Packaging Industry Revenue (billion) Forecast, by Application 2020 & 2033
- Table 51: Oceania US Dairy Packaging Industry Revenue (billion) Forecast, by Application 2020 & 2033
- Table 52: Rest of Asia Pacific US Dairy Packaging Industry Revenue (billion) Forecast, by Application 2020 & 2033
Frequently Asked Questions
1. What is the projected Compound Annual Growth Rate (CAGR) of the US Dairy Packaging Industry?
The projected CAGR is approximately 2.7%.
2. Which companies are prominent players in the US Dairy Packaging Industry?
Key companies in the market include Polytainers Inc, Ball Corporation, Amcor Plc, Altium Packaging LLC (Loews Corporation), Berry Global Group Inc, Winpak Ltd, International Paper Company, Smurfit Kappa Group PLC, Tetra Pak International SA*List Not Exhaustive, Sealed Air Corporation, Huhtamaki Oyj.
3. What are the main segments of the US Dairy Packaging Industry?
The market segments include Material Type, Product Type, Packaging Type.
4. Can you provide details about the market size?
The market size is estimated to be USD 33.9 billion as of 2022.
5. What are some drivers contributing to market growth?
Increasing Consumer Preference Toward Protein-based Products; Increasing Adoption of In-house Packaging Methods; Increasing Adoption of Packages Incorporating Small Portion Size.
6. What are the notable trends driving market growth?
Increasing Consumer Preference Toward Protein-based Products.
7. Are there any restraints impacting market growth?
Greenhouse Gas Emission due to Dairy Activities Leading to Legislative Issues.
8. Can you provide examples of recent developments in the market?
September 2022: The DairySeal range from Amcor Rigid Packaging (ARP) contains ClearCor, an advanced PET barrier. The DairySeal series of packaging may be produced using up to 80% recyclable materials while still providing the brand with better flavor and function. The DairySeal line in PET provides businesses with simple access to e-commerce and convenience store distribution channels, where round, firm plastic bottles are intended to fit on refrigerator shelves.
9. What pricing options are available for accessing the report?
Pricing options include single-user, multi-user, and enterprise licenses priced at USD 3800, USD 4500, and USD 5800 respectively.
10. Is the market size provided in terms of value or volume?
The market size is provided in terms of value, measured in billion.
11. Are there any specific market keywords associated with the report?
Yes, the market keyword associated with the report is "US Dairy Packaging Industry," which aids in identifying and referencing the specific market segment covered.
12. How do I determine which pricing option suits my needs best?
The pricing options vary based on user requirements and access needs. Individual users may opt for single-user licenses, while businesses requiring broader access may choose multi-user or enterprise licenses for cost-effective access to the report.
13. Are there any additional resources or data provided in the US Dairy Packaging Industry report?
While the report offers comprehensive insights, it's advisable to review the specific contents or supplementary materials provided to ascertain if additional resources or data are available.
14. How can I stay updated on further developments or reports in the US Dairy Packaging Industry?
To stay informed about further developments, trends, and reports in the US Dairy Packaging Industry, consider subscribing to industry newsletters, following relevant companies and organizations, or regularly checking reputable industry news sources and publications.
Methodology
Step 1 - Identification of Relevant Samples Size from Population Database


Step 2 - Approaches for Defining Global Market Size (Value, Volume* & Price*)

Note*: In applicable scenarios
Step 3 - Data Sources
Primary Research
- Web Analytics
- Survey Reports
- Research Institute
- Latest Research Reports
- Opinion Leaders
Secondary Research
- Annual Reports
- White Paper
- Latest Press Release
- Industry Association
- Paid Database
- Investor Presentations

Step 4 - Data Triangulation
Involves using different sources of information in order to increase the validity of a study
These sources are likely to be stakeholders in a program - participants, other researchers, program staff, other community members, and so on.
Then we put all data in single framework & apply various statistical tools to find out the dynamic on the market.
During the analysis stage, feedback from the stakeholder groups would be compared to determine areas of agreement as well as areas of divergence