

Key Insights
The US aerosol can market is poised for robust expansion, projected to reach $12.56 billion in 2025, driven by a CAGR of 5.75% through 2033. This growth is fueled by an increasing consumer demand for convenience and efficacy across various sectors, most notably in cosmetic and personal care, where a surge in premium and specialized products necessitates sophisticated packaging solutions. The pharmaceutical and veterinary segments are also contributing significantly, driven by the development of metered-dose inhalers and topical sprays. Furthermore, the inherent safety and precise dispensing capabilities of aerosol cans make them an attractive option for household cleaning products and paints and varnishes. Emerging economies and evolving consumer preferences for user-friendly application methods will continue to propel this market forward.
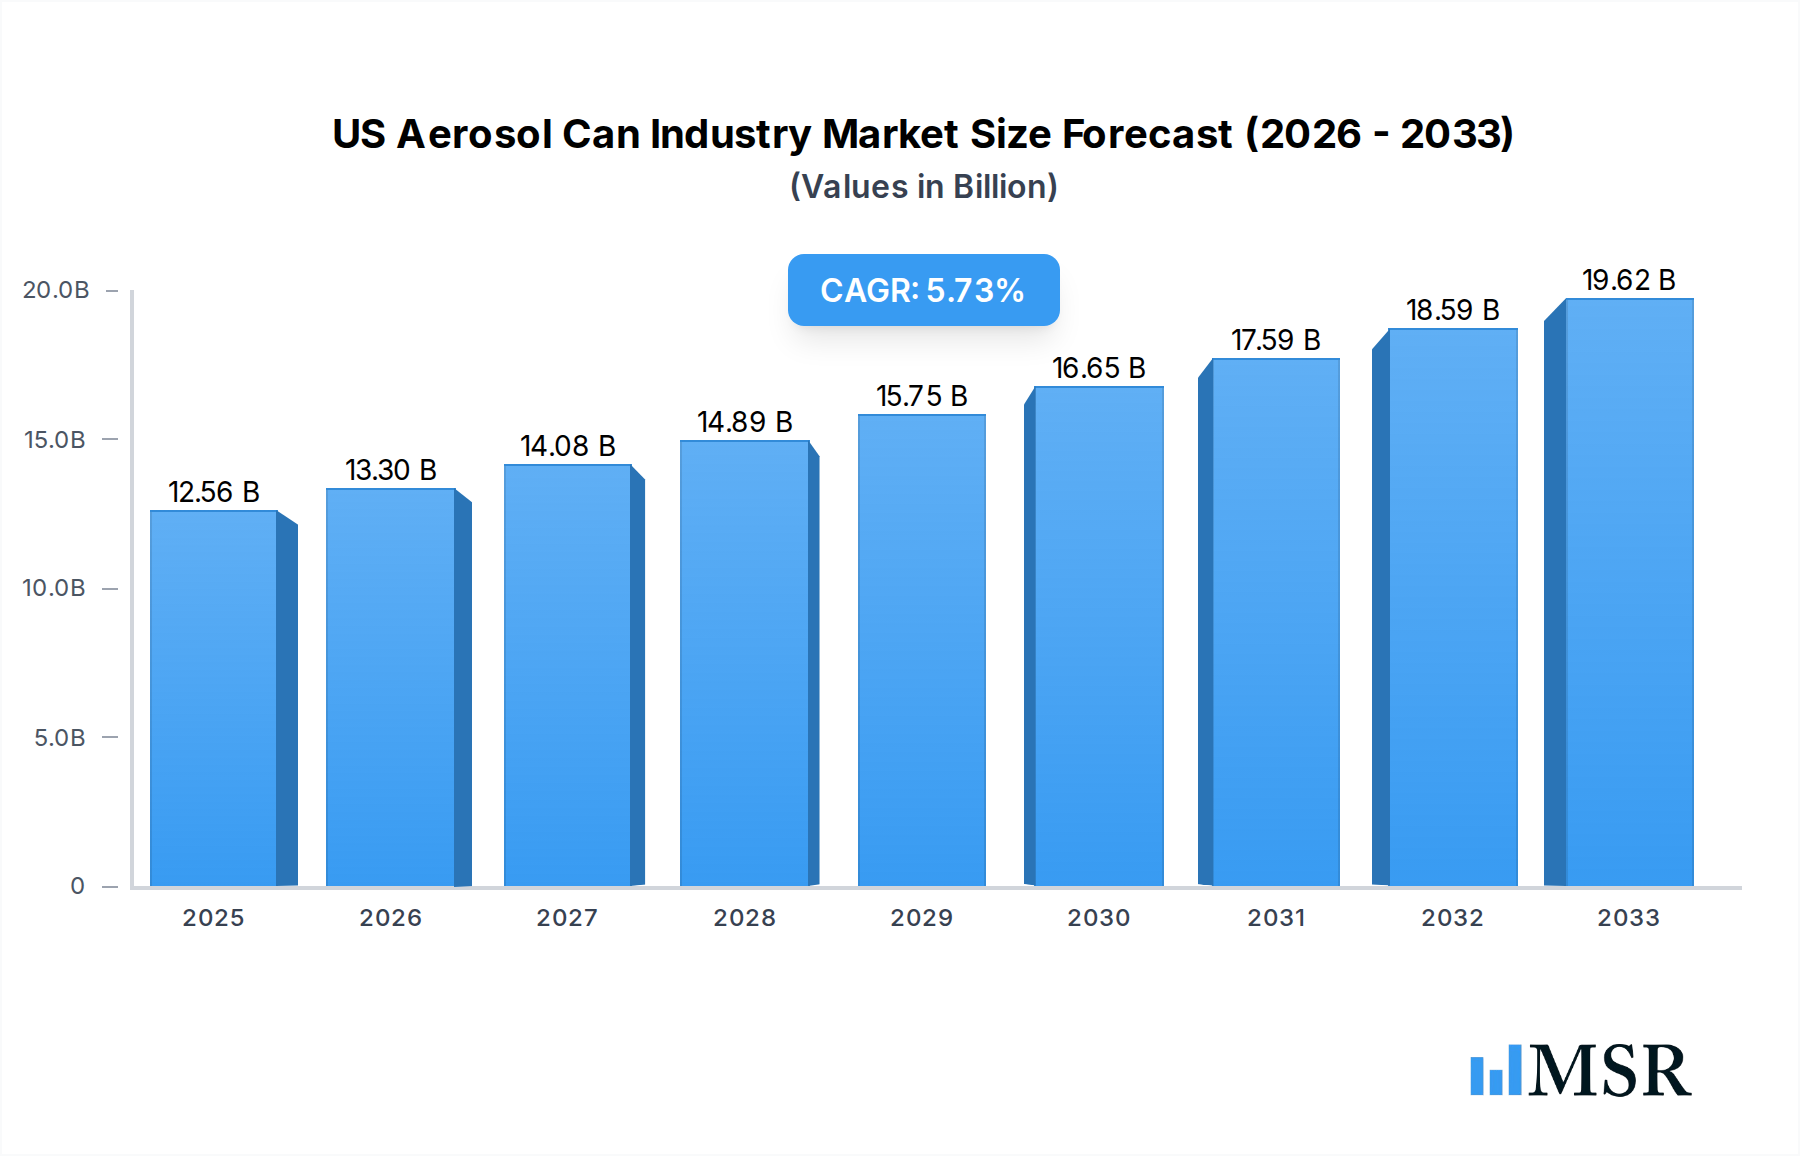
US Aerosol Can Industry Market Size (In Billion)
Despite the overall positive trajectory, the market faces certain headwinds. Rising raw material costs, particularly for aluminum and steel, could impact profit margins for manufacturers and potentially influence pricing strategies. Stringent environmental regulations concerning the production and disposal of aerosol cans, coupled with a growing consumer preference for sustainable packaging alternatives, present a significant challenge. However, innovations in material science, such as the development of lighter and more recyclable aluminum alloys, alongside advancements in propellants, are mitigating these restraints. The industry is actively investing in research and development to address environmental concerns and enhance product performance, ensuring continued relevance and growth in the long term.

US Aerosol Can Industry Company Market Share
This comprehensive report provides an in-depth analysis of the US aerosol can industry, a critical sector underpinning numerous consumer and industrial markets. Spanning the historical period from 2019 to 2024 and projecting growth through 2033, with a base and estimated year of 2025, this study offers actionable insights for aerosol can manufacturers, packaging suppliers, and end-user industries. Discover market size estimations projected to reach multi-billion dollar valuations, CAGR forecasts, and the competitive landscape, including key players like CCL Container Inc, Exal Corporation, Ball Corporation, Crown Holdings Inc, and Mauser Packaging Solutions. We dissect market concentration, identify growth drivers, explore product and segment dominance, and outline emerging opportunities within the aluminum aerosol cans, steel-tinplate aerosol cans, and other materials segments.
US Aerosol Can Industry Market Concentration & Dynamics
The US aerosol can industry exhibits a moderate to high market concentration, with a few dominant players like Ball Corporation and Crown Holdings Inc holding significant market shares. These leaders leverage economies of scale, advanced manufacturing technologies, and strong distribution networks to maintain their positions. Innovation ecosystems are thriving, driven by a growing demand for sustainable packaging solutions and enhanced product functionality. Regulatory frameworks, particularly concerning environmental impact and material safety, are evolving, influencing manufacturing processes and material choices. The threat of substitute products, such as pumps and trigger sprays, remains, but aerosol cans continue to offer unique benefits in dispensing and product preservation. End-user trends, especially the surge in demand from the cosmetic, personal care, and household segments, are significantly shaping market dynamics. Mergers and acquisitions (M&A) are a recurring theme, with strategic consolidations aimed at expanding market reach, acquiring innovative technologies, and optimizing supply chains. For instance, M&A deal counts are anticipated to remain consistent, reflecting ongoing industry consolidation. The overall market share distribution is dynamic, with key players continually vying for greater influence.
US Aerosol Can Industry Industry Insights & Trends
The US aerosol can industry is poised for robust growth, driven by a confluence of factors. The projected market size is expected to reach hundreds of billions by 2033, with a projected Compound Annual Growth Rate (CAGR) in the mid-single digits. Key growth drivers include the sustained demand for convenience and portability, particularly in the rapidly expanding cosmetic and personal care sector, and the increasing preference for efficient and controlled dispensing in household products and paints and varnishes. Technological disruptions are playing a crucial role, with advancements in can manufacturing, including thinner gauges of aluminum and steel-tinplate, leading to lighter and more sustainable packaging options. Innovations in valve and actuator technology are enhancing user experience and product performance, catering to specific application needs. Evolving consumer behaviors are further fueling market expansion; consumers are increasingly prioritizing products with premium packaging that reflects brand value and offers ease of use. The shift towards eco-friendly and recyclable materials is a paramount trend, prompting manufacturers to invest in sustainable production processes and explore alternative materials. The pharmaceutical/veterinary and automotive/industrial segments also present significant growth opportunities, driven by the need for sterile and controlled delivery of active ingredients and specialized industrial coatings. The overall market trajectory indicates a sustained upward trend, supported by strong fundamental demand and ongoing innovation.
Key Markets & Segments Leading US Aerosol Can Industry
The US aerosol can industry is characterized by distinct regional and segment-specific dominance. The Cosmetic and Personal Care segment consistently leads, driven by robust consumer spending, the perpetual demand for beauty and grooming products, and the efficacy of aerosol packaging for sprays, mousses, and deodorants. Its dominance is further bolstered by the trend towards premiumization and the visual appeal of aerosol cans in retail environments.
Product Type Dominance:
- Aluminum Aerosol Cans: This sub-segment holds a commanding position, largely due to its lightweight nature, corrosion resistance, and high recyclability. The cosmetic and personal care sector heavily favors aluminum for its premium feel and compatibility with a wide range of formulations. The household segment also contributes significantly to aluminum can demand.
- Steel-Tinplate Aerosol Cans: While facing competition from aluminum, steel-tinplate remains a strong contender, particularly in cost-sensitive applications and for products requiring higher pressure containment. The paints and varnishes and automotive/industrial sectors are significant consumers, benefiting from steel's durability and affordability.
- Other Materials: This segment is growing, encompassing innovative materials and composites, driven by the increasing focus on sustainability and specialized performance requirements.
End-User Dominance:
- Cosmetic and Personal Care: This is the undisputed leader, fueled by fashion trends, innovation in product formulation, and a growing global consumer base. The demand for sprays, foams, and other dispensed products ensures consistent high volume.
- Household: The convenience and effectiveness of aerosol cans for cleaning products, air fresheners, and insecticides contribute to this segment's substantial market share.
- Paints and Varnishes: Aerosol application offers precision and ease for DIY enthusiasts and professionals alike, making it a vital segment for this product type.
- Pharmaceutical/Veterinary: The sterile and controlled delivery capabilities of aerosol cans are crucial for inhalers, topical sprays, and veterinary medications, driving steady demand.
- Automotive/Industrial: Aerosolized lubricants, degreasers, and specialized coatings are indispensable in maintenance and repair operations across these sectors.
Economic growth, consumer disposable income, and infrastructure development are key underlying drivers supporting the dominance of these segments.
US Aerosol Can Industry Product Developments
Product innovations in the US aerosol can industry are primarily focused on enhancing sustainability, functionality, and safety. Manufacturers are developing lighter-weight aluminum and steel cans through advanced metal forming techniques and thinner material gauges, reducing raw material consumption and carbon footprint. Innovations in aerosol valve and actuator technology are enabling more precise dispensing, reduced propellant usage, and improved user experience across diverse applications. For instance, Bag-on-Valve (BOV) systems are gaining traction for their ability to dispense viscous or sensitive products without direct contact with propellants. Furthermore, the development of aerosol cans with improved barrier properties and compatibility with a wider range of challenging formulations, including water-based products, is expanding their applicability and market relevance. The competitive edge is increasingly derived from a combination of material science, engineering ingenuity, and a commitment to environmental stewardship.
Challenges in the US Aerosol Can Industry Market
The US aerosol can industry faces several significant challenges that could impact its growth trajectory.
- Regulatory Hurdles: Evolving environmental regulations regarding propellants, volatile organic compounds (VOCs), and recyclability place pressure on manufacturers to innovate and adapt their production processes.
- Supply Chain Volatility: Fluctuations in the cost and availability of raw materials, such as aluminum and steel, can significantly impact production costs and profitability, leading to price instability.
- Competitive Pressures: Intense competition from both established players and emerging manufacturers, coupled with the threat from alternative dispensing technologies like pumps and trigger sprays, necessitates continuous innovation and cost optimization.
- Public Perception: Negative perceptions surrounding aerosol propellants, although largely outdated with modern formulations, can sometimes influence consumer choices.
- Environmental Concerns: Increasing scrutiny over the environmental impact of manufacturing processes and end-of-life disposal of aerosol cans requires ongoing investment in sustainable practices.
Forces Driving US Aerosol Can Industry Growth
Several powerful forces are driving the expansion of the US aerosol can industry.
- Consumer Convenience and Portability: Aerosol cans offer unparalleled convenience for on-the-go applications, a key driver for the personal care and household product markets.
- Technological Advancements: Innovations in can manufacturing, material science, and valve technology are leading to lighter, more sustainable, and more efficient aerosol packaging solutions, broadening their applicability.
- Growth in End-User Markets: The booming cosmetic and personal care industry, coupled with steady demand from household, pharmaceutical/veterinary, and automotive/industrial sectors, provides a strong foundation for sustained growth.
- Focus on Hygiene and Safety: The controlled dispensing mechanism of aerosol cans offers a hygienic way to deliver products, especially relevant in the wake of increased public health awareness.
- Sustainability Initiatives: The industry's increasing commitment to using recycled materials and developing more environmentally friendly propellants and packaging is aligning with consumer and regulatory demands, creating new avenues for growth.
Challenges in the US Aerosol Can Industry Market
The long-term growth catalysts for the US aerosol can industry are deeply rooted in its ability to adapt and innovate. A paramount catalyst is the continued push for sustainable packaging solutions. This includes the development and wider adoption of cans made from higher percentages of recycled aluminum and steel, as well as exploring bio-based or compostable materials for certain components. Secondly, advancements in aerosol technology will unlock new product categories and improve existing ones; this encompasses ultra-low GWP (Global Warming Potential) propellants, smarter valve systems for precision dispensing, and even integrated electronic components for product authentication or usage tracking. Strategic partnerships and collaborations between aerosol can manufacturers, formulators, and brand owners will foster co-innovation, leading to tailor-made packaging solutions that address specific product needs and market demands. Finally, expanding into untapped or niche markets, such as specialized industrial applications requiring controlled dispensing or novel pharmaceutical delivery systems, presents significant long-term growth potential.
Emerging Opportunities in US Aerosol Can Industry
The US aerosol can industry is brimming with emerging opportunities driven by evolving consumer preferences and technological advancements. The growing demand for eco-friendly and sustainable packaging presents a significant avenue for growth, with increasing interest in cans made from recycled materials and the development of lower GWP propellants. Furthermore, the innovation in dispensing technology is opening doors to new applications, such as highly precise pharmaceutical sprays, advanced cosmetic formulations, and specialized industrial coatings. The rise of e-commerce also creates opportunities for robust and safe aerosol packaging that can withstand the rigors of shipping. The increasing focus on health and wellness is driving demand for aerosolized personal care products with natural ingredients and innovative delivery systems. Additionally, the exploration of smart packaging solutions with integrated sensors or track-and-trace capabilities represents a futuristic opportunity for enhanced consumer engagement and supply chain management.
Leading Players in the US Aerosol Can Industry Sector
- Ball Corporation
- Crown Holdings Inc
- CCL Container Inc
- Exal Corporation
- Mauser Packaging Solutions
Key Milestones in US Aerosol Can Industry Industry
- 2019: Increased focus on sustainability driving R&D for low-GWP propellants.
- 2020: Pandemic surge in demand for household disinfectants and sanitizers in aerosol format.
- 2021: Growing adoption of aluminum aerosol cans due to recyclability and lightweight properties.
- 2022: Advancements in Bag-on-Valve (BOV) technology expanding applications beyond traditional propellants.
- 2023: Increased investment in recycling infrastructure and recycled content for aerosol cans.
- 2024: Emerging interest in smart aerosol packaging with integrated sensors and tracking capabilities.
Strategic Outlook for US Aerosol Can Industry Market
The strategic outlook for the US aerosol can industry is characterized by a sustained trajectory of growth, underpinned by innovation and adaptation. Key accelerators include the industry's proactive response to environmental demands through advancements in sustainable materials and propellants. Continued investment in R&D for enhanced dispensing technologies will unlock novel applications, particularly in the high-growth personal care, pharmaceutical, and industrial segments. Furthermore, strategic collaborations with formulators and brand owners will foster customized solutions, strengthening market penetration and customer loyalty. The industry is well-positioned to capitalize on evolving consumer preferences for convenience, safety, and sustainability, ensuring its relevance and continued expansion in the coming years, with projected market growth reaching multi-billion dollar valuations.
US Aerosol Can Industry Segmentation
-
1. Product type
- 1.1. Aluminum
- 1.2. Steel-Tinplate
- 1.3. Other Materials
-
2. End-User
- 2.1. Cosmetic and Personal Care
- 2.2. Household
- 2.3. Pharmaceutical/Veterinary
- 2.4. Paints and Varnishes
- 2.5. Automotive/Industrial
- 2.6. Other End Users
US Aerosol Can Industry Segmentation By Geography
-
1. North America
- 1.1. United States
- 1.2. Canada
- 1.3. Mexico
-
2. South America
- 2.1. Brazil
- 2.2. Argentina
- 2.3. Rest of South America
-
3. Europe
- 3.1. United Kingdom
- 3.2. Germany
- 3.3. France
- 3.4. Italy
- 3.5. Spain
- 3.6. Russia
- 3.7. Benelux
- 3.8. Nordics
- 3.9. Rest of Europe
-
4. Middle East & Africa
- 4.1. Turkey
- 4.2. Israel
- 4.3. GCC
- 4.4. North Africa
- 4.5. South Africa
- 4.6. Rest of Middle East & Africa
-
5. Asia Pacific
- 5.1. China
- 5.2. India
- 5.3. Japan
- 5.4. South Korea
- 5.5. ASEAN
- 5.6. Oceania
- 5.7. Rest of Asia Pacific
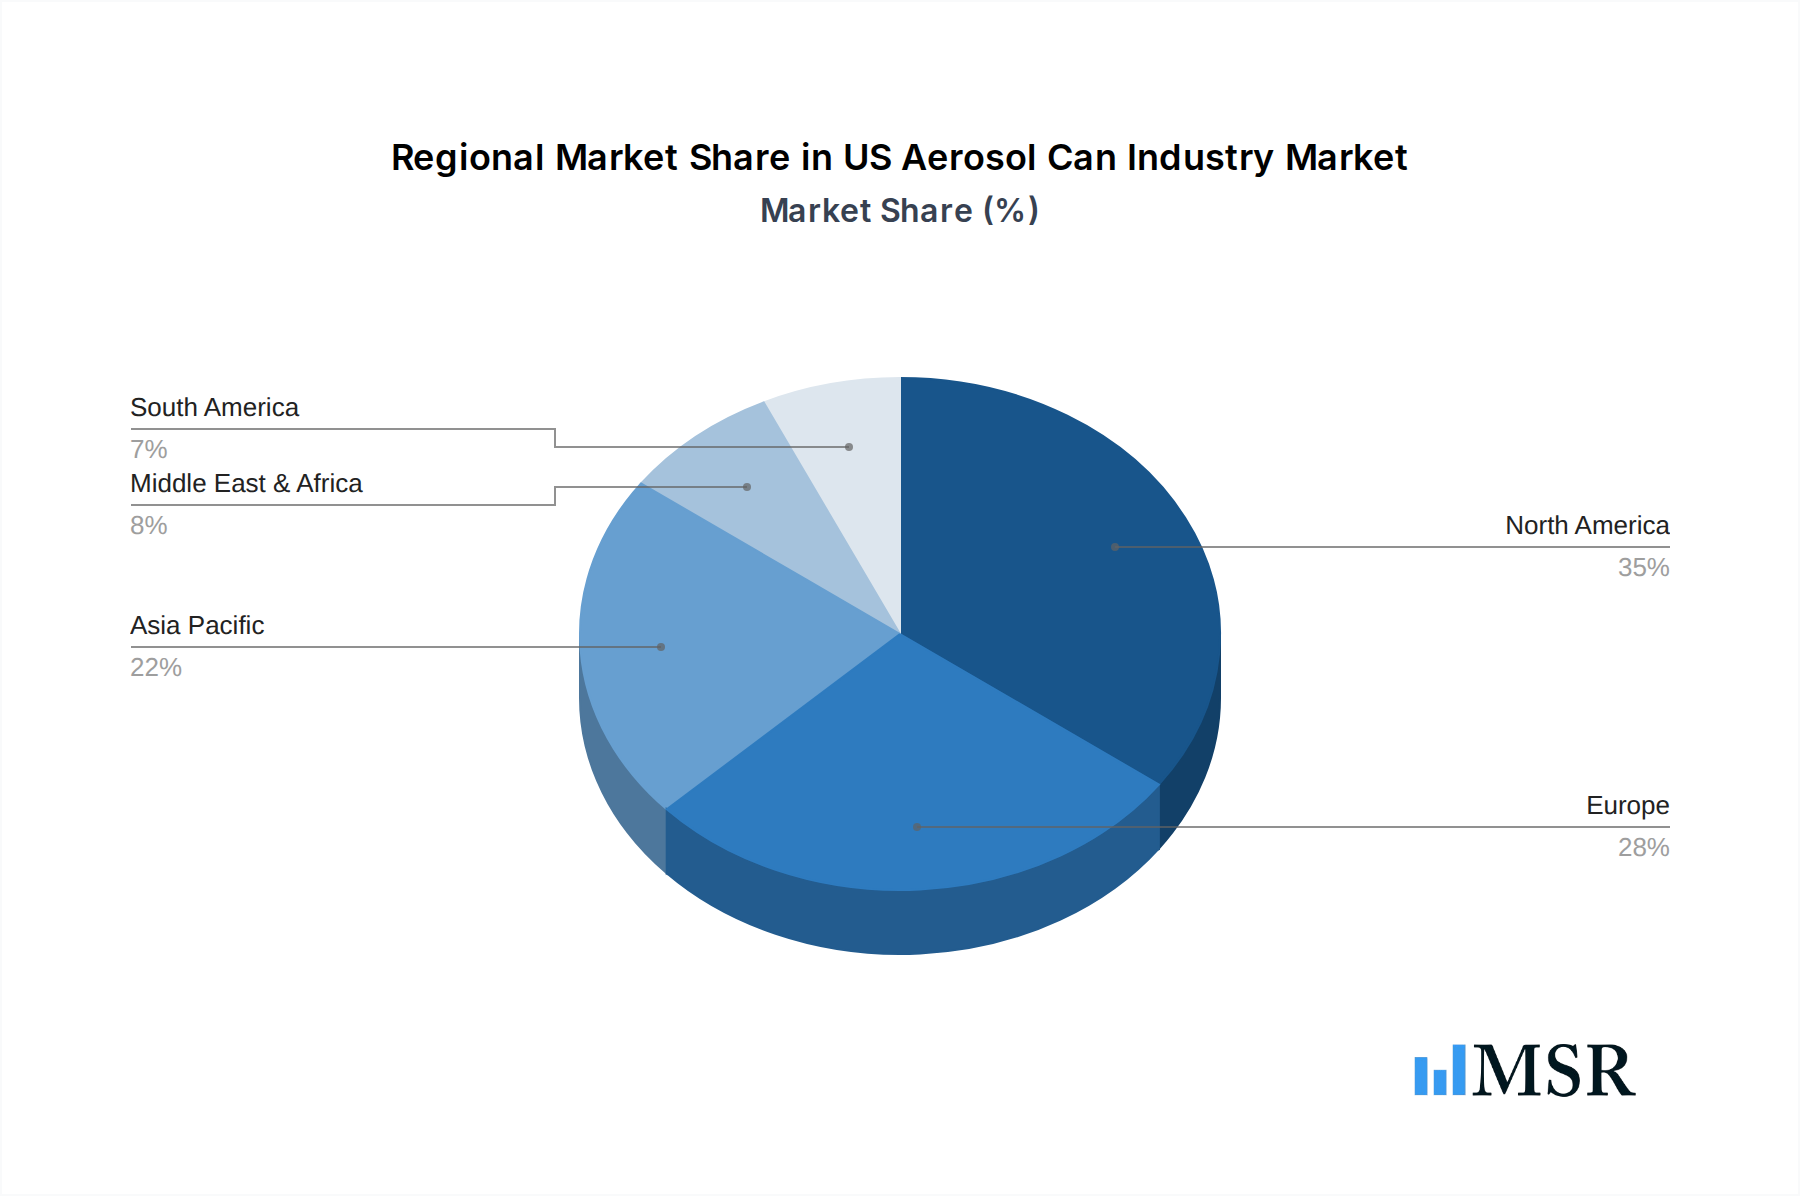
US Aerosol Can Industry Regional Market Share
Geographic Coverage of US Aerosol Can Industry
US Aerosol Can Industry REPORT HIGHLIGHTS
| Aspects | Details |
|---|---|
| Study Period | 2020-2034 |
| Base Year | 2025 |
| Estimated Year | 2026 |
| Forecast Period | 2026-2034 |
| Historical Period | 2020-2025 |
| Growth Rate | CAGR of 5.75% from 2020-2034 |
| Segmentation |
|
Table of Contents
- 1. Introduction
- 1.1. Research Scope
- 1.2. Market Segmentation
- 1.3. Research Objective
- 1.4. Definitions and Assumptions
- 2. Executive Summary
- 2.1. Market Snapshot
- 3. Market Dynamics
- 3.1. Market Drivers
- 3.2. Market Restrains
- 3.3. Market Trends
- 3.4. Market Opportunities
- 4. Market Factor Analysis
- 4.1. Porters Five Forces
- 4.1.1. Bargaining Power of Suppliers
- 4.1.2. Bargaining Power of Buyers
- 4.1.3. Threat of New Entrants
- 4.1.4. Threat of Substitutes
- 4.1.5. Competitive Rivalry
- 4.2. PESTEL analysis
- 4.3. BCG Analysis
- 4.3.1. Stars (High Growth, High Market Share)
- 4.3.2. Cash Cows (Low Growth, High Market Share)
- 4.3.3. Question Mark (High Growth, Low Market Share)
- 4.3.4. Dogs (Low Growth, Low Market Share)
- 4.4. Ansoff Matrix Analysis
- 4.5. Supply Chain Analysis
- 4.6. Regulatory Landscape
- 4.7. Current Market Potential and Opportunity Assessment (TAM–SAM–SOM Framework)
- 4.8. MSR Analyst Note
- 4.1. Porters Five Forces
- 5. Market Analysis, Insights and Forecast 2021-2033
- 5.1. Market Analysis, Insights and Forecast - by Product type
- 5.1.1. Aluminum
- 5.1.2. Steel-Tinplate
- 5.1.3. Other Materials
- 5.2. Market Analysis, Insights and Forecast - by End-User
- 5.2.1. Cosmetic and Personal Care
- 5.2.2. Household
- 5.2.3. Pharmaceutical/Veterinary
- 5.2.4. Paints and Varnishes
- 5.2.5. Automotive/Industrial
- 5.2.6. Other End Users
- 5.3. Market Analysis, Insights and Forecast - by Region
- 5.3.1. North America
- 5.3.2. South America
- 5.3.3. Europe
- 5.3.4. Middle East & Africa
- 5.3.5. Asia Pacific
- 5.1. Market Analysis, Insights and Forecast - by Product type
- 6. Global US Aerosol Can Industry Analysis, Insights and Forecast, 2021-2033
- 6.1. Market Analysis, Insights and Forecast - by Product type
- 6.1.1. Aluminum
- 6.1.2. Steel-Tinplate
- 6.1.3. Other Materials
- 6.2. Market Analysis, Insights and Forecast - by End-User
- 6.2.1. Cosmetic and Personal Care
- 6.2.2. Household
- 6.2.3. Pharmaceutical/Veterinary
- 6.2.4. Paints and Varnishes
- 6.2.5. Automotive/Industrial
- 6.2.6. Other End Users
- 6.1. Market Analysis, Insights and Forecast - by Product type
- 7. North America US Aerosol Can Industry Analysis, Insights and Forecast, 2020-2032
- 7.1. Market Analysis, Insights and Forecast - by Product type
- 7.1.1. Aluminum
- 7.1.2. Steel-Tinplate
- 7.1.3. Other Materials
- 7.2. Market Analysis, Insights and Forecast - by End-User
- 7.2.1. Cosmetic and Personal Care
- 7.2.2. Household
- 7.2.3. Pharmaceutical/Veterinary
- 7.2.4. Paints and Varnishes
- 7.2.5. Automotive/Industrial
- 7.2.6. Other End Users
- 7.1. Market Analysis, Insights and Forecast - by Product type
- 8. South America US Aerosol Can Industry Analysis, Insights and Forecast, 2020-2032
- 8.1. Market Analysis, Insights and Forecast - by Product type
- 8.1.1. Aluminum
- 8.1.2. Steel-Tinplate
- 8.1.3. Other Materials
- 8.2. Market Analysis, Insights and Forecast - by End-User
- 8.2.1. Cosmetic and Personal Care
- 8.2.2. Household
- 8.2.3. Pharmaceutical/Veterinary
- 8.2.4. Paints and Varnishes
- 8.2.5. Automotive/Industrial
- 8.2.6. Other End Users
- 8.1. Market Analysis, Insights and Forecast - by Product type
- 9. Europe US Aerosol Can Industry Analysis, Insights and Forecast, 2020-2032
- 9.1. Market Analysis, Insights and Forecast - by Product type
- 9.1.1. Aluminum
- 9.1.2. Steel-Tinplate
- 9.1.3. Other Materials
- 9.2. Market Analysis, Insights and Forecast - by End-User
- 9.2.1. Cosmetic and Personal Care
- 9.2.2. Household
- 9.2.3. Pharmaceutical/Veterinary
- 9.2.4. Paints and Varnishes
- 9.2.5. Automotive/Industrial
- 9.2.6. Other End Users
- 9.1. Market Analysis, Insights and Forecast - by Product type
- 10. Middle East & Africa US Aerosol Can Industry Analysis, Insights and Forecast, 2020-2032
- 10.1. Market Analysis, Insights and Forecast - by Product type
- 10.1.1. Aluminum
- 10.1.2. Steel-Tinplate
- 10.1.3. Other Materials
- 10.2. Market Analysis, Insights and Forecast - by End-User
- 10.2.1. Cosmetic and Personal Care
- 10.2.2. Household
- 10.2.3. Pharmaceutical/Veterinary
- 10.2.4. Paints and Varnishes
- 10.2.5. Automotive/Industrial
- 10.2.6. Other End Users
- 10.1. Market Analysis, Insights and Forecast - by Product type
- 11. Asia Pacific US Aerosol Can Industry Analysis, Insights and Forecast, 2020-2032
- 11.1. Market Analysis, Insights and Forecast - by Product type
- 11.1.1. Aluminum
- 11.1.2. Steel-Tinplate
- 11.1.3. Other Materials
- 11.2. Market Analysis, Insights and Forecast - by End-User
- 11.2.1. Cosmetic and Personal Care
- 11.2.2. Household
- 11.2.3. Pharmaceutical/Veterinary
- 11.2.4. Paints and Varnishes
- 11.2.5. Automotive/Industrial
- 11.2.6. Other End Users
- 11.1. Market Analysis, Insights and Forecast - by Product type
- 12. Competitive Analysis
- 12.1. Company Profiles
- 12.1.1 CCL Container Inc *List Not Exhaustive
- 12.1.1.1. Company Overview
- 12.1.1.2. Products
- 12.1.1.3. Company Financials
- 12.1.1.4. SWOT Analysis
- 12.1.2 Exal Corporation
- 12.1.2.1. Company Overview
- 12.1.2.2. Products
- 12.1.2.3. Company Financials
- 12.1.2.4. SWOT Analysis
- 12.1.3 Ball Corporation
- 12.1.3.1. Company Overview
- 12.1.3.2. Products
- 12.1.3.3. Company Financials
- 12.1.3.4. SWOT Analysis
- 12.1.4 Crown Holdings Inc
- 12.1.4.1. Company Overview
- 12.1.4.2. Products
- 12.1.4.3. Company Financials
- 12.1.4.4. SWOT Analysis
- 12.1.5 Mauser Packaging Solutions
- 12.1.5.1. Company Overview
- 12.1.5.2. Products
- 12.1.5.3. Company Financials
- 12.1.5.4. SWOT Analysis
- 12.1.1 CCL Container Inc *List Not Exhaustive
- 12.2. Market Entropy
- 12.2.1 Company's Key Areas Served
- 12.2.2 Recent Developments
- 12.3. Company Market Share Analysis 2025
- 12.3.1 Top 5 Companies Market Share Analysis
- 12.3.2 Top 3 Companies Market Share Analysis
- 12.4. List of Potential Customers
- 13. Research Methodology
List of Figures
- Figure 1: Global US Aerosol Can Industry Revenue Breakdown (billion, %) by Region 2025 & 2033
- Figure 2: North America US Aerosol Can Industry Revenue (billion), by Product type 2025 & 2033
- Figure 3: North America US Aerosol Can Industry Revenue Share (%), by Product type 2025 & 2033
- Figure 4: North America US Aerosol Can Industry Revenue (billion), by End-User 2025 & 2033
- Figure 5: North America US Aerosol Can Industry Revenue Share (%), by End-User 2025 & 2033
- Figure 6: North America US Aerosol Can Industry Revenue (billion), by Country 2025 & 2033
- Figure 7: North America US Aerosol Can Industry Revenue Share (%), by Country 2025 & 2033
- Figure 8: South America US Aerosol Can Industry Revenue (billion), by Product type 2025 & 2033
- Figure 9: South America US Aerosol Can Industry Revenue Share (%), by Product type 2025 & 2033
- Figure 10: South America US Aerosol Can Industry Revenue (billion), by End-User 2025 & 2033
- Figure 11: South America US Aerosol Can Industry Revenue Share (%), by End-User 2025 & 2033
- Figure 12: South America US Aerosol Can Industry Revenue (billion), by Country 2025 & 2033
- Figure 13: South America US Aerosol Can Industry Revenue Share (%), by Country 2025 & 2033
- Figure 14: Europe US Aerosol Can Industry Revenue (billion), by Product type 2025 & 2033
- Figure 15: Europe US Aerosol Can Industry Revenue Share (%), by Product type 2025 & 2033
- Figure 16: Europe US Aerosol Can Industry Revenue (billion), by End-User 2025 & 2033
- Figure 17: Europe US Aerosol Can Industry Revenue Share (%), by End-User 2025 & 2033
- Figure 18: Europe US Aerosol Can Industry Revenue (billion), by Country 2025 & 2033
- Figure 19: Europe US Aerosol Can Industry Revenue Share (%), by Country 2025 & 2033
- Figure 20: Middle East & Africa US Aerosol Can Industry Revenue (billion), by Product type 2025 & 2033
- Figure 21: Middle East & Africa US Aerosol Can Industry Revenue Share (%), by Product type 2025 & 2033
- Figure 22: Middle East & Africa US Aerosol Can Industry Revenue (billion), by End-User 2025 & 2033
- Figure 23: Middle East & Africa US Aerosol Can Industry Revenue Share (%), by End-User 2025 & 2033
- Figure 24: Middle East & Africa US Aerosol Can Industry Revenue (billion), by Country 2025 & 2033
- Figure 25: Middle East & Africa US Aerosol Can Industry Revenue Share (%), by Country 2025 & 2033
- Figure 26: Asia Pacific US Aerosol Can Industry Revenue (billion), by Product type 2025 & 2033
- Figure 27: Asia Pacific US Aerosol Can Industry Revenue Share (%), by Product type 2025 & 2033
- Figure 28: Asia Pacific US Aerosol Can Industry Revenue (billion), by End-User 2025 & 2033
- Figure 29: Asia Pacific US Aerosol Can Industry Revenue Share (%), by End-User 2025 & 2033
- Figure 30: Asia Pacific US Aerosol Can Industry Revenue (billion), by Country 2025 & 2033
- Figure 31: Asia Pacific US Aerosol Can Industry Revenue Share (%), by Country 2025 & 2033
List of Tables
- Table 1: Global US Aerosol Can Industry Revenue billion Forecast, by Product type 2020 & 2033
- Table 2: Global US Aerosol Can Industry Revenue billion Forecast, by End-User 2020 & 2033
- Table 3: Global US Aerosol Can Industry Revenue billion Forecast, by Region 2020 & 2033
- Table 4: Global US Aerosol Can Industry Revenue billion Forecast, by Product type 2020 & 2033
- Table 5: Global US Aerosol Can Industry Revenue billion Forecast, by End-User 2020 & 2033
- Table 6: Global US Aerosol Can Industry Revenue billion Forecast, by Country 2020 & 2033
- Table 7: United States US Aerosol Can Industry Revenue (billion) Forecast, by Application 2020 & 2033
- Table 8: Canada US Aerosol Can Industry Revenue (billion) Forecast, by Application 2020 & 2033
- Table 9: Mexico US Aerosol Can Industry Revenue (billion) Forecast, by Application 2020 & 2033
- Table 10: Global US Aerosol Can Industry Revenue billion Forecast, by Product type 2020 & 2033
- Table 11: Global US Aerosol Can Industry Revenue billion Forecast, by End-User 2020 & 2033
- Table 12: Global US Aerosol Can Industry Revenue billion Forecast, by Country 2020 & 2033
- Table 13: Brazil US Aerosol Can Industry Revenue (billion) Forecast, by Application 2020 & 2033
- Table 14: Argentina US Aerosol Can Industry Revenue (billion) Forecast, by Application 2020 & 2033
- Table 15: Rest of South America US Aerosol Can Industry Revenue (billion) Forecast, by Application 2020 & 2033
- Table 16: Global US Aerosol Can Industry Revenue billion Forecast, by Product type 2020 & 2033
- Table 17: Global US Aerosol Can Industry Revenue billion Forecast, by End-User 2020 & 2033
- Table 18: Global US Aerosol Can Industry Revenue billion Forecast, by Country 2020 & 2033
- Table 19: United Kingdom US Aerosol Can Industry Revenue (billion) Forecast, by Application 2020 & 2033
- Table 20: Germany US Aerosol Can Industry Revenue (billion) Forecast, by Application 2020 & 2033
- Table 21: France US Aerosol Can Industry Revenue (billion) Forecast, by Application 2020 & 2033
- Table 22: Italy US Aerosol Can Industry Revenue (billion) Forecast, by Application 2020 & 2033
- Table 23: Spain US Aerosol Can Industry Revenue (billion) Forecast, by Application 2020 & 2033
- Table 24: Russia US Aerosol Can Industry Revenue (billion) Forecast, by Application 2020 & 2033
- Table 25: Benelux US Aerosol Can Industry Revenue (billion) Forecast, by Application 2020 & 2033
- Table 26: Nordics US Aerosol Can Industry Revenue (billion) Forecast, by Application 2020 & 2033
- Table 27: Rest of Europe US Aerosol Can Industry Revenue (billion) Forecast, by Application 2020 & 2033
- Table 28: Global US Aerosol Can Industry Revenue billion Forecast, by Product type 2020 & 2033
- Table 29: Global US Aerosol Can Industry Revenue billion Forecast, by End-User 2020 & 2033
- Table 30: Global US Aerosol Can Industry Revenue billion Forecast, by Country 2020 & 2033
- Table 31: Turkey US Aerosol Can Industry Revenue (billion) Forecast, by Application 2020 & 2033
- Table 32: Israel US Aerosol Can Industry Revenue (billion) Forecast, by Application 2020 & 2033
- Table 33: GCC US Aerosol Can Industry Revenue (billion) Forecast, by Application 2020 & 2033
- Table 34: North Africa US Aerosol Can Industry Revenue (billion) Forecast, by Application 2020 & 2033
- Table 35: South Africa US Aerosol Can Industry Revenue (billion) Forecast, by Application 2020 & 2033
- Table 36: Rest of Middle East & Africa US Aerosol Can Industry Revenue (billion) Forecast, by Application 2020 & 2033
- Table 37: Global US Aerosol Can Industry Revenue billion Forecast, by Product type 2020 & 2033
- Table 38: Global US Aerosol Can Industry Revenue billion Forecast, by End-User 2020 & 2033
- Table 39: Global US Aerosol Can Industry Revenue billion Forecast, by Country 2020 & 2033
- Table 40: China US Aerosol Can Industry Revenue (billion) Forecast, by Application 2020 & 2033
- Table 41: India US Aerosol Can Industry Revenue (billion) Forecast, by Application 2020 & 2033
- Table 42: Japan US Aerosol Can Industry Revenue (billion) Forecast, by Application 2020 & 2033
- Table 43: South Korea US Aerosol Can Industry Revenue (billion) Forecast, by Application 2020 & 2033
- Table 44: ASEAN US Aerosol Can Industry Revenue (billion) Forecast, by Application 2020 & 2033
- Table 45: Oceania US Aerosol Can Industry Revenue (billion) Forecast, by Application 2020 & 2033
- Table 46: Rest of Asia Pacific US Aerosol Can Industry Revenue (billion) Forecast, by Application 2020 & 2033
Frequently Asked Questions
1. What is the projected Compound Annual Growth Rate (CAGR) of the US Aerosol Can Industry?
The projected CAGR is approximately 5.75%.
2. Which companies are prominent players in the US Aerosol Can Industry?
Key companies in the market include CCL Container Inc *List Not Exhaustive, Exal Corporation, Ball Corporation, Crown Holdings Inc, Mauser Packaging Solutions.
3. What are the main segments of the US Aerosol Can Industry?
The market segments include Product type, End-User.
4. Can you provide details about the market size?
The market size is estimated to be USD 12.56 billion as of 2022.
5. What are some drivers contributing to market growth?
; Growing Demand from the Cosmetic Industry.
6. What are the notable trends driving market growth?
Aluminum Cans to Register Highest Growth.
7. Are there any restraints impacting market growth?
; Increasing Competition from Substitute Packaging.
8. Can you provide examples of recent developments in the market?
N/A
9. What pricing options are available for accessing the report?
Pricing options include single-user, multi-user, and enterprise licenses priced at USD 3800, USD 4500, and USD 5800 respectively.
10. Is the market size provided in terms of value or volume?
The market size is provided in terms of value, measured in billion.
11. Are there any specific market keywords associated with the report?
Yes, the market keyword associated with the report is "US Aerosol Can Industry," which aids in identifying and referencing the specific market segment covered.
12. How do I determine which pricing option suits my needs best?
The pricing options vary based on user requirements and access needs. Individual users may opt for single-user licenses, while businesses requiring broader access may choose multi-user or enterprise licenses for cost-effective access to the report.
13. Are there any additional resources or data provided in the US Aerosol Can Industry report?
While the report offers comprehensive insights, it's advisable to review the specific contents or supplementary materials provided to ascertain if additional resources or data are available.
14. How can I stay updated on further developments or reports in the US Aerosol Can Industry?
To stay informed about further developments, trends, and reports in the US Aerosol Can Industry, consider subscribing to industry newsletters, following relevant companies and organizations, or regularly checking reputable industry news sources and publications.
Methodology
Step 1 - Identification of Relevant Samples Size from Population Database


Step 2 - Approaches for Defining Global Market Size (Value, Volume* & Price*)

Note*: In applicable scenarios
Step 3 - Data Sources
Primary Research
- Web Analytics
- Survey Reports
- Research Institute
- Latest Research Reports
- Opinion Leaders
Secondary Research
- Annual Reports
- White Paper
- Latest Press Release
- Industry Association
- Paid Database
- Investor Presentations

Step 4 - Data Triangulation
Involves using different sources of information in order to increase the validity of a study
These sources are likely to be stakeholders in a program - participants, other researchers, program staff, other community members, and so on.
Then we put all data in single framework & apply various statistical tools to find out the dynamic on the market.
During the analysis stage, feedback from the stakeholder groups would be compared to determine areas of agreement as well as areas of divergence