

Key Insights
The Oncology Information Systems (OIS) market is experiencing robust growth, driven by the increasing global cancer prevalence, widespread adoption of Electronic Health Records (EHRs), and the critical need for effective cancer care management. The market, projected to reach $963.88 million in 2025, is forecast to grow at a Compound Annual Growth Rate (CAGR) of 7.56% from 2025 to 2033. Key growth factors include the demand for improved patient outcomes through advanced data management, streamlined clinical workflows, enhanced precision oncology initiatives, and the increasing adoption of value-based care models. Technological advancements, particularly the integration of Artificial Intelligence (AI) and Machine Learning (ML) for predictive analytics and personalized treatment planning, are significant catalysts for market expansion. The market is segmented by end-user (hospitals, research centers, specialty clinics), product & service (software, service), and application (medical, radiation, surgical oncology). North America currently leads the market due to its advanced healthcare infrastructure and high OIS adoption rates, while the Asia-Pacific region is anticipated to witness substantial growth driven by rising healthcare expenditure and cancer incidence.
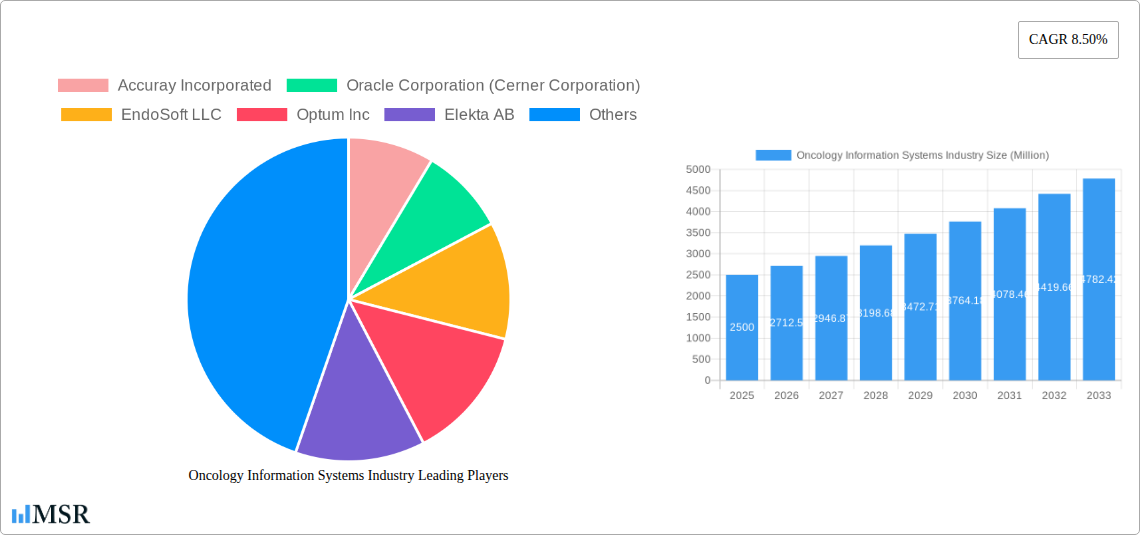
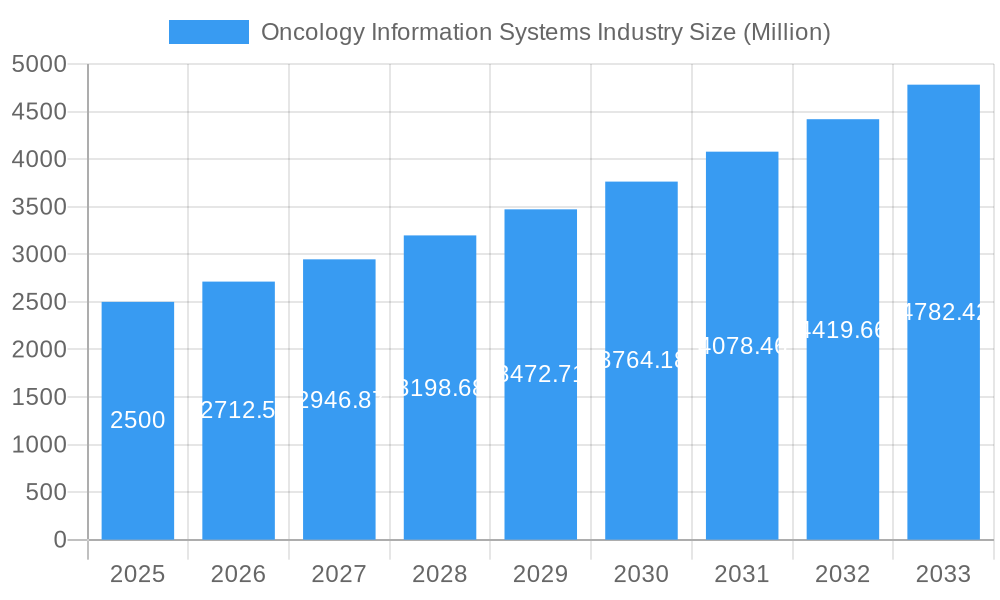
Oncology Information Systems Industry Market Size (In Million)
Market restraints include the high initial investment costs for OIS implementation, challenges in integrating diverse systems within existing healthcare infrastructures, and data security and privacy concerns. However, the long-term benefits of enhanced patient care, reduced administrative burdens, and improved research capabilities are expected to overcome these initial hurdles. Leading players in the OIS market, such as Accuray Incorporated, Oracle Corporation (Cerner Corporation), and Elekta AB, are actively investing in research and development to innovate and expand their market presence. The competitive landscape features established companies and emerging innovators offering specialized solutions for the oncology sector. Future growth will be contingent on successful AI and ML integration, the development of user-friendly interfaces, and the creation of interoperable systems for seamless data exchange across healthcare settings.
Oncology Information Systems Industry Company Market Share
This comprehensive report offers detailed analysis and invaluable insights into the Oncology Information Systems market for stakeholders, investors, and industry professionals. Covering a study period from 2019 to 2033, with a base year of 2025 and a forecast period of 2025-2033, the report includes historical data (2019-2024) and future projections. It delves into market dynamics, key segments, leading players (including Accuray Incorporated, Oracle Corporation (Cerner Corporation), EndoSoft LLC, Optum Inc, Elekta AB, Siemens Healthineers AG (Varian Medical Systems), RaySearch Laboratories AB, CureMD Corporation, F Hoffmann-La Roche Ltd (Flatiron Health Inc), McKesson Corporation, BMSI Partners Inc, and MIM Software Inc), and emerging trends shaping this dynamic landscape. The global market is projected to reach $963.88 million by 2033, with a CAGR of 7.56%.
Oncology Information Systems Industry Market Concentration & Dynamics
The Oncology Information Systems market exhibits a moderately concentrated landscape, with a few major players holding significant market share. However, the presence of numerous smaller, specialized companies fosters innovation and competition. The market is characterized by a dynamic interplay of factors including:
- Market Concentration: The top 5 players account for approximately xx% of the global market share in 2025.
- Innovation Ecosystems: Significant investments in R&D drive the development of advanced analytics, AI-powered diagnostic tools, and cloud-based solutions.
- Regulatory Frameworks: Compliance with HIPAA, GDPR, and other regulations significantly influences market dynamics and shapes vendor strategies.
- Substitute Products: The absence of direct substitutes for specialized oncology information systems maintains market stability. However, the increasing availability of general-purpose Electronic Health Records (EHR) systems creates indirect competition.
- End-User Trends: Hospitals remain the dominant end-users, followed by research centers and specialty clinics. A growing preference for cloud-based solutions and integrated platforms is reshaping the market.
- M&A Activities: The historical period (2019-2024) witnessed xx mergers and acquisitions (M&A) deals, signifying consolidation and strategic expansion within the industry. This trend is expected to continue, further shaping market concentration.
Oncology Information Systems Industry Industry Insights & Trends
The Oncology Information Systems market is experiencing robust growth driven by several factors. The increasing prevalence of cancer globally fuels demand for efficient and accurate information management systems. Technological advancements, such as the integration of artificial intelligence (AI) and machine learning (ML) for improved diagnostics and treatment planning, are further accelerating market expansion. This technological disruption is transforming oncology care delivery, leading to enhanced patient outcomes and improved operational efficiency for healthcare providers. The rising adoption of cloud-based solutions, coupled with increasing government investments in healthcare IT infrastructure, supports market expansion. The market size was valued at xx Million in 2025 and is projected to reach xx Million by 2033, reflecting a substantial growth trajectory.
Key Markets & Segments Leading Oncology Information Systems Industry
The North American region currently dominates the Oncology Information Systems market, driven by high healthcare expenditure, advanced technological infrastructure, and a robust regulatory framework. However, Asia Pacific is expected to witness the fastest growth during the forecast period, fueled by increasing cancer prevalence, rising government initiatives, and growing healthcare IT investment.
By End-User: Hospitals constitute the largest segment due to their higher adoption rates and sophisticated IT infrastructure. However, the Research Centers and Specialty Clinics segments are also experiencing significant growth, driven by increasing research activities and a demand for specialized data analytics.
By Product & Service: The Software segment dominates, with increasing demand for advanced analytical tools and integrated platforms. The Service segment is also growing rapidly, driven by the need for system implementation, maintenance, and specialized support.
By Application: Medical Oncology represents the largest application segment, followed by Radiation Oncology and Surgical Oncology. Growth is primarily driven by the expanding treatment modalities in each application area and increasing data-driven treatment protocols.
Growth Drivers:
- Increased cancer prevalence and higher diagnostic rates.
- Growing government initiatives and funding for healthcare IT infrastructure.
- Advances in technology and data analytics.
- Rising demand for improved treatment planning, precision oncology, and personalized medicine.
- Increasing adoption of cloud-based solutions and integrated platforms.
Oncology Information Systems Industry Product Developments
Recent product innovations focus on improving data integration, enhancing analytical capabilities, and streamlining clinical workflows. The integration of AI and ML into oncology information systems is a key development, enabling more accurate diagnosis, personalized treatment planning, and improved patient outcomes. Cloud-based solutions offer scalability and accessibility, while integrated platforms streamline data management and enhance interoperability across various healthcare settings. These advancements provide providers with competitive edges by improving efficiency, reducing costs, and providing superior patient care.
Challenges in the Oncology Information Systems Industry Market
The Oncology Information Systems market faces several challenges, including:
High implementation costs: Implementing and integrating complex systems can be expensive for healthcare providers, especially smaller clinics and research centers. This poses a barrier to adoption, particularly in regions with limited healthcare budgets.
Data security and privacy concerns: Protecting sensitive patient data is paramount. Robust security measures are crucial to ensure compliance with regulations and maintain patient trust. Breaches can lead to significant financial and reputational damage.
Interoperability issues: Lack of standardization and interoperability between different systems can hinder data exchange and workflow efficiency. This necessitates investment in solutions that facilitate seamless data integration and exchange across various healthcare settings.
Forces Driving Oncology Information Systems Industry Growth
The Oncology Information Systems market is propelled by:
Technological advancements: AI-driven diagnostics, advanced analytics, and cloud-based solutions are significantly improving efficiency and accuracy in cancer care.
Economic factors: Increased healthcare spending and government initiatives for healthcare IT modernization create a favorable environment for market growth.
Regulatory compliance: Stricter regulations regarding data security and interoperability drive demand for advanced, compliant solutions.
Long-Term Growth Catalysts in the Oncology Information Systems Industry Market
Long-term growth hinges on continued innovation, strategic partnerships, and market expansion. The development of advanced AI-driven diagnostic tools, personalized treatment planning platforms, and seamless data integration across various healthcare settings will be key. Strategic partnerships between technology providers and healthcare institutions will accelerate adoption and market penetration. Expansion into underserved markets, particularly in developing countries, offers significant growth potential.
Emerging Opportunities in Oncology Information Systems Industry
Emerging opportunities include:
Expansion into developing markets: Many developing countries have growing cancer rates but limited access to advanced information systems.
Integration with wearable technology and telehealth: Real-time patient data monitoring can improve treatment outcomes and enable remote patient monitoring.
Development of advanced analytics and predictive modeling tools: These tools can assist in early cancer detection, personalized treatment planning, and improved prognosis.
Leading Players in the Oncology Information Systems Industry Sector
- Accuray Incorporated
- Oracle Corporation (Cerner Corporation)
- EndoSoft LLC
- Optum Inc
- Elekta AB
- Siemens Healthineers AG (Varian Medical Systems)
- RaySearch Laboratories AB
- CureMD Corporation
- F Hoffmann-La Roche Ltd (Flatiron Health Inc)
- McKesson Corporation
- BMSI Partners Inc
- MIM Software Inc
Key Milestones in Oncology Information Systems Industry Industry
May 2022: GE Healthcare partnered with RaySearch Laboratories AB to develop a new radiation therapy simulation and treatment planning workflow solution. This collaboration significantly enhances the capabilities of radiation oncology treatment planning.
May 2022: Berry Oncology launched the HIFI system, incorporating liquid biopsy technology and advanced algorithms for genetic testing and early cancer screening. This development offers enhanced diagnostic capabilities and contributes to earlier cancer detection.
Strategic Outlook for Oncology Information Systems Market
The Oncology Information Systems market is poised for significant growth, driven by technological advancements, increasing cancer prevalence, and rising healthcare spending. Strategic opportunities exist for companies that can leverage AI and ML to develop innovative solutions, improve data interoperability, and expand into underserved markets. Focusing on personalized medicine, integrating with wearable technology, and building strong partnerships with healthcare providers will be crucial for success in this dynamic market.
Oncology Information Systems Industry Segmentation
-
1. Product and Service
- 1.1. Software
- 1.2. Application
-
2. Application
- 2.1. Medical Oncology
- 2.2. Radiation Oncology
- 2.3. Surgical Oncology
-
3. End User
- 3.1. Hospitals
- 3.2. Research Centers
- 3.3. Specialty Clinics
Oncology Information Systems Industry Segmentation By Geography
-
1. North America
- 1.1. United States
- 1.2. Canada
- 1.3. Mexico
-
2. Europe
- 2.1. Germany
- 2.2. United Kingdom
- 2.3. France
- 2.4. Italy
- 2.5. Spain
- 2.6. Rest of Europe
-
3. Asia Pacific
- 3.1. China
- 3.2. Japan
- 3.3. India
- 3.4. Australia
- 3.5. South Korea
- 3.6. Rest of Asia Pacific
-
4. Middle East and Africa
- 4.1. GCC
- 4.2. South Africa
- 4.3. Rest of Middle East and Africa
-
5. South America
- 5.1. Brazil
- 5.2. Argentina
- 5.3. Rest of South America
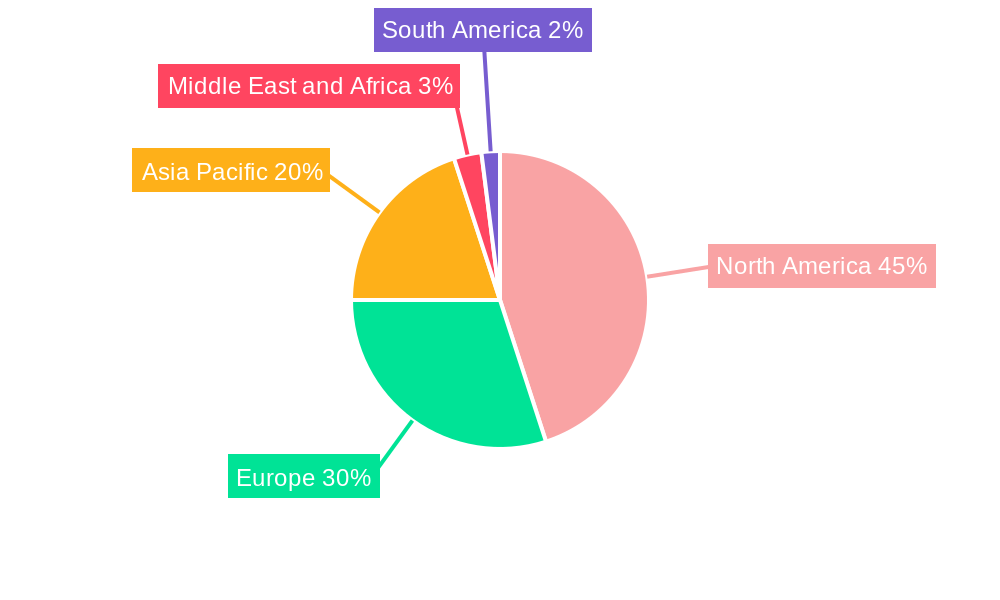
Oncology Information Systems Industry Regional Market Share
Geographic Coverage of Oncology Information Systems Industry
Oncology Information Systems Industry REPORT HIGHLIGHTS
| Aspects | Details |
|---|---|
| Study Period | 2020-2034 |
| Base Year | 2025 |
| Estimated Year | 2026 |
| Forecast Period | 2026-2034 |
| Historical Period | 2020-2025 |
| Growth Rate | CAGR of 7.56% from 2020-2034 |
| Segmentation |
|
Table of Contents
- 1. Introduction
- 1.1. Research Scope
- 1.2. Market Segmentation
- 1.3. Research Methodology
- 1.4. Definitions and Assumptions
- 2. Executive Summary
- 2.1. Introduction
- 3. Market Dynamics
- 3.1. Introduction
- 3.2. Market Drivers
- 3.2.1. Rising incidence of Cancer Worldwide; Growing Government Initiatives for Cancer Awareness
- 3.3. Market Restrains
- 3.3.1. High Cost of Cancer Therapies; Dearth of Skilled Professionals
- 3.4. Market Trends
- 3.4.1. Software Segment is Expected to Hold the Largest Market Share in the Oncology Information System Market
- 4. Market Factor Analysis
- 4.1. Porters Five Forces
- 4.2. Supply/Value Chain
- 4.3. PESTEL analysis
- 4.4. Market Entropy
- 4.5. Patent/Trademark Analysis
- 5. Global Oncology Information Systems Industry Analysis, Insights and Forecast, 2020-2032
- 5.1. Market Analysis, Insights and Forecast - by Product and Service
- 5.1.1. Software
- 5.1.2. Application
- 5.2. Market Analysis, Insights and Forecast - by Application
- 5.2.1. Medical Oncology
- 5.2.2. Radiation Oncology
- 5.2.3. Surgical Oncology
- 5.3. Market Analysis, Insights and Forecast - by End User
- 5.3.1. Hospitals
- 5.3.2. Research Centers
- 5.3.3. Specialty Clinics
- 5.4. Market Analysis, Insights and Forecast - by Region
- 5.4.1. North America
- 5.4.2. Europe
- 5.4.3. Asia Pacific
- 5.4.4. Middle East and Africa
- 5.4.5. South America
- 5.1. Market Analysis, Insights and Forecast - by Product and Service
- 6. North America Oncology Information Systems Industry Analysis, Insights and Forecast, 2020-2032
- 6.1. Market Analysis, Insights and Forecast - by Product and Service
- 6.1.1. Software
- 6.1.2. Application
- 6.2. Market Analysis, Insights and Forecast - by Application
- 6.2.1. Medical Oncology
- 6.2.2. Radiation Oncology
- 6.2.3. Surgical Oncology
- 6.3. Market Analysis, Insights and Forecast - by End User
- 6.3.1. Hospitals
- 6.3.2. Research Centers
- 6.3.3. Specialty Clinics
- 6.1. Market Analysis, Insights and Forecast - by Product and Service
- 7. Europe Oncology Information Systems Industry Analysis, Insights and Forecast, 2020-2032
- 7.1. Market Analysis, Insights and Forecast - by Product and Service
- 7.1.1. Software
- 7.1.2. Application
- 7.2. Market Analysis, Insights and Forecast - by Application
- 7.2.1. Medical Oncology
- 7.2.2. Radiation Oncology
- 7.2.3. Surgical Oncology
- 7.3. Market Analysis, Insights and Forecast - by End User
- 7.3.1. Hospitals
- 7.3.2. Research Centers
- 7.3.3. Specialty Clinics
- 7.1. Market Analysis, Insights and Forecast - by Product and Service
- 8. Asia Pacific Oncology Information Systems Industry Analysis, Insights and Forecast, 2020-2032
- 8.1. Market Analysis, Insights and Forecast - by Product and Service
- 8.1.1. Software
- 8.1.2. Application
- 8.2. Market Analysis, Insights and Forecast - by Application
- 8.2.1. Medical Oncology
- 8.2.2. Radiation Oncology
- 8.2.3. Surgical Oncology
- 8.3. Market Analysis, Insights and Forecast - by End User
- 8.3.1. Hospitals
- 8.3.2. Research Centers
- 8.3.3. Specialty Clinics
- 8.1. Market Analysis, Insights and Forecast - by Product and Service
- 9. Middle East and Africa Oncology Information Systems Industry Analysis, Insights and Forecast, 2020-2032
- 9.1. Market Analysis, Insights and Forecast - by Product and Service
- 9.1.1. Software
- 9.1.2. Application
- 9.2. Market Analysis, Insights and Forecast - by Application
- 9.2.1. Medical Oncology
- 9.2.2. Radiation Oncology
- 9.2.3. Surgical Oncology
- 9.3. Market Analysis, Insights and Forecast - by End User
- 9.3.1. Hospitals
- 9.3.2. Research Centers
- 9.3.3. Specialty Clinics
- 9.1. Market Analysis, Insights and Forecast - by Product and Service
- 10. South America Oncology Information Systems Industry Analysis, Insights and Forecast, 2020-2032
- 10.1. Market Analysis, Insights and Forecast - by Product and Service
- 10.1.1. Software
- 10.1.2. Application
- 10.2. Market Analysis, Insights and Forecast - by Application
- 10.2.1. Medical Oncology
- 10.2.2. Radiation Oncology
- 10.2.3. Surgical Oncology
- 10.3. Market Analysis, Insights and Forecast - by End User
- 10.3.1. Hospitals
- 10.3.2. Research Centers
- 10.3.3. Specialty Clinics
- 10.1. Market Analysis, Insights and Forecast - by Product and Service
- 11. Competitive Analysis
- 11.1. Global Market Share Analysis 2025
- 11.2. Company Profiles
- 11.2.1 Accuray Incorporated
- 11.2.1.1. Overview
- 11.2.1.2. Products
- 11.2.1.3. SWOT Analysis
- 11.2.1.4. Recent Developments
- 11.2.1.5. Financials (Based on Availability)
- 11.2.2 Oracle Corporation (Cerner Corporation)
- 11.2.2.1. Overview
- 11.2.2.2. Products
- 11.2.2.3. SWOT Analysis
- 11.2.2.4. Recent Developments
- 11.2.2.5. Financials (Based on Availability)
- 11.2.3 EndoSoft LLC
- 11.2.3.1. Overview
- 11.2.3.2. Products
- 11.2.3.3. SWOT Analysis
- 11.2.3.4. Recent Developments
- 11.2.3.5. Financials (Based on Availability)
- 11.2.4 Optum Inc
- 11.2.4.1. Overview
- 11.2.4.2. Products
- 11.2.4.3. SWOT Analysis
- 11.2.4.4. Recent Developments
- 11.2.4.5. Financials (Based on Availability)
- 11.2.5 Elekta AB
- 11.2.5.1. Overview
- 11.2.5.2. Products
- 11.2.5.3. SWOT Analysis
- 11.2.5.4. Recent Developments
- 11.2.5.5. Financials (Based on Availability)
- 11.2.6 Siemens Healthineers AG (Varian Medical Systems)
- 11.2.6.1. Overview
- 11.2.6.2. Products
- 11.2.6.3. SWOT Analysis
- 11.2.6.4. Recent Developments
- 11.2.6.5. Financials (Based on Availability)
- 11.2.7 RaySearch Laboratories AB
- 11.2.7.1. Overview
- 11.2.7.2. Products
- 11.2.7.3. SWOT Analysis
- 11.2.7.4. Recent Developments
- 11.2.7.5. Financials (Based on Availability)
- 11.2.8 CureMD Corporation
- 11.2.8.1. Overview
- 11.2.8.2. Products
- 11.2.8.3. SWOT Analysis
- 11.2.8.4. Recent Developments
- 11.2.8.5. Financials (Based on Availability)
- 11.2.9 F Hoffmann-La Roche Ltd (Flatiron Health Inc )
- 11.2.9.1. Overview
- 11.2.9.2. Products
- 11.2.9.3. SWOT Analysis
- 11.2.9.4. Recent Developments
- 11.2.9.5. Financials (Based on Availability)
- 11.2.10 McKesson Corporation
- 11.2.10.1. Overview
- 11.2.10.2. Products
- 11.2.10.3. SWOT Analysis
- 11.2.10.4. Recent Developments
- 11.2.10.5. Financials (Based on Availability)
- 11.2.11 BMSI Partners Inc
- 11.2.11.1. Overview
- 11.2.11.2. Products
- 11.2.11.3. SWOT Analysis
- 11.2.11.4. Recent Developments
- 11.2.11.5. Financials (Based on Availability)
- 11.2.12 MIM Software Inc
- 11.2.12.1. Overview
- 11.2.12.2. Products
- 11.2.12.3. SWOT Analysis
- 11.2.12.4. Recent Developments
- 11.2.12.5. Financials (Based on Availability)
- 11.2.1 Accuray Incorporated
List of Figures
- Figure 1: Global Oncology Information Systems Industry Revenue Breakdown (million, %) by Region 2025 & 2033
- Figure 2: Global Oncology Information Systems Industry Volume Breakdown (K Unit, %) by Region 2025 & 2033
- Figure 3: North America Oncology Information Systems Industry Revenue (million), by Product and Service 2025 & 2033
- Figure 4: North America Oncology Information Systems Industry Volume (K Unit), by Product and Service 2025 & 2033
- Figure 5: North America Oncology Information Systems Industry Revenue Share (%), by Product and Service 2025 & 2033
- Figure 6: North America Oncology Information Systems Industry Volume Share (%), by Product and Service 2025 & 2033
- Figure 7: North America Oncology Information Systems Industry Revenue (million), by Application 2025 & 2033
- Figure 8: North America Oncology Information Systems Industry Volume (K Unit), by Application 2025 & 2033
- Figure 9: North America Oncology Information Systems Industry Revenue Share (%), by Application 2025 & 2033
- Figure 10: North America Oncology Information Systems Industry Volume Share (%), by Application 2025 & 2033
- Figure 11: North America Oncology Information Systems Industry Revenue (million), by End User 2025 & 2033
- Figure 12: North America Oncology Information Systems Industry Volume (K Unit), by End User 2025 & 2033
- Figure 13: North America Oncology Information Systems Industry Revenue Share (%), by End User 2025 & 2033
- Figure 14: North America Oncology Information Systems Industry Volume Share (%), by End User 2025 & 2033
- Figure 15: North America Oncology Information Systems Industry Revenue (million), by Country 2025 & 2033
- Figure 16: North America Oncology Information Systems Industry Volume (K Unit), by Country 2025 & 2033
- Figure 17: North America Oncology Information Systems Industry Revenue Share (%), by Country 2025 & 2033
- Figure 18: North America Oncology Information Systems Industry Volume Share (%), by Country 2025 & 2033
- Figure 19: Europe Oncology Information Systems Industry Revenue (million), by Product and Service 2025 & 2033
- Figure 20: Europe Oncology Information Systems Industry Volume (K Unit), by Product and Service 2025 & 2033
- Figure 21: Europe Oncology Information Systems Industry Revenue Share (%), by Product and Service 2025 & 2033
- Figure 22: Europe Oncology Information Systems Industry Volume Share (%), by Product and Service 2025 & 2033
- Figure 23: Europe Oncology Information Systems Industry Revenue (million), by Application 2025 & 2033
- Figure 24: Europe Oncology Information Systems Industry Volume (K Unit), by Application 2025 & 2033
- Figure 25: Europe Oncology Information Systems Industry Revenue Share (%), by Application 2025 & 2033
- Figure 26: Europe Oncology Information Systems Industry Volume Share (%), by Application 2025 & 2033
- Figure 27: Europe Oncology Information Systems Industry Revenue (million), by End User 2025 & 2033
- Figure 28: Europe Oncology Information Systems Industry Volume (K Unit), by End User 2025 & 2033
- Figure 29: Europe Oncology Information Systems Industry Revenue Share (%), by End User 2025 & 2033
- Figure 30: Europe Oncology Information Systems Industry Volume Share (%), by End User 2025 & 2033
- Figure 31: Europe Oncology Information Systems Industry Revenue (million), by Country 2025 & 2033
- Figure 32: Europe Oncology Information Systems Industry Volume (K Unit), by Country 2025 & 2033
- Figure 33: Europe Oncology Information Systems Industry Revenue Share (%), by Country 2025 & 2033
- Figure 34: Europe Oncology Information Systems Industry Volume Share (%), by Country 2025 & 2033
- Figure 35: Asia Pacific Oncology Information Systems Industry Revenue (million), by Product and Service 2025 & 2033
- Figure 36: Asia Pacific Oncology Information Systems Industry Volume (K Unit), by Product and Service 2025 & 2033
- Figure 37: Asia Pacific Oncology Information Systems Industry Revenue Share (%), by Product and Service 2025 & 2033
- Figure 38: Asia Pacific Oncology Information Systems Industry Volume Share (%), by Product and Service 2025 & 2033
- Figure 39: Asia Pacific Oncology Information Systems Industry Revenue (million), by Application 2025 & 2033
- Figure 40: Asia Pacific Oncology Information Systems Industry Volume (K Unit), by Application 2025 & 2033
- Figure 41: Asia Pacific Oncology Information Systems Industry Revenue Share (%), by Application 2025 & 2033
- Figure 42: Asia Pacific Oncology Information Systems Industry Volume Share (%), by Application 2025 & 2033
- Figure 43: Asia Pacific Oncology Information Systems Industry Revenue (million), by End User 2025 & 2033
- Figure 44: Asia Pacific Oncology Information Systems Industry Volume (K Unit), by End User 2025 & 2033
- Figure 45: Asia Pacific Oncology Information Systems Industry Revenue Share (%), by End User 2025 & 2033
- Figure 46: Asia Pacific Oncology Information Systems Industry Volume Share (%), by End User 2025 & 2033
- Figure 47: Asia Pacific Oncology Information Systems Industry Revenue (million), by Country 2025 & 2033
- Figure 48: Asia Pacific Oncology Information Systems Industry Volume (K Unit), by Country 2025 & 2033
- Figure 49: Asia Pacific Oncology Information Systems Industry Revenue Share (%), by Country 2025 & 2033
- Figure 50: Asia Pacific Oncology Information Systems Industry Volume Share (%), by Country 2025 & 2033
- Figure 51: Middle East and Africa Oncology Information Systems Industry Revenue (million), by Product and Service 2025 & 2033
- Figure 52: Middle East and Africa Oncology Information Systems Industry Volume (K Unit), by Product and Service 2025 & 2033
- Figure 53: Middle East and Africa Oncology Information Systems Industry Revenue Share (%), by Product and Service 2025 & 2033
- Figure 54: Middle East and Africa Oncology Information Systems Industry Volume Share (%), by Product and Service 2025 & 2033
- Figure 55: Middle East and Africa Oncology Information Systems Industry Revenue (million), by Application 2025 & 2033
- Figure 56: Middle East and Africa Oncology Information Systems Industry Volume (K Unit), by Application 2025 & 2033
- Figure 57: Middle East and Africa Oncology Information Systems Industry Revenue Share (%), by Application 2025 & 2033
- Figure 58: Middle East and Africa Oncology Information Systems Industry Volume Share (%), by Application 2025 & 2033
- Figure 59: Middle East and Africa Oncology Information Systems Industry Revenue (million), by End User 2025 & 2033
- Figure 60: Middle East and Africa Oncology Information Systems Industry Volume (K Unit), by End User 2025 & 2033
- Figure 61: Middle East and Africa Oncology Information Systems Industry Revenue Share (%), by End User 2025 & 2033
- Figure 62: Middle East and Africa Oncology Information Systems Industry Volume Share (%), by End User 2025 & 2033
- Figure 63: Middle East and Africa Oncology Information Systems Industry Revenue (million), by Country 2025 & 2033
- Figure 64: Middle East and Africa Oncology Information Systems Industry Volume (K Unit), by Country 2025 & 2033
- Figure 65: Middle East and Africa Oncology Information Systems Industry Revenue Share (%), by Country 2025 & 2033
- Figure 66: Middle East and Africa Oncology Information Systems Industry Volume Share (%), by Country 2025 & 2033
- Figure 67: South America Oncology Information Systems Industry Revenue (million), by Product and Service 2025 & 2033
- Figure 68: South America Oncology Information Systems Industry Volume (K Unit), by Product and Service 2025 & 2033
- Figure 69: South America Oncology Information Systems Industry Revenue Share (%), by Product and Service 2025 & 2033
- Figure 70: South America Oncology Information Systems Industry Volume Share (%), by Product and Service 2025 & 2033
- Figure 71: South America Oncology Information Systems Industry Revenue (million), by Application 2025 & 2033
- Figure 72: South America Oncology Information Systems Industry Volume (K Unit), by Application 2025 & 2033
- Figure 73: South America Oncology Information Systems Industry Revenue Share (%), by Application 2025 & 2033
- Figure 74: South America Oncology Information Systems Industry Volume Share (%), by Application 2025 & 2033
- Figure 75: South America Oncology Information Systems Industry Revenue (million), by End User 2025 & 2033
- Figure 76: South America Oncology Information Systems Industry Volume (K Unit), by End User 2025 & 2033
- Figure 77: South America Oncology Information Systems Industry Revenue Share (%), by End User 2025 & 2033
- Figure 78: South America Oncology Information Systems Industry Volume Share (%), by End User 2025 & 2033
- Figure 79: South America Oncology Information Systems Industry Revenue (million), by Country 2025 & 2033
- Figure 80: South America Oncology Information Systems Industry Volume (K Unit), by Country 2025 & 2033
- Figure 81: South America Oncology Information Systems Industry Revenue Share (%), by Country 2025 & 2033
- Figure 82: South America Oncology Information Systems Industry Volume Share (%), by Country 2025 & 2033
List of Tables
- Table 1: Global Oncology Information Systems Industry Revenue million Forecast, by Product and Service 2020 & 2033
- Table 2: Global Oncology Information Systems Industry Volume K Unit Forecast, by Product and Service 2020 & 2033
- Table 3: Global Oncology Information Systems Industry Revenue million Forecast, by Application 2020 & 2033
- Table 4: Global Oncology Information Systems Industry Volume K Unit Forecast, by Application 2020 & 2033
- Table 5: Global Oncology Information Systems Industry Revenue million Forecast, by End User 2020 & 2033
- Table 6: Global Oncology Information Systems Industry Volume K Unit Forecast, by End User 2020 & 2033
- Table 7: Global Oncology Information Systems Industry Revenue million Forecast, by Region 2020 & 2033
- Table 8: Global Oncology Information Systems Industry Volume K Unit Forecast, by Region 2020 & 2033
- Table 9: Global Oncology Information Systems Industry Revenue million Forecast, by Product and Service 2020 & 2033
- Table 10: Global Oncology Information Systems Industry Volume K Unit Forecast, by Product and Service 2020 & 2033
- Table 11: Global Oncology Information Systems Industry Revenue million Forecast, by Application 2020 & 2033
- Table 12: Global Oncology Information Systems Industry Volume K Unit Forecast, by Application 2020 & 2033
- Table 13: Global Oncology Information Systems Industry Revenue million Forecast, by End User 2020 & 2033
- Table 14: Global Oncology Information Systems Industry Volume K Unit Forecast, by End User 2020 & 2033
- Table 15: Global Oncology Information Systems Industry Revenue million Forecast, by Country 2020 & 2033
- Table 16: Global Oncology Information Systems Industry Volume K Unit Forecast, by Country 2020 & 2033
- Table 17: United States Oncology Information Systems Industry Revenue (million) Forecast, by Application 2020 & 2033
- Table 18: United States Oncology Information Systems Industry Volume (K Unit) Forecast, by Application 2020 & 2033
- Table 19: Canada Oncology Information Systems Industry Revenue (million) Forecast, by Application 2020 & 2033
- Table 20: Canada Oncology Information Systems Industry Volume (K Unit) Forecast, by Application 2020 & 2033
- Table 21: Mexico Oncology Information Systems Industry Revenue (million) Forecast, by Application 2020 & 2033
- Table 22: Mexico Oncology Information Systems Industry Volume (K Unit) Forecast, by Application 2020 & 2033
- Table 23: Global Oncology Information Systems Industry Revenue million Forecast, by Product and Service 2020 & 2033
- Table 24: Global Oncology Information Systems Industry Volume K Unit Forecast, by Product and Service 2020 & 2033
- Table 25: Global Oncology Information Systems Industry Revenue million Forecast, by Application 2020 & 2033
- Table 26: Global Oncology Information Systems Industry Volume K Unit Forecast, by Application 2020 & 2033
- Table 27: Global Oncology Information Systems Industry Revenue million Forecast, by End User 2020 & 2033
- Table 28: Global Oncology Information Systems Industry Volume K Unit Forecast, by End User 2020 & 2033
- Table 29: Global Oncology Information Systems Industry Revenue million Forecast, by Country 2020 & 2033
- Table 30: Global Oncology Information Systems Industry Volume K Unit Forecast, by Country 2020 & 2033
- Table 31: Germany Oncology Information Systems Industry Revenue (million) Forecast, by Application 2020 & 2033
- Table 32: Germany Oncology Information Systems Industry Volume (K Unit) Forecast, by Application 2020 & 2033
- Table 33: United Kingdom Oncology Information Systems Industry Revenue (million) Forecast, by Application 2020 & 2033
- Table 34: United Kingdom Oncology Information Systems Industry Volume (K Unit) Forecast, by Application 2020 & 2033
- Table 35: France Oncology Information Systems Industry Revenue (million) Forecast, by Application 2020 & 2033
- Table 36: France Oncology Information Systems Industry Volume (K Unit) Forecast, by Application 2020 & 2033
- Table 37: Italy Oncology Information Systems Industry Revenue (million) Forecast, by Application 2020 & 2033
- Table 38: Italy Oncology Information Systems Industry Volume (K Unit) Forecast, by Application 2020 & 2033
- Table 39: Spain Oncology Information Systems Industry Revenue (million) Forecast, by Application 2020 & 2033
- Table 40: Spain Oncology Information Systems Industry Volume (K Unit) Forecast, by Application 2020 & 2033
- Table 41: Rest of Europe Oncology Information Systems Industry Revenue (million) Forecast, by Application 2020 & 2033
- Table 42: Rest of Europe Oncology Information Systems Industry Volume (K Unit) Forecast, by Application 2020 & 2033
- Table 43: Global Oncology Information Systems Industry Revenue million Forecast, by Product and Service 2020 & 2033
- Table 44: Global Oncology Information Systems Industry Volume K Unit Forecast, by Product and Service 2020 & 2033
- Table 45: Global Oncology Information Systems Industry Revenue million Forecast, by Application 2020 & 2033
- Table 46: Global Oncology Information Systems Industry Volume K Unit Forecast, by Application 2020 & 2033
- Table 47: Global Oncology Information Systems Industry Revenue million Forecast, by End User 2020 & 2033
- Table 48: Global Oncology Information Systems Industry Volume K Unit Forecast, by End User 2020 & 2033
- Table 49: Global Oncology Information Systems Industry Revenue million Forecast, by Country 2020 & 2033
- Table 50: Global Oncology Information Systems Industry Volume K Unit Forecast, by Country 2020 & 2033
- Table 51: China Oncology Information Systems Industry Revenue (million) Forecast, by Application 2020 & 2033
- Table 52: China Oncology Information Systems Industry Volume (K Unit) Forecast, by Application 2020 & 2033
- Table 53: Japan Oncology Information Systems Industry Revenue (million) Forecast, by Application 2020 & 2033
- Table 54: Japan Oncology Information Systems Industry Volume (K Unit) Forecast, by Application 2020 & 2033
- Table 55: India Oncology Information Systems Industry Revenue (million) Forecast, by Application 2020 & 2033
- Table 56: India Oncology Information Systems Industry Volume (K Unit) Forecast, by Application 2020 & 2033
- Table 57: Australia Oncology Information Systems Industry Revenue (million) Forecast, by Application 2020 & 2033
- Table 58: Australia Oncology Information Systems Industry Volume (K Unit) Forecast, by Application 2020 & 2033
- Table 59: South Korea Oncology Information Systems Industry Revenue (million) Forecast, by Application 2020 & 2033
- Table 60: South Korea Oncology Information Systems Industry Volume (K Unit) Forecast, by Application 2020 & 2033
- Table 61: Rest of Asia Pacific Oncology Information Systems Industry Revenue (million) Forecast, by Application 2020 & 2033
- Table 62: Rest of Asia Pacific Oncology Information Systems Industry Volume (K Unit) Forecast, by Application 2020 & 2033
- Table 63: Global Oncology Information Systems Industry Revenue million Forecast, by Product and Service 2020 & 2033
- Table 64: Global Oncology Information Systems Industry Volume K Unit Forecast, by Product and Service 2020 & 2033
- Table 65: Global Oncology Information Systems Industry Revenue million Forecast, by Application 2020 & 2033
- Table 66: Global Oncology Information Systems Industry Volume K Unit Forecast, by Application 2020 & 2033
- Table 67: Global Oncology Information Systems Industry Revenue million Forecast, by End User 2020 & 2033
- Table 68: Global Oncology Information Systems Industry Volume K Unit Forecast, by End User 2020 & 2033
- Table 69: Global Oncology Information Systems Industry Revenue million Forecast, by Country 2020 & 2033
- Table 70: Global Oncology Information Systems Industry Volume K Unit Forecast, by Country 2020 & 2033
- Table 71: GCC Oncology Information Systems Industry Revenue (million) Forecast, by Application 2020 & 2033
- Table 72: GCC Oncology Information Systems Industry Volume (K Unit) Forecast, by Application 2020 & 2033
- Table 73: South Africa Oncology Information Systems Industry Revenue (million) Forecast, by Application 2020 & 2033
- Table 74: South Africa Oncology Information Systems Industry Volume (K Unit) Forecast, by Application 2020 & 2033
- Table 75: Rest of Middle East and Africa Oncology Information Systems Industry Revenue (million) Forecast, by Application 2020 & 2033
- Table 76: Rest of Middle East and Africa Oncology Information Systems Industry Volume (K Unit) Forecast, by Application 2020 & 2033
- Table 77: Global Oncology Information Systems Industry Revenue million Forecast, by Product and Service 2020 & 2033
- Table 78: Global Oncology Information Systems Industry Volume K Unit Forecast, by Product and Service 2020 & 2033
- Table 79: Global Oncology Information Systems Industry Revenue million Forecast, by Application 2020 & 2033
- Table 80: Global Oncology Information Systems Industry Volume K Unit Forecast, by Application 2020 & 2033
- Table 81: Global Oncology Information Systems Industry Revenue million Forecast, by End User 2020 & 2033
- Table 82: Global Oncology Information Systems Industry Volume K Unit Forecast, by End User 2020 & 2033
- Table 83: Global Oncology Information Systems Industry Revenue million Forecast, by Country 2020 & 2033
- Table 84: Global Oncology Information Systems Industry Volume K Unit Forecast, by Country 2020 & 2033
- Table 85: Brazil Oncology Information Systems Industry Revenue (million) Forecast, by Application 2020 & 2033
- Table 86: Brazil Oncology Information Systems Industry Volume (K Unit) Forecast, by Application 2020 & 2033
- Table 87: Argentina Oncology Information Systems Industry Revenue (million) Forecast, by Application 2020 & 2033
- Table 88: Argentina Oncology Information Systems Industry Volume (K Unit) Forecast, by Application 2020 & 2033
- Table 89: Rest of South America Oncology Information Systems Industry Revenue (million) Forecast, by Application 2020 & 2033
- Table 90: Rest of South America Oncology Information Systems Industry Volume (K Unit) Forecast, by Application 2020 & 2033
Frequently Asked Questions
1. What is the projected Compound Annual Growth Rate (CAGR) of the Oncology Information Systems Industry?
The projected CAGR is approximately 7.56%.
2. Which companies are prominent players in the Oncology Information Systems Industry?
Key companies in the market include Accuray Incorporated, Oracle Corporation (Cerner Corporation), EndoSoft LLC, Optum Inc, Elekta AB, Siemens Healthineers AG (Varian Medical Systems), RaySearch Laboratories AB, CureMD Corporation, F Hoffmann-La Roche Ltd (Flatiron Health Inc ), McKesson Corporation, BMSI Partners Inc, MIM Software Inc .
3. What are the main segments of the Oncology Information Systems Industry?
The market segments include Product and Service, Application, End User.
4. Can you provide details about the market size?
The market size is estimated to be USD 963.88 million as of 2022.
5. What are some drivers contributing to market growth?
Rising incidence of Cancer Worldwide; Growing Government Initiatives for Cancer Awareness.
6. What are the notable trends driving market growth?
Software Segment is Expected to Hold the Largest Market Share in the Oncology Information System Market.
7. Are there any restraints impacting market growth?
High Cost of Cancer Therapies; Dearth of Skilled Professionals.
8. Can you provide examples of recent developments in the market?
May 2022: GE Healthcare entered into an agreement with RaySearch Laboratories AB, a radiation oncology software provider, to develop a new radiation therapy simulation and treatment planning workflow solution designed to simplify how radiation will be targeted to shrink a tumor.
9. What pricing options are available for accessing the report?
Pricing options include single-user, multi-user, and enterprise licenses priced at USD 4750, USD 5250, and USD 8750 respectively.
10. Is the market size provided in terms of value or volume?
The market size is provided in terms of value, measured in million and volume, measured in K Unit.
11. Are there any specific market keywords associated with the report?
Yes, the market keyword associated with the report is "Oncology Information Systems Industry," which aids in identifying and referencing the specific market segment covered.
12. How do I determine which pricing option suits my needs best?
The pricing options vary based on user requirements and access needs. Individual users may opt for single-user licenses, while businesses requiring broader access may choose multi-user or enterprise licenses for cost-effective access to the report.
13. Are there any additional resources or data provided in the Oncology Information Systems Industry report?
While the report offers comprehensive insights, it's advisable to review the specific contents or supplementary materials provided to ascertain if additional resources or data are available.
14. How can I stay updated on further developments or reports in the Oncology Information Systems Industry?
To stay informed about further developments, trends, and reports in the Oncology Information Systems Industry, consider subscribing to industry newsletters, following relevant companies and organizations, or regularly checking reputable industry news sources and publications.
Methodology
Step 1 - Identification of Relevant Samples Size from Population Database


Step 2 - Approaches for Defining Global Market Size (Value, Volume* & Price*)

Note*: In applicable scenarios
Step 3 - Data Sources
Primary Research
- Web Analytics
- Survey Reports
- Research Institute
- Latest Research Reports
- Opinion Leaders
Secondary Research
- Annual Reports
- White Paper
- Latest Press Release
- Industry Association
- Paid Database
- Investor Presentations

Step 4 - Data Triangulation
Involves using different sources of information in order to increase the validity of a study
These sources are likely to be stakeholders in a program - participants, other researchers, program staff, other community members, and so on.
Then we put all data in single framework & apply various statistical tools to find out the dynamic on the market.
During the analysis stage, feedback from the stakeholder groups would be compared to determine areas of agreement as well as areas of divergence