

Key Insights
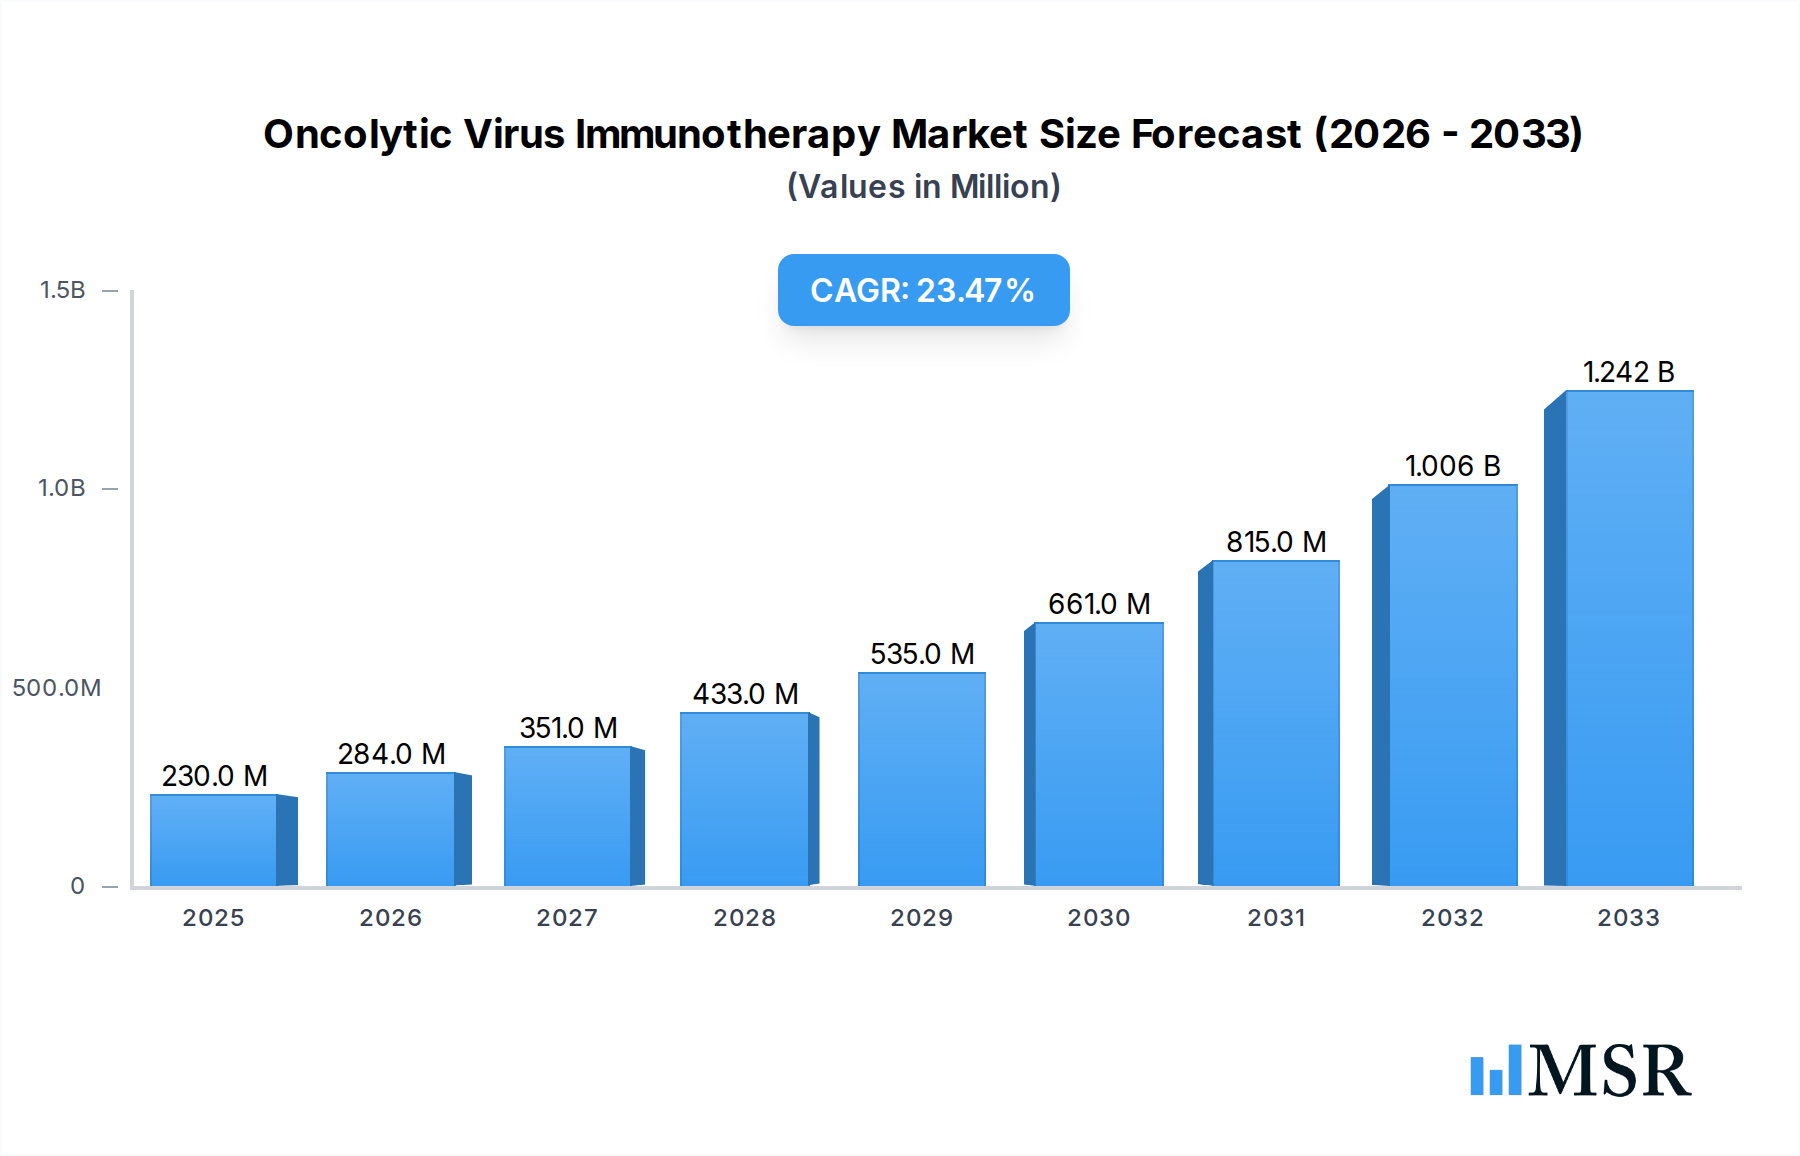
The global Oncolytic Virus Immunotherapy market is poised for significant expansion, projected to reach an estimated $0.23 billion in 2025, driven by a remarkable Compound Annual Growth Rate (CAGR) of 23.7% during the forecast period of 2025-2033. This robust growth is primarily fueled by the increasing prevalence of various cancers, the growing demand for targeted and personalized cancer treatments, and advancements in virology and genetic engineering that enhance the efficacy and safety of oncolytic viruses. The development of novel engineering oncolytic viruses, designed to selectively infect and destroy cancer cells while stimulating the body's immune response, is a major catalyst. Furthermore, the rising adoption of these innovative therapies in healthcare settings, including hospitals, clinics, and ambulatory surgical centers, underscores their growing clinical significance. Key players like Merck, Amgen, and TILT Biotherapeutics are actively investing in research and development, clinical trials, and strategic collaborations to expand their product pipelines and market reach, further accelerating market penetration. The increasing integration of oncolytic virus therapy with other cancer treatment modalities, such as chemotherapy and immunotherapy, is also a significant trend contributing to its therapeutic potential and market growth.

Oncolytic Virus Immunotherapy Market Size (In Million)
The market landscape for oncolytic virus immunotherapy is characterized by a dynamic interplay of innovation and increasing clinical validation. While wild-type oncolytic viruses offer a foundational approach, engineered oncolytic viruses represent the cutting edge, offering improved tumor selectivity, enhanced immune stimulation, and reduced off-target effects. The application of these therapies spans a broad spectrum of oncological indications, with ongoing research exploring their efficacy in various solid and hematological malignancies. The market is segmented by type into Engineering Oncolytic Viruses and Wild-Type Oncolytic Viruses, with engineered viruses expected to dominate due to their superior therapeutic profiles and ongoing technological advancements. Geographically, North America is anticipated to lead the market, owing to a well-established healthcare infrastructure, significant R&D investments, and a high incidence of cancer. However, the Asia Pacific region is expected to witness the fastest growth, driven by an expanding patient base, increasing healthcare expenditure, and a growing focus on adopting advanced cancer treatments. The market's trajectory is further shaped by strategic initiatives from leading companies to broaden access and overcome regulatory hurdles for these novel therapies.
Oncolytic Virus Immunotherapy Company Market Share
Unlock the Future of Cancer Treatment: Deep Dive into the Billion-Dollar Oncolytic Virus Immunotherapy Market
This in-depth report provides a critical examination of the global Oncolytic Virus Immunotherapy market, a rapidly advancing frontier in cancer treatment. Spanning the historical period of 2019–2024, the base year of 2025, and a comprehensive forecast period from 2025–2033, this analysis offers unparalleled insights for pharmaceutical giants, biotech innovators, investors, and healthcare providers. We delve into market concentration, industry dynamics, key market segments, product developments, challenges, growth drivers, emerging opportunities, and strategic outlooks, presenting actionable intelligence for stakeholders navigating this transformative sector. The market is projected to reach billions in value by 2033, driven by groundbreaking research and increasing adoption in clinical settings.
Oncolytic Virus Immunotherapy Market Concentration & Dynamics
The global Oncolytic Virus Immunotherapy market is characterized by a dynamic interplay of established pharmaceutical leaders and agile biotechnology innovators. Market concentration is moderate, with significant R&D investments fueling an innovation ecosystem centered around both Engineering Oncolytic Viruses and Wild-Type Oncolytic Viruses. Regulatory frameworks are evolving, with agencies like the FDA and EMA actively streamlining approval pathways for promising oncolytic virus therapies. Substitute products, primarily traditional chemotherapy and other immunotherapies, continue to pose a competitive challenge, though the unique mechanisms of action and potential for improved efficacy are driving end-user trends towards these novel agents. Mergers and acquisitions (M&A) activities are a significant feature, with over $5 billion in M&A deals recorded during the historical period, indicating consolidation and strategic partnerships aimed at expanding pipelines and market reach. Key players are actively acquiring smaller, specialized firms to gain access to cutting-edge technologies and promising drug candidates.
Oncolytic Virus Immunotherapy Industry Insights & Trends
The Oncolytic Virus Immunotherapy market is poised for exponential growth, driven by a convergence of scientific advancements, unmet clinical needs, and a growing understanding of the tumor microenvironment. The global market size for oncolytic virus therapies is projected to surpass $10 billion by 2025, with a robust Compound Annual Growth Rate (CAGR) of approximately 20% anticipated throughout the forecast period (2025–2033). Market growth drivers are multifaceted, including the increasing incidence of various cancers, the limitations of current treatment modalities, and the inherent ability of oncolytic viruses to selectively target and destroy cancer cells while stimulating a potent anti-tumor immune response. Technological disruptions are paramount, with significant progress in genetic engineering and viral vector design enhancing the efficacy, safety, and tumor-specificity of oncolytic viruses. Innovations in delivery mechanisms and combination therapies are further expanding the therapeutic potential. Evolving consumer behaviors, fueled by greater patient awareness and a demand for personalized and less toxic treatment options, are also contributing to market expansion. The focus is shifting towards therapies with improved quality of life and superior long-term outcomes, positioning oncolytic viruses as a compelling alternative. The historical period (2019–2024) witnessed substantial clinical trial successes and the initial regulatory approvals of several oncolytic virus agents, setting a strong foundation for future market penetration.
Key Markets & Segments Leading Oncolytic Virus Immunotherapy
North America, particularly the United States, currently dominates the global Oncolytic Virus Immunotherapy market, accounting for over 40% of the market share. This leadership is attributed to a robust R&D infrastructure, significant venture capital funding, a high prevalence of cancer diagnoses, and proactive regulatory pathways. Economic growth in the region supports substantial healthcare spending, enabling widespread adoption of advanced therapies.
Dominant Segments:
Application: Hospitals
- Drivers:
- Presence of specialized cancer treatment centers and research institutions.
- Access to multidisciplinary care teams essential for complex oncolytic virus treatments.
- Availability of advanced medical infrastructure and patient monitoring capabilities.
- Higher reimbursement rates for innovative therapies within hospital settings.
- Dominance Analysis: Hospitals are the primary setting for the administration of oncolytic virus immunotherapies due to the intricate nature of these treatments, often requiring intravenous infusion, careful patient monitoring, and immediate management of potential side effects. The established infrastructure and expertise within hospital oncology departments make them the natural choice for delivering these cutting-edge therapies.
- Drivers:
Type: Engineering Oncolytic Viruses
- Drivers:
- Ability to enhance tumor selectivity and reduce off-target effects through genetic modification.
- Capacity to incorporate payloads (e.g., immunomodulatory agents) for synergistic anti-tumor activity.
- Potential for improved safety profiles and predictable therapeutic outcomes.
- Ongoing research and development into next-generation engineered viral vectors.
- Dominance Analysis: Engineered oncolytic viruses are increasingly favored over their wild-type counterparts due to their enhanced precision and customizable therapeutic potential. Researchers can modify these viruses to optimize their infectivity, replication within tumor cells, and immunogenicity, leading to more effective and safer cancer treatments. This segment represents the forefront of innovation in the field.
- Drivers:
Emerging Markets and Segments:
While North America leads, the Asia-Pacific region, particularly China, is emerging as a significant growth market, driven by increasing healthcare investments, a growing cancer burden, and a surge in local biotech innovation. Europe also represents a substantial market, with Germany and the UK at the forefront of clinical research and adoption. In terms of applications, Clinics and Ambulatory Surgical Centers are expected to see increasing adoption as oncolytic virus therapies become more standardized and less complex to administer, leading to broader accessibility and cost-effectiveness. The Type segment is also witnessing a rise in combination strategies, where engineered viruses are used in conjunction with other treatment modalities.
Oncolytic Virus Immunotherapy Product Developments
Product development in Oncolytic Virus Immunotherapy is rapidly advancing, focusing on enhancing viral efficacy, tumor specificity, and patient safety. Innovations include the development of multi-armed viruses engineered to express cytokines, antibodies, or other therapeutic agents directly at the tumor site, amplifying the anti-cancer immune response. Researchers are also exploring novel viral backbones and delivery methods to overcome biological barriers and improve systemic distribution. The market relevance of these developments is immense, offering potential breakthroughs for previously intractable cancers and providing new avenues for combination therapies. Companies are heavily investing in pipeline expansion, with a strong emphasis on clinical validation and regulatory approval.
Challenges in the Oncolytic Virus Immunotherapy Market
Despite its immense potential, the Oncolytic Virus Immunotherapy market faces several significant challenges that can impede rapid growth and widespread adoption. These include:
- Regulatory Hurdles: Navigating complex and evolving regulatory pathways for novel biological agents can be time-consuming and costly, potentially delaying market entry.
- Manufacturing and Scalability: Producing oncolytic viruses at scale, while maintaining stringent quality control and purity standards, remains a significant manufacturing challenge, impacting cost and accessibility. Estimated production costs can range from tens of millions to hundreds of millions of dollars per batch.
- Immunogenicity and Off-Target Effects: While improving, the potential for unintended immune responses against the viral vectors or off-target viral replication in healthy tissues remains a concern, necessitating careful patient selection and monitoring.
- High Development Costs: The extensive research, clinical trial phases, and manufacturing complexities associated with oncolytic virus therapies result in exceptionally high development costs, often in the hundreds of millions of dollars per program.
Forces Driving Oncolytic Virus Immunotherapy Growth
The growth of the Oncolytic Virus Immunotherapy market is propelled by several powerful forces:
- Unmet Clinical Needs: The persistent limitations of existing cancer treatments for many advanced and refractory cancers create a strong demand for novel therapeutic approaches like oncolytic viruses.
- Advancements in Genetic Engineering: Sophisticated genetic engineering techniques allow for the creation of highly tailored and effective oncolytic viruses with enhanced tumor-targeting capabilities and therapeutic payloads.
- Growing Body of Clinical Evidence: Successful clinical trial results and the gradual approval of oncolytic virus therapies are building confidence among oncologists and patients.
- Supportive Regulatory Environment: An increasing number of regulatory agencies are streamlining approval processes for promising oncolytic virus candidates, recognizing their therapeutic potential.
Challenges in the Oncolytic Virus Immunotherapy Market
Long-term growth catalysts for the Oncolytic Virus Immunotherapy market are deeply rooted in continued innovation and strategic market expansion. Key among these is the ongoing refinement of viral vector technologies, aiming for enhanced safety profiles and superior tumor penetration. Furthermore, the development of effective combination therapies, integrating oncolytic viruses with checkpoint inhibitors, chemotherapy, or other immunotherapies, presents a significant avenue for unlocking synergistic effects and broadening their applicability across diverse cancer types. Strategic partnerships between academic institutions and commercial entities are crucial for translating groundbreaking research into clinically viable products, with an estimated $10 billion expected in research collaborations over the forecast period.
Emerging Opportunities in Oncolytic Virus Immunotherapy
The Oncolytic Virus Immunotherapy landscape is ripe with emerging opportunities that promise to reshape cancer treatment paradigms. The exploration of novel viral platforms, beyond traditional adenoviruses and herpes simplex viruses, to target a wider array of cancers and overcome resistance mechanisms is a significant trend. This includes the investigation of oncolytic bacteriophages and lentiviruses. Furthermore, the burgeoning field of ex vivo gene therapy, where oncolytic viruses are used to genetically modify patient immune cells before reinfusion, holds immense promise. Expansion into previously underserved markets, particularly in developing economies with growing healthcare infrastructure and increasing cancer incidence, represents a substantial untapped potential, estimated to contribute billions to market growth.
Leading Players in the Oncolytic Virus Immunotherapy Sector
- Merck
- Amgen
- TILT Biotherapeutics
- Oncorus
- Sorrento Therapeutics
- Shanghai Sunway Biotech
Key Milestones in Oncolytic Virus Immunotherapy Industry
- 2019: Multiple Phase III clinical trials for oncolytic virus therapies initiated across various cancer types, indicating growing clinical validation.
- 2020: First major licensing deal valued at over $500 million signed between a leading biotech firm and a pharmaceutical giant for an oncolytic virus asset, highlighting significant industry investment.
- 2021: Approval of a novel oncolytic virus therapy for a specific indication in a key market, marking a significant regulatory advancement.
- 2022: Breakthrough research published on engineering oncolytic viruses to overcome tumor microenvironment barriers, leading to enhanced efficacy.
- 2023: Several M&A activities and strategic partnerships announced, aimed at consolidating pipelines and accelerating development timelines, with aggregate deal values exceeding $1 billion.
- 2024: Expansion of clinical trials to include combination therapy approaches, demonstrating a move towards synergistic treatment strategies.
Strategic Outlook for Oncolytic Virus Immunotherapy Market
The strategic outlook for the Oncolytic Virus Immunotherapy market is exceptionally robust, driven by relentless innovation and a clear demand for more effective cancer treatments. Growth accelerators include the continuous advancement in viral engineering for improved safety and efficacy, the strategic expansion of combination therapy protocols, and the penetration into new geographical markets. The estimated market size is expected to reach over $15 billion by 2033, fueled by significant ongoing R&D investments, projected to exceed $5 billion annually. Opportunities for collaboration between pharmaceutical companies, academic institutions, and contract development and manufacturing organizations (CDMOs) will be critical for navigating the complexities of oncolytic virus development and commercialization.
Oncolytic Virus Immunotherapy Segmentation
-
1. Application
- 1.1. Hospitals
- 1.2. Clinics
- 1.3. Ambulatory Surgical Centers
-
2. Type
- 2.1. Engineering Oncolytic Viruses
- 2.2. Wild-Type Oncolytic Viruses
Oncolytic Virus Immunotherapy Segmentation By Geography
-
1. North America
- 1.1. United States
- 1.2. Canada
- 1.3. Mexico
-
2. South America
- 2.1. Brazil
- 2.2. Argentina
- 2.3. Rest of South America
-
3. Europe
- 3.1. United Kingdom
- 3.2. Germany
- 3.3. France
- 3.4. Italy
- 3.5. Spain
- 3.6. Russia
- 3.7. Benelux
- 3.8. Nordics
- 3.9. Rest of Europe
-
4. Middle East & Africa
- 4.1. Turkey
- 4.2. Israel
- 4.3. GCC
- 4.4. North Africa
- 4.5. South Africa
- 4.6. Rest of Middle East & Africa
-
5. Asia Pacific
- 5.1. China
- 5.2. India
- 5.3. Japan
- 5.4. South Korea
- 5.5. ASEAN
- 5.6. Oceania
- 5.7. Rest of Asia Pacific
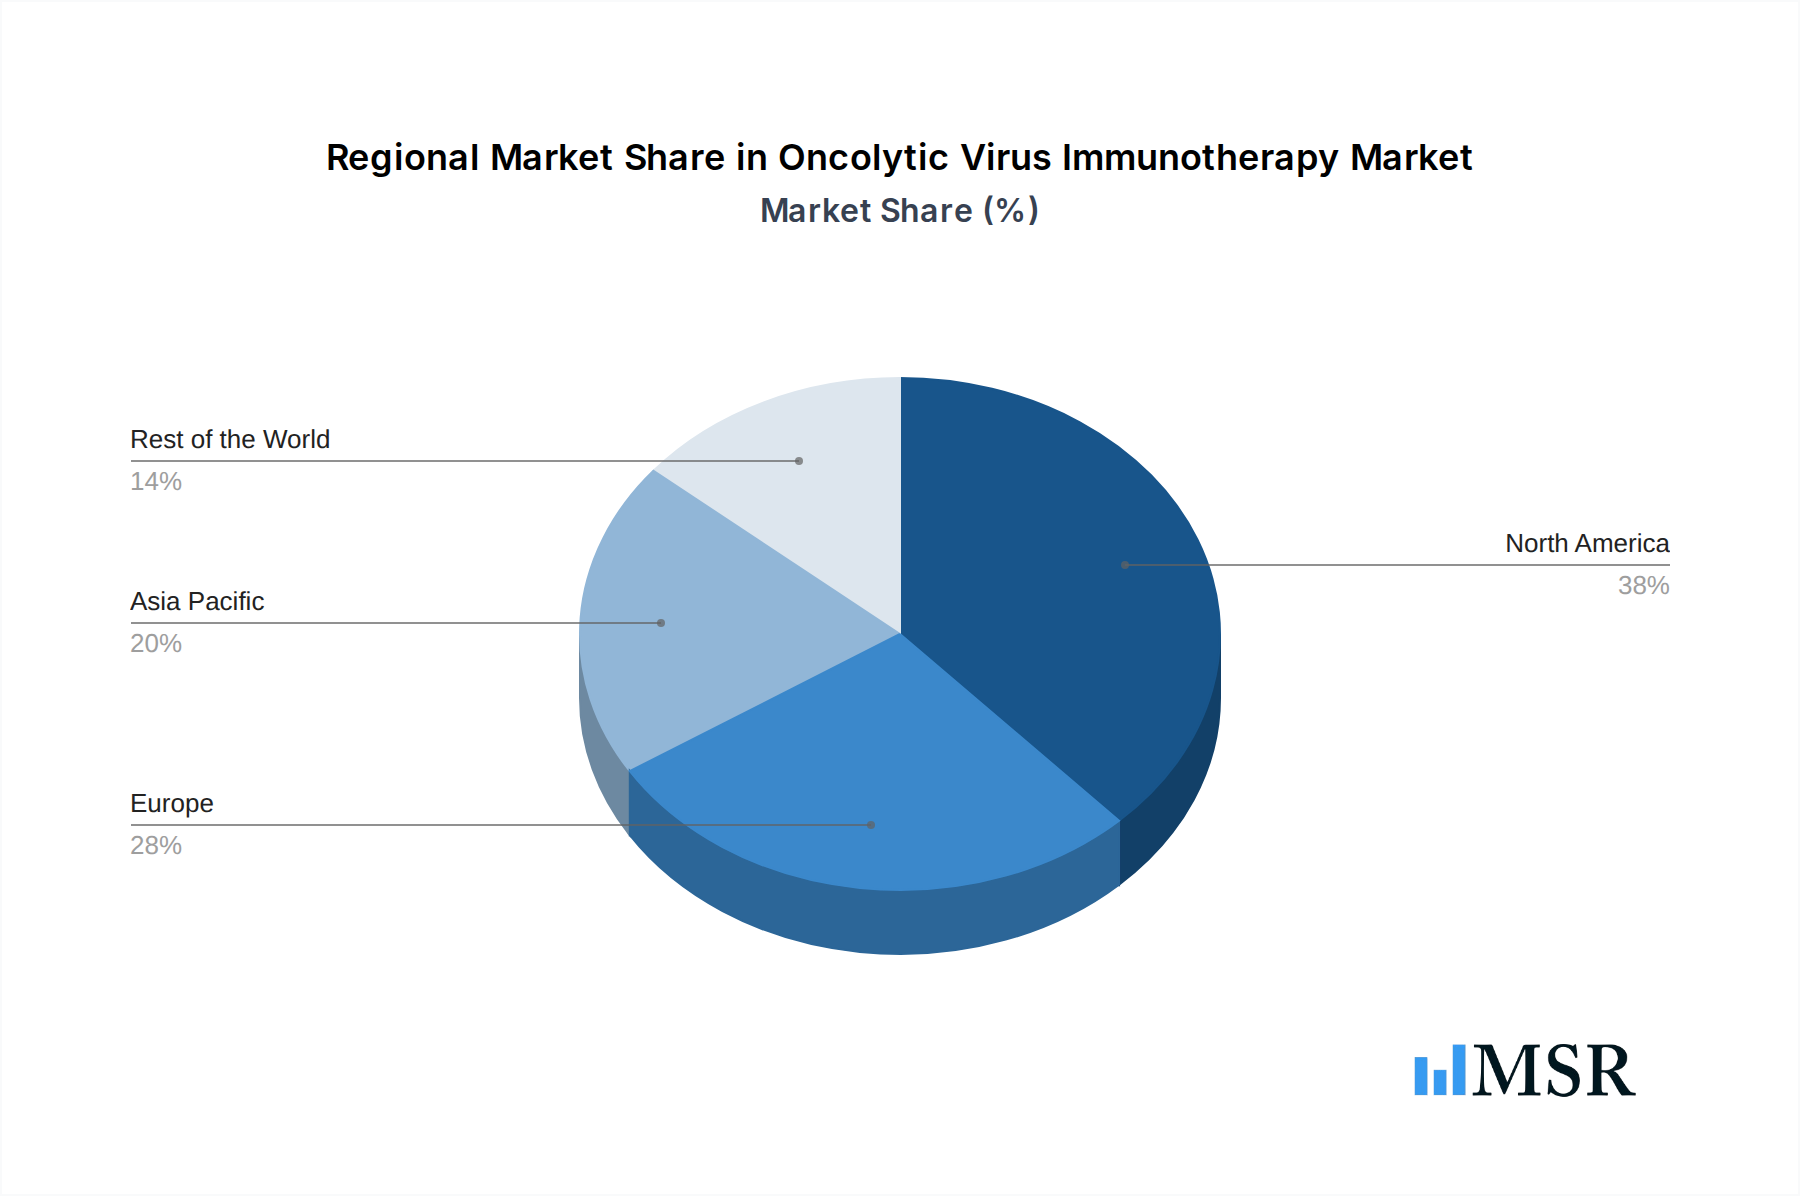
Oncolytic Virus Immunotherapy Regional Market Share
Geographic Coverage of Oncolytic Virus Immunotherapy
Oncolytic Virus Immunotherapy REPORT HIGHLIGHTS
| Aspects | Details |
|---|---|
| Study Period | 2020-2034 |
| Base Year | 2025 |
| Estimated Year | 2026 |
| Forecast Period | 2026-2034 |
| Historical Period | 2020-2025 |
| Growth Rate | CAGR of 23.7% from 2020-2034 |
| Segmentation |
|
Table of Contents
- 1. Introduction
- 1.1. Research Scope
- 1.2. Market Segmentation
- 1.3. Research Methodology
- 1.4. Definitions and Assumptions
- 2. Executive Summary
- 2.1. Introduction
- 3. Market Dynamics
- 3.1. Introduction
- 3.2. Market Drivers
- 3.3. Market Restrains
- 3.4. Market Trends
- 4. Market Factor Analysis
- 4.1. Porters Five Forces
- 4.2. Supply/Value Chain
- 4.3. PESTEL analysis
- 4.4. Market Entropy
- 4.5. Patent/Trademark Analysis
- 5. Global Oncolytic Virus Immunotherapy Analysis, Insights and Forecast, 2020-2032
- 5.1. Market Analysis, Insights and Forecast - by Application
- 5.1.1. Hospitals
- 5.1.2. Clinics
- 5.1.3. Ambulatory Surgical Centers
- 5.2. Market Analysis, Insights and Forecast - by Type
- 5.2.1. Engineering Oncolytic Viruses
- 5.2.2. Wild-Type Oncolytic Viruses
- 5.3. Market Analysis, Insights and Forecast - by Region
- 5.3.1. North America
- 5.3.2. South America
- 5.3.3. Europe
- 5.3.4. Middle East & Africa
- 5.3.5. Asia Pacific
- 5.1. Market Analysis, Insights and Forecast - by Application
- 6. North America Oncolytic Virus Immunotherapy Analysis, Insights and Forecast, 2020-2032
- 6.1. Market Analysis, Insights and Forecast - by Application
- 6.1.1. Hospitals
- 6.1.2. Clinics
- 6.1.3. Ambulatory Surgical Centers
- 6.2. Market Analysis, Insights and Forecast - by Type
- 6.2.1. Engineering Oncolytic Viruses
- 6.2.2. Wild-Type Oncolytic Viruses
- 6.1. Market Analysis, Insights and Forecast - by Application
- 7. South America Oncolytic Virus Immunotherapy Analysis, Insights and Forecast, 2020-2032
- 7.1. Market Analysis, Insights and Forecast - by Application
- 7.1.1. Hospitals
- 7.1.2. Clinics
- 7.1.3. Ambulatory Surgical Centers
- 7.2. Market Analysis, Insights and Forecast - by Type
- 7.2.1. Engineering Oncolytic Viruses
- 7.2.2. Wild-Type Oncolytic Viruses
- 7.1. Market Analysis, Insights and Forecast - by Application
- 8. Europe Oncolytic Virus Immunotherapy Analysis, Insights and Forecast, 2020-2032
- 8.1. Market Analysis, Insights and Forecast - by Application
- 8.1.1. Hospitals
- 8.1.2. Clinics
- 8.1.3. Ambulatory Surgical Centers
- 8.2. Market Analysis, Insights and Forecast - by Type
- 8.2.1. Engineering Oncolytic Viruses
- 8.2.2. Wild-Type Oncolytic Viruses
- 8.1. Market Analysis, Insights and Forecast - by Application
- 9. Middle East & Africa Oncolytic Virus Immunotherapy Analysis, Insights and Forecast, 2020-2032
- 9.1. Market Analysis, Insights and Forecast - by Application
- 9.1.1. Hospitals
- 9.1.2. Clinics
- 9.1.3. Ambulatory Surgical Centers
- 9.2. Market Analysis, Insights and Forecast - by Type
- 9.2.1. Engineering Oncolytic Viruses
- 9.2.2. Wild-Type Oncolytic Viruses
- 9.1. Market Analysis, Insights and Forecast - by Application
- 10. Asia Pacific Oncolytic Virus Immunotherapy Analysis, Insights and Forecast, 2020-2032
- 10.1. Market Analysis, Insights and Forecast - by Application
- 10.1.1. Hospitals
- 10.1.2. Clinics
- 10.1.3. Ambulatory Surgical Centers
- 10.2. Market Analysis, Insights and Forecast - by Type
- 10.2.1. Engineering Oncolytic Viruses
- 10.2.2. Wild-Type Oncolytic Viruses
- 10.1. Market Analysis, Insights and Forecast - by Application
- 11. Competitive Analysis
- 11.1. Global Market Share Analysis 2025
- 11.2. Company Profiles
- 11.2.1 Merck
- 11.2.1.1. Overview
- 11.2.1.2. Products
- 11.2.1.3. SWOT Analysis
- 11.2.1.4. Recent Developments
- 11.2.1.5. Financials (Based on Availability)
- 11.2.2 Amgen
- 11.2.2.1. Overview
- 11.2.2.2. Products
- 11.2.2.3. SWOT Analysis
- 11.2.2.4. Recent Developments
- 11.2.2.5. Financials (Based on Availability)
- 11.2.3 TILT Biotherapeutics
- 11.2.3.1. Overview
- 11.2.3.2. Products
- 11.2.3.3. SWOT Analysis
- 11.2.3.4. Recent Developments
- 11.2.3.5. Financials (Based on Availability)
- 11.2.4 Oncorus
- 11.2.4.1. Overview
- 11.2.4.2. Products
- 11.2.4.3. SWOT Analysis
- 11.2.4.4. Recent Developments
- 11.2.4.5. Financials (Based on Availability)
- 11.2.5 Sorrento Therapeutics
- 11.2.5.1. Overview
- 11.2.5.2. Products
- 11.2.5.3. SWOT Analysis
- 11.2.5.4. Recent Developments
- 11.2.5.5. Financials (Based on Availability)
- 11.2.6 Shanghai Sunway Biotech
- 11.2.6.1. Overview
- 11.2.6.2. Products
- 11.2.6.3. SWOT Analysis
- 11.2.6.4. Recent Developments
- 11.2.6.5. Financials (Based on Availability)
- 11.2.1 Merck
List of Figures
- Figure 1: Global Oncolytic Virus Immunotherapy Revenue Breakdown (undefined, %) by Region 2025 & 2033
- Figure 2: North America Oncolytic Virus Immunotherapy Revenue (undefined), by Application 2025 & 2033
- Figure 3: North America Oncolytic Virus Immunotherapy Revenue Share (%), by Application 2025 & 2033
- Figure 4: North America Oncolytic Virus Immunotherapy Revenue (undefined), by Type 2025 & 2033
- Figure 5: North America Oncolytic Virus Immunotherapy Revenue Share (%), by Type 2025 & 2033
- Figure 6: North America Oncolytic Virus Immunotherapy Revenue (undefined), by Country 2025 & 2033
- Figure 7: North America Oncolytic Virus Immunotherapy Revenue Share (%), by Country 2025 & 2033
- Figure 8: South America Oncolytic Virus Immunotherapy Revenue (undefined), by Application 2025 & 2033
- Figure 9: South America Oncolytic Virus Immunotherapy Revenue Share (%), by Application 2025 & 2033
- Figure 10: South America Oncolytic Virus Immunotherapy Revenue (undefined), by Type 2025 & 2033
- Figure 11: South America Oncolytic Virus Immunotherapy Revenue Share (%), by Type 2025 & 2033
- Figure 12: South America Oncolytic Virus Immunotherapy Revenue (undefined), by Country 2025 & 2033
- Figure 13: South America Oncolytic Virus Immunotherapy Revenue Share (%), by Country 2025 & 2033
- Figure 14: Europe Oncolytic Virus Immunotherapy Revenue (undefined), by Application 2025 & 2033
- Figure 15: Europe Oncolytic Virus Immunotherapy Revenue Share (%), by Application 2025 & 2033
- Figure 16: Europe Oncolytic Virus Immunotherapy Revenue (undefined), by Type 2025 & 2033
- Figure 17: Europe Oncolytic Virus Immunotherapy Revenue Share (%), by Type 2025 & 2033
- Figure 18: Europe Oncolytic Virus Immunotherapy Revenue (undefined), by Country 2025 & 2033
- Figure 19: Europe Oncolytic Virus Immunotherapy Revenue Share (%), by Country 2025 & 2033
- Figure 20: Middle East & Africa Oncolytic Virus Immunotherapy Revenue (undefined), by Application 2025 & 2033
- Figure 21: Middle East & Africa Oncolytic Virus Immunotherapy Revenue Share (%), by Application 2025 & 2033
- Figure 22: Middle East & Africa Oncolytic Virus Immunotherapy Revenue (undefined), by Type 2025 & 2033
- Figure 23: Middle East & Africa Oncolytic Virus Immunotherapy Revenue Share (%), by Type 2025 & 2033
- Figure 24: Middle East & Africa Oncolytic Virus Immunotherapy Revenue (undefined), by Country 2025 & 2033
- Figure 25: Middle East & Africa Oncolytic Virus Immunotherapy Revenue Share (%), by Country 2025 & 2033
- Figure 26: Asia Pacific Oncolytic Virus Immunotherapy Revenue (undefined), by Application 2025 & 2033
- Figure 27: Asia Pacific Oncolytic Virus Immunotherapy Revenue Share (%), by Application 2025 & 2033
- Figure 28: Asia Pacific Oncolytic Virus Immunotherapy Revenue (undefined), by Type 2025 & 2033
- Figure 29: Asia Pacific Oncolytic Virus Immunotherapy Revenue Share (%), by Type 2025 & 2033
- Figure 30: Asia Pacific Oncolytic Virus Immunotherapy Revenue (undefined), by Country 2025 & 2033
- Figure 31: Asia Pacific Oncolytic Virus Immunotherapy Revenue Share (%), by Country 2025 & 2033
List of Tables
- Table 1: Global Oncolytic Virus Immunotherapy Revenue undefined Forecast, by Application 2020 & 2033
- Table 2: Global Oncolytic Virus Immunotherapy Revenue undefined Forecast, by Type 2020 & 2033
- Table 3: Global Oncolytic Virus Immunotherapy Revenue undefined Forecast, by Region 2020 & 2033
- Table 4: Global Oncolytic Virus Immunotherapy Revenue undefined Forecast, by Application 2020 & 2033
- Table 5: Global Oncolytic Virus Immunotherapy Revenue undefined Forecast, by Type 2020 & 2033
- Table 6: Global Oncolytic Virus Immunotherapy Revenue undefined Forecast, by Country 2020 & 2033
- Table 7: United States Oncolytic Virus Immunotherapy Revenue (undefined) Forecast, by Application 2020 & 2033
- Table 8: Canada Oncolytic Virus Immunotherapy Revenue (undefined) Forecast, by Application 2020 & 2033
- Table 9: Mexico Oncolytic Virus Immunotherapy Revenue (undefined) Forecast, by Application 2020 & 2033
- Table 10: Global Oncolytic Virus Immunotherapy Revenue undefined Forecast, by Application 2020 & 2033
- Table 11: Global Oncolytic Virus Immunotherapy Revenue undefined Forecast, by Type 2020 & 2033
- Table 12: Global Oncolytic Virus Immunotherapy Revenue undefined Forecast, by Country 2020 & 2033
- Table 13: Brazil Oncolytic Virus Immunotherapy Revenue (undefined) Forecast, by Application 2020 & 2033
- Table 14: Argentina Oncolytic Virus Immunotherapy Revenue (undefined) Forecast, by Application 2020 & 2033
- Table 15: Rest of South America Oncolytic Virus Immunotherapy Revenue (undefined) Forecast, by Application 2020 & 2033
- Table 16: Global Oncolytic Virus Immunotherapy Revenue undefined Forecast, by Application 2020 & 2033
- Table 17: Global Oncolytic Virus Immunotherapy Revenue undefined Forecast, by Type 2020 & 2033
- Table 18: Global Oncolytic Virus Immunotherapy Revenue undefined Forecast, by Country 2020 & 2033
- Table 19: United Kingdom Oncolytic Virus Immunotherapy Revenue (undefined) Forecast, by Application 2020 & 2033
- Table 20: Germany Oncolytic Virus Immunotherapy Revenue (undefined) Forecast, by Application 2020 & 2033
- Table 21: France Oncolytic Virus Immunotherapy Revenue (undefined) Forecast, by Application 2020 & 2033
- Table 22: Italy Oncolytic Virus Immunotherapy Revenue (undefined) Forecast, by Application 2020 & 2033
- Table 23: Spain Oncolytic Virus Immunotherapy Revenue (undefined) Forecast, by Application 2020 & 2033
- Table 24: Russia Oncolytic Virus Immunotherapy Revenue (undefined) Forecast, by Application 2020 & 2033
- Table 25: Benelux Oncolytic Virus Immunotherapy Revenue (undefined) Forecast, by Application 2020 & 2033
- Table 26: Nordics Oncolytic Virus Immunotherapy Revenue (undefined) Forecast, by Application 2020 & 2033
- Table 27: Rest of Europe Oncolytic Virus Immunotherapy Revenue (undefined) Forecast, by Application 2020 & 2033
- Table 28: Global Oncolytic Virus Immunotherapy Revenue undefined Forecast, by Application 2020 & 2033
- Table 29: Global Oncolytic Virus Immunotherapy Revenue undefined Forecast, by Type 2020 & 2033
- Table 30: Global Oncolytic Virus Immunotherapy Revenue undefined Forecast, by Country 2020 & 2033
- Table 31: Turkey Oncolytic Virus Immunotherapy Revenue (undefined) Forecast, by Application 2020 & 2033
- Table 32: Israel Oncolytic Virus Immunotherapy Revenue (undefined) Forecast, by Application 2020 & 2033
- Table 33: GCC Oncolytic Virus Immunotherapy Revenue (undefined) Forecast, by Application 2020 & 2033
- Table 34: North Africa Oncolytic Virus Immunotherapy Revenue (undefined) Forecast, by Application 2020 & 2033
- Table 35: South Africa Oncolytic Virus Immunotherapy Revenue (undefined) Forecast, by Application 2020 & 2033
- Table 36: Rest of Middle East & Africa Oncolytic Virus Immunotherapy Revenue (undefined) Forecast, by Application 2020 & 2033
- Table 37: Global Oncolytic Virus Immunotherapy Revenue undefined Forecast, by Application 2020 & 2033
- Table 38: Global Oncolytic Virus Immunotherapy Revenue undefined Forecast, by Type 2020 & 2033
- Table 39: Global Oncolytic Virus Immunotherapy Revenue undefined Forecast, by Country 2020 & 2033
- Table 40: China Oncolytic Virus Immunotherapy Revenue (undefined) Forecast, by Application 2020 & 2033
- Table 41: India Oncolytic Virus Immunotherapy Revenue (undefined) Forecast, by Application 2020 & 2033
- Table 42: Japan Oncolytic Virus Immunotherapy Revenue (undefined) Forecast, by Application 2020 & 2033
- Table 43: South Korea Oncolytic Virus Immunotherapy Revenue (undefined) Forecast, by Application 2020 & 2033
- Table 44: ASEAN Oncolytic Virus Immunotherapy Revenue (undefined) Forecast, by Application 2020 & 2033
- Table 45: Oceania Oncolytic Virus Immunotherapy Revenue (undefined) Forecast, by Application 2020 & 2033
- Table 46: Rest of Asia Pacific Oncolytic Virus Immunotherapy Revenue (undefined) Forecast, by Application 2020 & 2033
Frequently Asked Questions
1. What is the projected Compound Annual Growth Rate (CAGR) of the Oncolytic Virus Immunotherapy?
The projected CAGR is approximately 23.7%.
2. Which companies are prominent players in the Oncolytic Virus Immunotherapy?
Key companies in the market include Merck, Amgen, TILT Biotherapeutics, Oncorus, Sorrento Therapeutics, Shanghai Sunway Biotech.
3. What are the main segments of the Oncolytic Virus Immunotherapy?
The market segments include Application, Type.
4. Can you provide details about the market size?
The market size is estimated to be USD XXX N/A as of 2022.
5. What are some drivers contributing to market growth?
N/A
6. What are the notable trends driving market growth?
N/A
7. Are there any restraints impacting market growth?
N/A
8. Can you provide examples of recent developments in the market?
N/A
9. What pricing options are available for accessing the report?
Pricing options include single-user, multi-user, and enterprise licenses priced at USD 3950.00, USD 5925.00, and USD 7900.00 respectively.
10. Is the market size provided in terms of value or volume?
The market size is provided in terms of value, measured in N/A.
11. Are there any specific market keywords associated with the report?
Yes, the market keyword associated with the report is "Oncolytic Virus Immunotherapy," which aids in identifying and referencing the specific market segment covered.
12. How do I determine which pricing option suits my needs best?
The pricing options vary based on user requirements and access needs. Individual users may opt for single-user licenses, while businesses requiring broader access may choose multi-user or enterprise licenses for cost-effective access to the report.
13. Are there any additional resources or data provided in the Oncolytic Virus Immunotherapy report?
While the report offers comprehensive insights, it's advisable to review the specific contents or supplementary materials provided to ascertain if additional resources or data are available.
14. How can I stay updated on further developments or reports in the Oncolytic Virus Immunotherapy?
To stay informed about further developments, trends, and reports in the Oncolytic Virus Immunotherapy, consider subscribing to industry newsletters, following relevant companies and organizations, or regularly checking reputable industry news sources and publications.
Methodology
Step 1 - Identification of Relevant Samples Size from Population Database


Step 2 - Approaches for Defining Global Market Size (Value, Volume* & Price*)

Note*: In applicable scenarios
Step 3 - Data Sources
Primary Research
- Web Analytics
- Survey Reports
- Research Institute
- Latest Research Reports
- Opinion Leaders
Secondary Research
- Annual Reports
- White Paper
- Latest Press Release
- Industry Association
- Paid Database
- Investor Presentations

Step 4 - Data Triangulation
Involves using different sources of information in order to increase the validity of a study
These sources are likely to be stakeholders in a program - participants, other researchers, program staff, other community members, and so on.
Then we put all data in single framework & apply various statistical tools to find out the dynamic on the market.
During the analysis stage, feedback from the stakeholder groups would be compared to determine areas of agreement as well as areas of divergence