

Key Insights
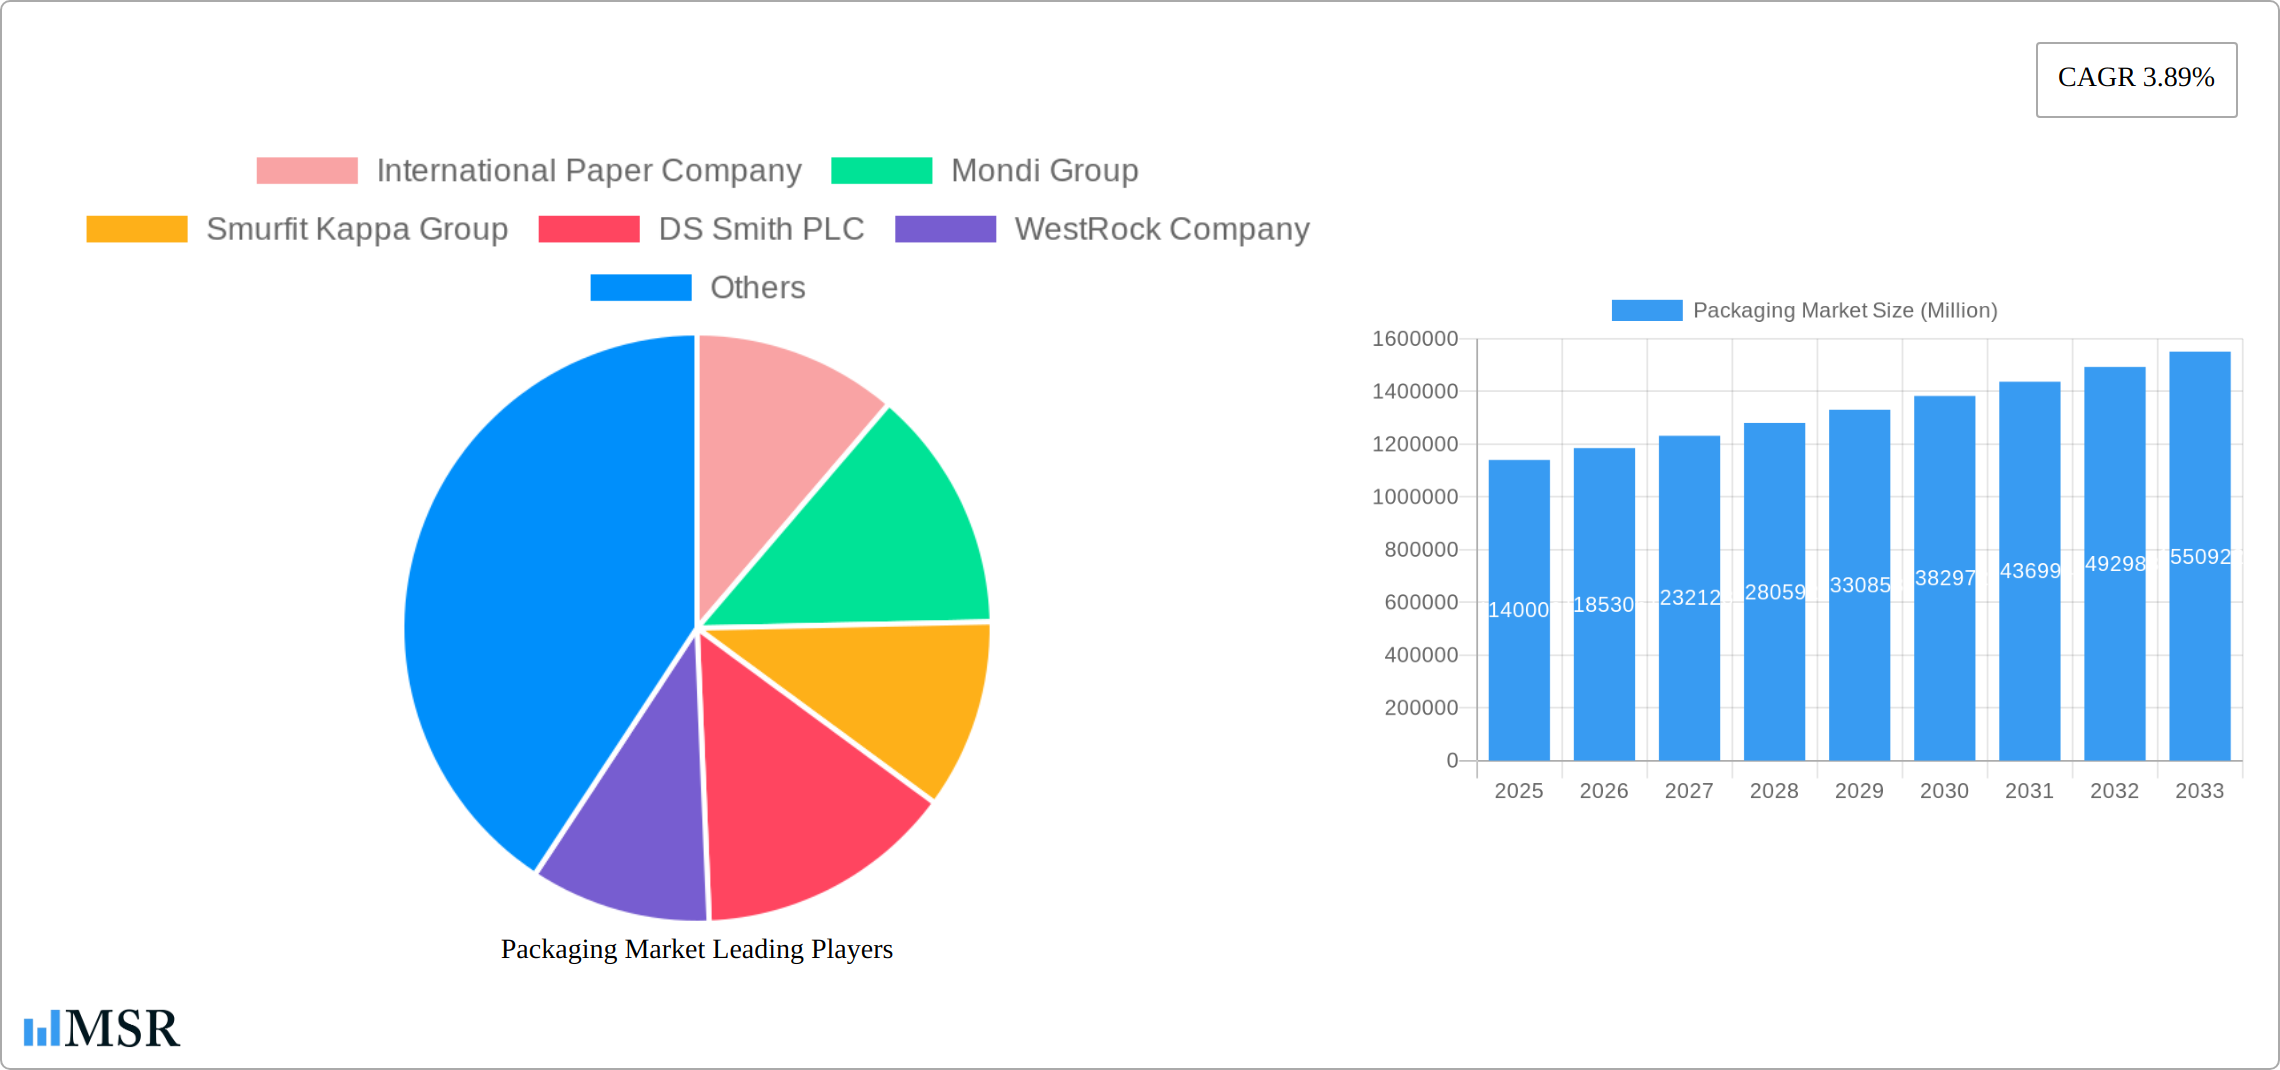
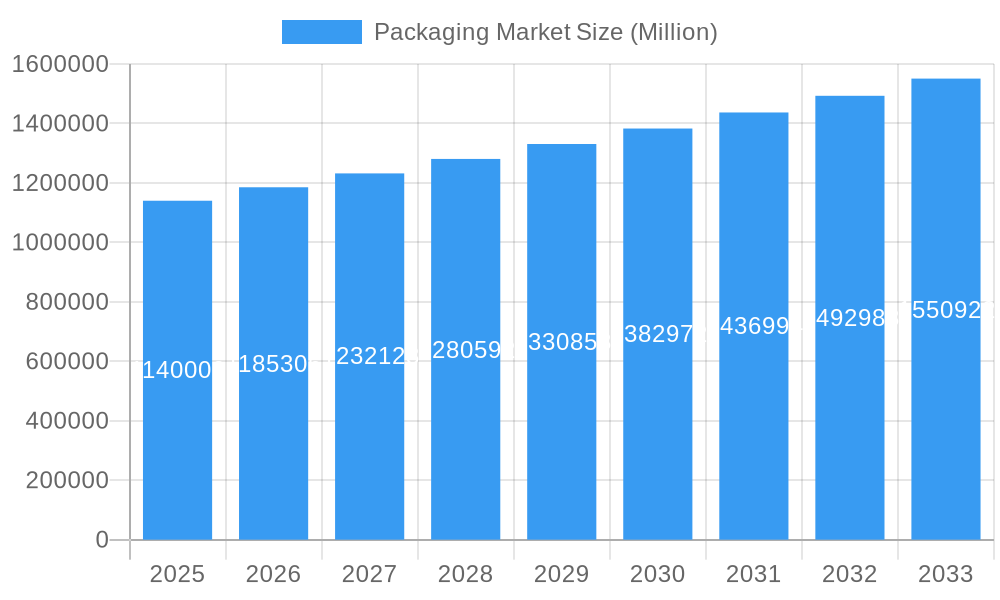
The global packaging market, valued at $1.14 trillion in 2025, is projected to experience robust growth, driven by a compound annual growth rate (CAGR) of 3.89% from 2025 to 2033. This expansion is fueled by several key factors. E-commerce continues its explosive growth, demanding innovative and sustainable packaging solutions for efficient shipping and product protection. The increasing focus on food safety and preservation necessitates advanced packaging materials with extended shelf life capabilities. Furthermore, a growing awareness of environmental concerns is driving the adoption of eco-friendly packaging alternatives made from recycled materials and biodegradable options. Brand owners are increasingly investing in premium packaging to enhance their brand image and appeal to consumer preferences for aesthetically pleasing and convenient packaging formats. This creates opportunities for manufacturers offering specialized packaging solutions, such as flexible packaging for convenience and sustainability, and rigid packaging for product protection and branding.
Packaging Market Market Size (In Million)
Significant competition exists among established players like International Paper, Mondi Group, Smurfit Kappa, and DS Smith, alongside emerging players focusing on specialized segments and sustainable materials. The market is segmented based on material type (paperboard, plastic, metal, glass, etc.), packaging type (flexible, rigid, etc.), and end-use industry (food and beverage, pharmaceuticals, consumer goods, etc.). Regional variations exist due to differing economic growth rates, consumer preferences, and regulatory landscapes. While projected growth is positive, potential restraints include fluctuations in raw material prices, stringent environmental regulations, and the need for continuous innovation to meet evolving consumer demands and sustainability goals. The market will likely see consolidation among existing players and increased focus on developing sustainable, cost-effective solutions tailored to specific industry needs.
Packaging Market Company Market Share
Packaging Market: A Comprehensive Report (2019-2033)
This in-depth report provides a comprehensive analysis of the global Packaging Market, offering crucial insights for industry stakeholders. With a focus on market dynamics, key players, and future trends, this report is an invaluable resource for strategic decision-making. The study period covers 2019-2033, with a base year of 2025 and a forecast period of 2025-2033. The report's findings are based on rigorous data analysis and expert insights, providing actionable intelligence for informed investments and strategic planning. Expect detailed analysis on market size (reaching xx Million by 2033), CAGR, and segment-specific growth projections.
Packaging Market Market Concentration & Dynamics
The global packaging market is characterized by a moderately concentrated landscape, with a few major players holding significant market share. However, a vibrant ecosystem of smaller companies and specialized firms contributes to innovation and competition. Market concentration is influenced by factors such as economies of scale, technological advancements, and mergers & acquisitions (M&A) activity.
- Market Share: The top five players – International Paper Company, Mondi Group, Smurfit Kappa Group, DS Smith PLC, and WestRock Company – collectively hold an estimated xx% of the global market share (2024).
- M&A Activity: The packaging industry witnesses significant M&A activity, driven by the need for expansion, diversification, and technological integration. The number of M&A deals closed annually has averaged approximately xx deals over the past five years (2019-2024). Notable examples include Sonoco Products Company's acquisition of Eviosys (2024) as detailed below.
- Innovation Ecosystems: Ongoing research and development in sustainable materials, intelligent packaging, and automation technologies fuel innovation.
- Regulatory Frameworks: Stringent environmental regulations related to waste reduction and recyclability significantly impact packaging choices.
- Substitute Products: Growing consumer preferences for sustainable alternatives lead to increased competition from biodegradable and compostable packaging options.
- End-User Trends: E-commerce growth fuels demand for protective and convenient packaging solutions.
Packaging Market Industry Insights & Trends
The global packaging market is experiencing robust growth, driven by several key factors. The market size reached xx Million in 2024 and is projected to reach xx Million by 2033, exhibiting a CAGR of xx% during the forecast period. Several trends shape the market's trajectory:
The rising demand for consumer goods globally, expansion of e-commerce, the increasing preference for convenience and ready-to-eat food, and the growing need for sustainable packaging solutions are the key drivers for market growth. Technological advancements such as smart packaging and innovative materials, coupled with evolving consumer behavior towards sustainability and convenience, are shaping the future of the packaging industry. Furthermore, stringent government regulations aiming to minimize environmental impact further drive the adoption of eco-friendly packaging materials and solutions.
Key Markets & Segments Leading Packaging Market
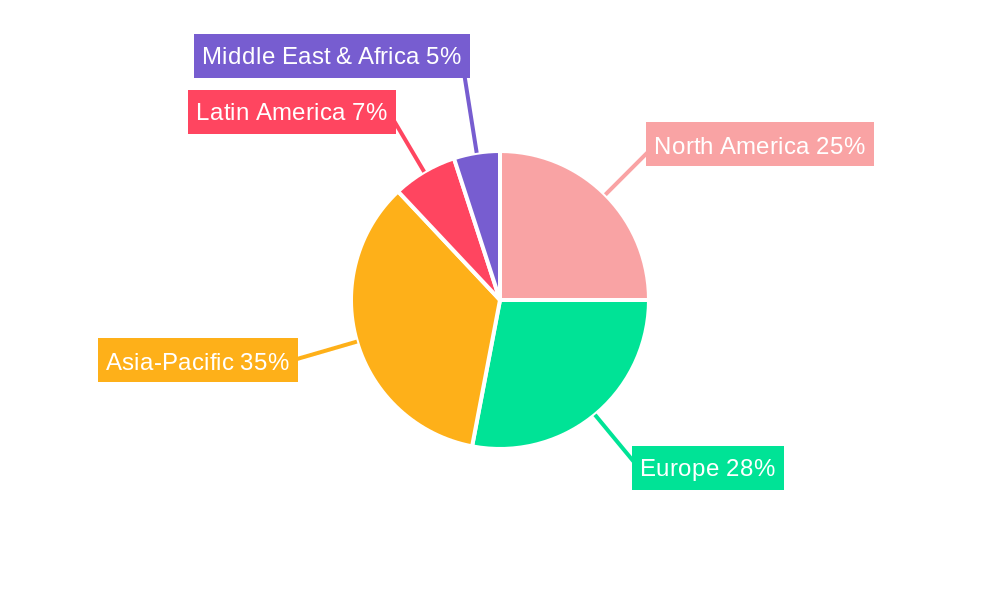
The global packaging market is experiencing robust growth, fueled by several key factors. The Asia-Pacific region currently dominates, propelled by rapid economic expansion, rising urbanization, and a burgeoning consumer base. This surge is particularly evident in the food and beverage, e-commerce, and healthcare sectors. North America and Europe also maintain significant market shares, though their growth rates may be slightly more moderate compared to the dynamism seen in Asia-Pacific.
Drivers in Asia-Pacific:
- Rapid economic growth and a rising middle class with increased disposable incomes and evolving consumption patterns.
- Exponential growth of the food and beverage, pharmaceutical, and e-commerce sectors, driving demand for diverse packaging solutions.
- Increasing urbanization leading to higher packaging demands across various sectors, from consumer goods to industrial applications.
- Supportive government policies and infrastructure development fostering industry growth.
- A robust manufacturing sector capable of meeting the escalating demands for packaging production.
Dominance Analysis: The Asia-Pacific region's dominance stems from a confluence of factors: a vast and diverse population, a robust and expanding manufacturing base, and strong demand across multiple end-use sectors. The food and beverage, and e-commerce industries are particularly significant contributors to this regional dominance. This creates a positive feedback loop, attracting further investment and innovation within the packaging sector.
Packaging Market Product Developments
Recent product innovations include advancements in sustainable packaging materials such as biodegradable plastics and compostable films, coupled with increased efficiency in packaging design and manufacturing. Active and intelligent packaging solutions are gaining traction, providing enhanced product preservation and consumer interaction. These innovations contribute to enhanced product protection, extended shelf life, and improved brand differentiation. The competition amongst different companies to offer the most efficient, sustainable, and appealing packaging is pushing the market forward.
Challenges in the Packaging Market Market
The packaging market faces significant challenges, including:
- Regulatory Hurdles: Stringent environmental regulations and evolving compliance requirements can increase manufacturing costs and complexity. This is exemplified by a xx% increase in compliance costs for companies in the EU over the last five years.
- Supply Chain Disruptions: Global supply chain volatility, particularly in raw material sourcing, can impact production and pricing. The impact on market growth is predicted at xx%.
- Competitive Pressures: Intense competition from both established players and new entrants demands continuous innovation and cost optimization.
Forces Driving Packaging Market Growth
Several forces drive the packaging market's growth:
- Technological Advancements: Innovations in materials science, automation, and printing technologies improve efficiency and product quality.
- Economic Growth: Rising disposable incomes and expanding consumer markets fuel demand for packaged goods.
- E-commerce Boom: The explosive growth of online retail requires robust and efficient packaging solutions.
- Sustainability Concerns: Increased consumer awareness about environmental issues leads to demand for eco-friendly packaging.
Challenges in the Packaging Market Market (Long-Term Growth Catalysts)
Long-term growth will be driven by innovations in sustainable materials, such as plant-based plastics and recycled content. Strategic partnerships between packaging producers and brand owners will facilitate the adoption of innovative packaging solutions. Expansion into emerging markets and the development of specialized packaging for niche applications will create additional opportunities.
Emerging Opportunities in Packaging Market
Emerging trends include the growth of sustainable and recyclable packaging, the increasing adoption of smart packaging technologies for traceability and brand engagement, and personalized packaging options tailored to individual consumers' needs. These trends are creating new market opportunities for innovative companies.
Leading Players in the Packaging Market Sector
- International Paper Company
- Mondi Group
- Smurfit Kappa Group
- DS Smith PLC
- WestRock Company
- UFlex Limited
- Huhtamaki Oyj
- Amcor Group GmbH
- Coveris Holding SA
- Sealed Air Corporation
- Greif Inc
- Sonoco Products Company
- Aptar Group Inc
- Berry Global Group Inc
- Alpla Group
- Owens-illinois Inc
- Vidrala S A
- Verallia SA
- Gerresheimer AG
- Vitro S A B De C V
- Ball Corporation
- Crown Holdings Inc
- Ardagh Group S A
- Can Pack SA
- Silgan Holdings Inc
Key Milestones in Packaging Market Industry
- June 2024: Sonoco Products Company's acquisition of Eviosys for USD 3.9 billion expands its presence in the European food can market.
- May 2024: Mondi's USD 216.45 million investment in a recycled containerboard machine in Italy showcases the shift towards sustainable packaging.
- April 2024: The UK launches CiPPPA, a collaborative initiative to enhance pharmaceutical packaging recycling, highlighting growing regulatory focus on sustainability.
- April 2024: Berry Global Group Inc. increases its European healthcare packaging production capacity by 30%, reflecting the growing demand for healthcare solutions.
Strategic Outlook for Packaging Market Market
The future of the packaging market is bright, with continued growth driven by expanding consumer markets, technological advancements, and the increasing focus on sustainability. Strategic partnerships, product innovation, and expansion into new markets will be key for companies to capitalize on the vast opportunities within this dynamic sector. A strong focus on sustainability will be crucial for success, with innovative materials and circular economy solutions playing an ever-larger role.
Packaging Market Segmentation
- 1. Production Analysis
- 2. Consumption Analysis
- 3. Import Market Analysis (Value & Volume)
- 4. Export Market Analysis (Value & Volume)
- 5. Price Trend Analysis
Packaging Market Segmentation By Geography
-
1. North America
- 1.1. United States
- 1.2. Canada
- 1.3. Mexico
-
2. South America
- 2.1. Brazil
- 2.2. Argentina
- 2.3. Rest of South America
-
3. Europe
- 3.1. United Kingdom
- 3.2. Germany
- 3.3. France
- 3.4. Italy
- 3.5. Spain
- 3.6. Russia
- 3.7. Benelux
- 3.8. Nordics
- 3.9. Rest of Europe
-
4. Middle East & Africa
- 4.1. Turkey
- 4.2. Israel
- 4.3. GCC
- 4.4. North Africa
- 4.5. South Africa
- 4.6. Rest of Middle East & Africa
-
5. Asia Pacific
- 5.1. China
- 5.2. India
- 5.3. Japan
- 5.4. South Korea
- 5.5. ASEAN
- 5.6. Oceania
- 5.7. Rest of Asia Pacific
Packaging Market Regional Market Share
Geographic Coverage of Packaging Market
Packaging Market REPORT HIGHLIGHTS
| Aspects | Details |
|---|---|
| Study Period | 2020-2034 |
| Base Year | 2025 |
| Estimated Year | 2026 |
| Forecast Period | 2026-2034 |
| Historical Period | 2020-2025 |
| Growth Rate | CAGR of 3.89% from 2020-2034 |
| Segmentation |
|
Table of Contents
- 1. Introduction
- 1.1. Research Scope
- 1.2. Market Segmentation
- 1.3. Research Objective
- 1.4. Definitions and Assumptions
- 2. Executive Summary
- 2.1. Market Snapshot
- 3. Market Dynamics
- 3.1. Market Drivers
- 3.2. Market Restrains
- 3.3. Market Trends
- 3.4. Market Opportunities
- 4. Market Factor Analysis
- 4.1. Porters Five Forces
- 4.1.1. Bargaining Power of Suppliers
- 4.1.2. Bargaining Power of Buyers
- 4.1.3. Threat of New Entrants
- 4.1.4. Threat of Substitutes
- 4.1.5. Competitive Rivalry
- 4.2. PESTEL analysis
- 4.3. BCG Analysis
- 4.3.1. Stars (High Growth, High Market Share)
- 4.3.2. Cash Cows (Low Growth, High Market Share)
- 4.3.3. Question Mark (High Growth, Low Market Share)
- 4.3.4. Dogs (Low Growth, Low Market Share)
- 4.4. Ansoff Matrix Analysis
- 4.5. Supply Chain Analysis
- 4.6. Regulatory Landscape
- 4.7. Current Market Potential and Opportunity Assessment (TAM–SAM–SOM Framework)
- 4.8. MSR Analyst Note
- 4.1. Porters Five Forces
- 5. Market Analysis, Insights and Forecast 2021-2033
- 5.1. Market Analysis, Insights and Forecast - by Production Analysis
- 5.2. Market Analysis, Insights and Forecast - by Consumption Analysis
- 5.3. Market Analysis, Insights and Forecast - by Import Market Analysis (Value & Volume)
- 5.4. Market Analysis, Insights and Forecast - by Export Market Analysis (Value & Volume)
- 5.5. Market Analysis, Insights and Forecast - by Price Trend Analysis
- 5.6. Market Analysis, Insights and Forecast - by Region
- 5.6.1. North America
- 5.6.2. South America
- 5.6.3. Europe
- 5.6.4. Middle East & Africa
- 5.6.5. Asia Pacific
- 6. Global Packaging Market Analysis, Insights and Forecast, 2021-2033
- 6.1. Market Analysis, Insights and Forecast - by Production Analysis
- 6.2. Market Analysis, Insights and Forecast - by Consumption Analysis
- 6.3. Market Analysis, Insights and Forecast - by Import Market Analysis (Value & Volume)
- 6.4. Market Analysis, Insights and Forecast - by Export Market Analysis (Value & Volume)
- 6.5. Market Analysis, Insights and Forecast - by Price Trend Analysis
- 7. North America Packaging Market Analysis, Insights and Forecast, 2020-2032
- 7.1. Market Analysis, Insights and Forecast - by Production Analysis
- 7.2. Market Analysis, Insights and Forecast - by Consumption Analysis
- 7.3. Market Analysis, Insights and Forecast - by Import Market Analysis (Value & Volume)
- 7.4. Market Analysis, Insights and Forecast - by Export Market Analysis (Value & Volume)
- 7.5. Market Analysis, Insights and Forecast - by Price Trend Analysis
- 8. South America Packaging Market Analysis, Insights and Forecast, 2020-2032
- 8.1. Market Analysis, Insights and Forecast - by Production Analysis
- 8.2. Market Analysis, Insights and Forecast - by Consumption Analysis
- 8.3. Market Analysis, Insights and Forecast - by Import Market Analysis (Value & Volume)
- 8.4. Market Analysis, Insights and Forecast - by Export Market Analysis (Value & Volume)
- 8.5. Market Analysis, Insights and Forecast - by Price Trend Analysis
- 9. Europe Packaging Market Analysis, Insights and Forecast, 2020-2032
- 9.1. Market Analysis, Insights and Forecast - by Production Analysis
- 9.2. Market Analysis, Insights and Forecast - by Consumption Analysis
- 9.3. Market Analysis, Insights and Forecast - by Import Market Analysis (Value & Volume)
- 9.4. Market Analysis, Insights and Forecast - by Export Market Analysis (Value & Volume)
- 9.5. Market Analysis, Insights and Forecast - by Price Trend Analysis
- 10. Middle East & Africa Packaging Market Analysis, Insights and Forecast, 2020-2032
- 10.1. Market Analysis, Insights and Forecast - by Production Analysis
- 10.2. Market Analysis, Insights and Forecast - by Consumption Analysis
- 10.3. Market Analysis, Insights and Forecast - by Import Market Analysis (Value & Volume)
- 10.4. Market Analysis, Insights and Forecast - by Export Market Analysis (Value & Volume)
- 10.5. Market Analysis, Insights and Forecast - by Price Trend Analysis
- 11. Asia Pacific Packaging Market Analysis, Insights and Forecast, 2020-2032
- 11.1. Market Analysis, Insights and Forecast - by Production Analysis
- 11.2. Market Analysis, Insights and Forecast - by Consumption Analysis
- 11.3. Market Analysis, Insights and Forecast - by Import Market Analysis (Value & Volume)
- 11.4. Market Analysis, Insights and Forecast - by Export Market Analysis (Value & Volume)
- 11.5. Market Analysis, Insights and Forecast - by Price Trend Analysis
- 12. Competitive Analysis
- 12.1. Company Profiles
- 12.1.1 International Paper Company
- 12.1.1.1. Company Overview
- 12.1.1.2. Products
- 12.1.1.3. Company Financials
- 12.1.1.4. SWOT Analysis
- 12.1.2 Mondi Group
- 12.1.2.1. Company Overview
- 12.1.2.2. Products
- 12.1.2.3. Company Financials
- 12.1.2.4. SWOT Analysis
- 12.1.3 Smurfit Kappa Group
- 12.1.3.1. Company Overview
- 12.1.3.2. Products
- 12.1.3.3. Company Financials
- 12.1.3.4. SWOT Analysis
- 12.1.4 DS Smith PLC
- 12.1.4.1. Company Overview
- 12.1.4.2. Products
- 12.1.4.3. Company Financials
- 12.1.4.4. SWOT Analysis
- 12.1.5 WestRock Company
- 12.1.5.1. Company Overview
- 12.1.5.2. Products
- 12.1.5.3. Company Financials
- 12.1.5.4. SWOT Analysis
- 12.1.6 UFlex Limited
- 12.1.6.1. Company Overview
- 12.1.6.2. Products
- 12.1.6.3. Company Financials
- 12.1.6.4. SWOT Analysis
- 12.1.7 Huhtamaki Oyj
- 12.1.7.1. Company Overview
- 12.1.7.2. Products
- 12.1.7.3. Company Financials
- 12.1.7.4. SWOT Analysis
- 12.1.8 Amcor Group GmbH
- 12.1.8.1. Company Overview
- 12.1.8.2. Products
- 12.1.8.3. Company Financials
- 12.1.8.4. SWOT Analysis
- 12.1.9 Coveris Holding SA
- 12.1.9.1. Company Overview
- 12.1.9.2. Products
- 12.1.9.3. Company Financials
- 12.1.9.4. SWOT Analysis
- 12.1.10 Sealed Air Corporation
- 12.1.10.1. Company Overview
- 12.1.10.2. Products
- 12.1.10.3. Company Financials
- 12.1.10.4. SWOT Analysis
- 12.1.11 Greif Inc
- 12.1.11.1. Company Overview
- 12.1.11.2. Products
- 12.1.11.3. Company Financials
- 12.1.11.4. SWOT Analysis
- 12.1.12 Sonoco Products Company
- 12.1.12.1. Company Overview
- 12.1.12.2. Products
- 12.1.12.3. Company Financials
- 12.1.12.4. SWOT Analysis
- 12.1.13 Aptar Group Inc
- 12.1.13.1. Company Overview
- 12.1.13.2. Products
- 12.1.13.3. Company Financials
- 12.1.13.4. SWOT Analysis
- 12.1.14 Berry Global Group Inc
- 12.1.14.1. Company Overview
- 12.1.14.2. Products
- 12.1.14.3. Company Financials
- 12.1.14.4. SWOT Analysis
- 12.1.15 Alpla Group
- 12.1.15.1. Company Overview
- 12.1.15.2. Products
- 12.1.15.3. Company Financials
- 12.1.15.4. SWOT Analysis
- 12.1.16 Owens-illinois Inc
- 12.1.16.1. Company Overview
- 12.1.16.2. Products
- 12.1.16.3. Company Financials
- 12.1.16.4. SWOT Analysis
- 12.1.17 Vidrala S A
- 12.1.17.1. Company Overview
- 12.1.17.2. Products
- 12.1.17.3. Company Financials
- 12.1.17.4. SWOT Analysis
- 12.1.18 Verallia SA
- 12.1.18.1. Company Overview
- 12.1.18.2. Products
- 12.1.18.3. Company Financials
- 12.1.18.4. SWOT Analysis
- 12.1.19 Gerresheimer AG
- 12.1.19.1. Company Overview
- 12.1.19.2. Products
- 12.1.19.3. Company Financials
- 12.1.19.4. SWOT Analysis
- 12.1.20 Vitro S A B De C V
- 12.1.20.1. Company Overview
- 12.1.20.2. Products
- 12.1.20.3. Company Financials
- 12.1.20.4. SWOT Analysis
- 12.1.21 Ball Corporation
- 12.1.21.1. Company Overview
- 12.1.21.2. Products
- 12.1.21.3. Company Financials
- 12.1.21.4. SWOT Analysis
- 12.1.22 Crown Holdings Inc
- 12.1.22.1. Company Overview
- 12.1.22.2. Products
- 12.1.22.3. Company Financials
- 12.1.22.4. SWOT Analysis
- 12.1.23 Ardagh Group S A
- 12.1.23.1. Company Overview
- 12.1.23.2. Products
- 12.1.23.3. Company Financials
- 12.1.23.4. SWOT Analysis
- 12.1.24 Can Pack SA
- 12.1.24.1. Company Overview
- 12.1.24.2. Products
- 12.1.24.3. Company Financials
- 12.1.24.4. SWOT Analysis
- 12.1.25 Silgan Holdings Inc
- 12.1.25.1. Company Overview
- 12.1.25.2. Products
- 12.1.25.3. Company Financials
- 12.1.25.4. SWOT Analysis
- 12.1.1 International Paper Company
- 12.2. Market Entropy
- 12.2.1 Company's Key Areas Served
- 12.2.2 Recent Developments
- 12.3. Company Market Share Analysis 2025
- 12.3.1 Top 5 Companies Market Share Analysis
- 12.3.2 Top 3 Companies Market Share Analysis
- 12.4. List of Potential Customers
- 13. Research Methodology
List of Figures
- Figure 1: Global Packaging Market Revenue Breakdown (Million, %) by Region 2025 & 2033
- Figure 2: Global Packaging Market Volume Breakdown (Trillion, %) by Region 2025 & 2033
- Figure 3: North America Packaging Market Revenue (Million), by Production Analysis 2025 & 2033
- Figure 4: North America Packaging Market Volume (Trillion), by Production Analysis 2025 & 2033
- Figure 5: North America Packaging Market Revenue Share (%), by Production Analysis 2025 & 2033
- Figure 6: North America Packaging Market Volume Share (%), by Production Analysis 2025 & 2033
- Figure 7: North America Packaging Market Revenue (Million), by Consumption Analysis 2025 & 2033
- Figure 8: North America Packaging Market Volume (Trillion), by Consumption Analysis 2025 & 2033
- Figure 9: North America Packaging Market Revenue Share (%), by Consumption Analysis 2025 & 2033
- Figure 10: North America Packaging Market Volume Share (%), by Consumption Analysis 2025 & 2033
- Figure 11: North America Packaging Market Revenue (Million), by Import Market Analysis (Value & Volume) 2025 & 2033
- Figure 12: North America Packaging Market Volume (Trillion), by Import Market Analysis (Value & Volume) 2025 & 2033
- Figure 13: North America Packaging Market Revenue Share (%), by Import Market Analysis (Value & Volume) 2025 & 2033
- Figure 14: North America Packaging Market Volume Share (%), by Import Market Analysis (Value & Volume) 2025 & 2033
- Figure 15: North America Packaging Market Revenue (Million), by Export Market Analysis (Value & Volume) 2025 & 2033
- Figure 16: North America Packaging Market Volume (Trillion), by Export Market Analysis (Value & Volume) 2025 & 2033
- Figure 17: North America Packaging Market Revenue Share (%), by Export Market Analysis (Value & Volume) 2025 & 2033
- Figure 18: North America Packaging Market Volume Share (%), by Export Market Analysis (Value & Volume) 2025 & 2033
- Figure 19: North America Packaging Market Revenue (Million), by Price Trend Analysis 2025 & 2033
- Figure 20: North America Packaging Market Volume (Trillion), by Price Trend Analysis 2025 & 2033
- Figure 21: North America Packaging Market Revenue Share (%), by Price Trend Analysis 2025 & 2033
- Figure 22: North America Packaging Market Volume Share (%), by Price Trend Analysis 2025 & 2033
- Figure 23: North America Packaging Market Revenue (Million), by Country 2025 & 2033
- Figure 24: North America Packaging Market Volume (Trillion), by Country 2025 & 2033
- Figure 25: North America Packaging Market Revenue Share (%), by Country 2025 & 2033
- Figure 26: North America Packaging Market Volume Share (%), by Country 2025 & 2033
- Figure 27: South America Packaging Market Revenue (Million), by Production Analysis 2025 & 2033
- Figure 28: South America Packaging Market Volume (Trillion), by Production Analysis 2025 & 2033
- Figure 29: South America Packaging Market Revenue Share (%), by Production Analysis 2025 & 2033
- Figure 30: South America Packaging Market Volume Share (%), by Production Analysis 2025 & 2033
- Figure 31: South America Packaging Market Revenue (Million), by Consumption Analysis 2025 & 2033
- Figure 32: South America Packaging Market Volume (Trillion), by Consumption Analysis 2025 & 2033
- Figure 33: South America Packaging Market Revenue Share (%), by Consumption Analysis 2025 & 2033
- Figure 34: South America Packaging Market Volume Share (%), by Consumption Analysis 2025 & 2033
- Figure 35: South America Packaging Market Revenue (Million), by Import Market Analysis (Value & Volume) 2025 & 2033
- Figure 36: South America Packaging Market Volume (Trillion), by Import Market Analysis (Value & Volume) 2025 & 2033
- Figure 37: South America Packaging Market Revenue Share (%), by Import Market Analysis (Value & Volume) 2025 & 2033
- Figure 38: South America Packaging Market Volume Share (%), by Import Market Analysis (Value & Volume) 2025 & 2033
- Figure 39: South America Packaging Market Revenue (Million), by Export Market Analysis (Value & Volume) 2025 & 2033
- Figure 40: South America Packaging Market Volume (Trillion), by Export Market Analysis (Value & Volume) 2025 & 2033
- Figure 41: South America Packaging Market Revenue Share (%), by Export Market Analysis (Value & Volume) 2025 & 2033
- Figure 42: South America Packaging Market Volume Share (%), by Export Market Analysis (Value & Volume) 2025 & 2033
- Figure 43: South America Packaging Market Revenue (Million), by Price Trend Analysis 2025 & 2033
- Figure 44: South America Packaging Market Volume (Trillion), by Price Trend Analysis 2025 & 2033
- Figure 45: South America Packaging Market Revenue Share (%), by Price Trend Analysis 2025 & 2033
- Figure 46: South America Packaging Market Volume Share (%), by Price Trend Analysis 2025 & 2033
- Figure 47: South America Packaging Market Revenue (Million), by Country 2025 & 2033
- Figure 48: South America Packaging Market Volume (Trillion), by Country 2025 & 2033
- Figure 49: South America Packaging Market Revenue Share (%), by Country 2025 & 2033
- Figure 50: South America Packaging Market Volume Share (%), by Country 2025 & 2033
- Figure 51: Europe Packaging Market Revenue (Million), by Production Analysis 2025 & 2033
- Figure 52: Europe Packaging Market Volume (Trillion), by Production Analysis 2025 & 2033
- Figure 53: Europe Packaging Market Revenue Share (%), by Production Analysis 2025 & 2033
- Figure 54: Europe Packaging Market Volume Share (%), by Production Analysis 2025 & 2033
- Figure 55: Europe Packaging Market Revenue (Million), by Consumption Analysis 2025 & 2033
- Figure 56: Europe Packaging Market Volume (Trillion), by Consumption Analysis 2025 & 2033
- Figure 57: Europe Packaging Market Revenue Share (%), by Consumption Analysis 2025 & 2033
- Figure 58: Europe Packaging Market Volume Share (%), by Consumption Analysis 2025 & 2033
- Figure 59: Europe Packaging Market Revenue (Million), by Import Market Analysis (Value & Volume) 2025 & 2033
- Figure 60: Europe Packaging Market Volume (Trillion), by Import Market Analysis (Value & Volume) 2025 & 2033
- Figure 61: Europe Packaging Market Revenue Share (%), by Import Market Analysis (Value & Volume) 2025 & 2033
- Figure 62: Europe Packaging Market Volume Share (%), by Import Market Analysis (Value & Volume) 2025 & 2033
- Figure 63: Europe Packaging Market Revenue (Million), by Export Market Analysis (Value & Volume) 2025 & 2033
- Figure 64: Europe Packaging Market Volume (Trillion), by Export Market Analysis (Value & Volume) 2025 & 2033
- Figure 65: Europe Packaging Market Revenue Share (%), by Export Market Analysis (Value & Volume) 2025 & 2033
- Figure 66: Europe Packaging Market Volume Share (%), by Export Market Analysis (Value & Volume) 2025 & 2033
- Figure 67: Europe Packaging Market Revenue (Million), by Price Trend Analysis 2025 & 2033
- Figure 68: Europe Packaging Market Volume (Trillion), by Price Trend Analysis 2025 & 2033
- Figure 69: Europe Packaging Market Revenue Share (%), by Price Trend Analysis 2025 & 2033
- Figure 70: Europe Packaging Market Volume Share (%), by Price Trend Analysis 2025 & 2033
- Figure 71: Europe Packaging Market Revenue (Million), by Country 2025 & 2033
- Figure 72: Europe Packaging Market Volume (Trillion), by Country 2025 & 2033
- Figure 73: Europe Packaging Market Revenue Share (%), by Country 2025 & 2033
- Figure 74: Europe Packaging Market Volume Share (%), by Country 2025 & 2033
- Figure 75: Middle East & Africa Packaging Market Revenue (Million), by Production Analysis 2025 & 2033
- Figure 76: Middle East & Africa Packaging Market Volume (Trillion), by Production Analysis 2025 & 2033
- Figure 77: Middle East & Africa Packaging Market Revenue Share (%), by Production Analysis 2025 & 2033
- Figure 78: Middle East & Africa Packaging Market Volume Share (%), by Production Analysis 2025 & 2033
- Figure 79: Middle East & Africa Packaging Market Revenue (Million), by Consumption Analysis 2025 & 2033
- Figure 80: Middle East & Africa Packaging Market Volume (Trillion), by Consumption Analysis 2025 & 2033
- Figure 81: Middle East & Africa Packaging Market Revenue Share (%), by Consumption Analysis 2025 & 2033
- Figure 82: Middle East & Africa Packaging Market Volume Share (%), by Consumption Analysis 2025 & 2033
- Figure 83: Middle East & Africa Packaging Market Revenue (Million), by Import Market Analysis (Value & Volume) 2025 & 2033
- Figure 84: Middle East & Africa Packaging Market Volume (Trillion), by Import Market Analysis (Value & Volume) 2025 & 2033
- Figure 85: Middle East & Africa Packaging Market Revenue Share (%), by Import Market Analysis (Value & Volume) 2025 & 2033
- Figure 86: Middle East & Africa Packaging Market Volume Share (%), by Import Market Analysis (Value & Volume) 2025 & 2033
- Figure 87: Middle East & Africa Packaging Market Revenue (Million), by Export Market Analysis (Value & Volume) 2025 & 2033
- Figure 88: Middle East & Africa Packaging Market Volume (Trillion), by Export Market Analysis (Value & Volume) 2025 & 2033
- Figure 89: Middle East & Africa Packaging Market Revenue Share (%), by Export Market Analysis (Value & Volume) 2025 & 2033
- Figure 90: Middle East & Africa Packaging Market Volume Share (%), by Export Market Analysis (Value & Volume) 2025 & 2033
- Figure 91: Middle East & Africa Packaging Market Revenue (Million), by Price Trend Analysis 2025 & 2033
- Figure 92: Middle East & Africa Packaging Market Volume (Trillion), by Price Trend Analysis 2025 & 2033
- Figure 93: Middle East & Africa Packaging Market Revenue Share (%), by Price Trend Analysis 2025 & 2033
- Figure 94: Middle East & Africa Packaging Market Volume Share (%), by Price Trend Analysis 2025 & 2033
- Figure 95: Middle East & Africa Packaging Market Revenue (Million), by Country 2025 & 2033
- Figure 96: Middle East & Africa Packaging Market Volume (Trillion), by Country 2025 & 2033
- Figure 97: Middle East & Africa Packaging Market Revenue Share (%), by Country 2025 & 2033
- Figure 98: Middle East & Africa Packaging Market Volume Share (%), by Country 2025 & 2033
- Figure 99: Asia Pacific Packaging Market Revenue (Million), by Production Analysis 2025 & 2033
- Figure 100: Asia Pacific Packaging Market Volume (Trillion), by Production Analysis 2025 & 2033
- Figure 101: Asia Pacific Packaging Market Revenue Share (%), by Production Analysis 2025 & 2033
- Figure 102: Asia Pacific Packaging Market Volume Share (%), by Production Analysis 2025 & 2033
- Figure 103: Asia Pacific Packaging Market Revenue (Million), by Consumption Analysis 2025 & 2033
- Figure 104: Asia Pacific Packaging Market Volume (Trillion), by Consumption Analysis 2025 & 2033
- Figure 105: Asia Pacific Packaging Market Revenue Share (%), by Consumption Analysis 2025 & 2033
- Figure 106: Asia Pacific Packaging Market Volume Share (%), by Consumption Analysis 2025 & 2033
- Figure 107: Asia Pacific Packaging Market Revenue (Million), by Import Market Analysis (Value & Volume) 2025 & 2033
- Figure 108: Asia Pacific Packaging Market Volume (Trillion), by Import Market Analysis (Value & Volume) 2025 & 2033
- Figure 109: Asia Pacific Packaging Market Revenue Share (%), by Import Market Analysis (Value & Volume) 2025 & 2033
- Figure 110: Asia Pacific Packaging Market Volume Share (%), by Import Market Analysis (Value & Volume) 2025 & 2033
- Figure 111: Asia Pacific Packaging Market Revenue (Million), by Export Market Analysis (Value & Volume) 2025 & 2033
- Figure 112: Asia Pacific Packaging Market Volume (Trillion), by Export Market Analysis (Value & Volume) 2025 & 2033
- Figure 113: Asia Pacific Packaging Market Revenue Share (%), by Export Market Analysis (Value & Volume) 2025 & 2033
- Figure 114: Asia Pacific Packaging Market Volume Share (%), by Export Market Analysis (Value & Volume) 2025 & 2033
- Figure 115: Asia Pacific Packaging Market Revenue (Million), by Price Trend Analysis 2025 & 2033
- Figure 116: Asia Pacific Packaging Market Volume (Trillion), by Price Trend Analysis 2025 & 2033
- Figure 117: Asia Pacific Packaging Market Revenue Share (%), by Price Trend Analysis 2025 & 2033
- Figure 118: Asia Pacific Packaging Market Volume Share (%), by Price Trend Analysis 2025 & 2033
- Figure 119: Asia Pacific Packaging Market Revenue (Million), by Country 2025 & 2033
- Figure 120: Asia Pacific Packaging Market Volume (Trillion), by Country 2025 & 2033
- Figure 121: Asia Pacific Packaging Market Revenue Share (%), by Country 2025 & 2033
- Figure 122: Asia Pacific Packaging Market Volume Share (%), by Country 2025 & 2033
List of Tables
- Table 1: Global Packaging Market Revenue Million Forecast, by Production Analysis 2020 & 2033
- Table 2: Global Packaging Market Volume Trillion Forecast, by Production Analysis 2020 & 2033
- Table 3: Global Packaging Market Revenue Million Forecast, by Consumption Analysis 2020 & 2033
- Table 4: Global Packaging Market Volume Trillion Forecast, by Consumption Analysis 2020 & 2033
- Table 5: Global Packaging Market Revenue Million Forecast, by Import Market Analysis (Value & Volume) 2020 & 2033
- Table 6: Global Packaging Market Volume Trillion Forecast, by Import Market Analysis (Value & Volume) 2020 & 2033
- Table 7: Global Packaging Market Revenue Million Forecast, by Export Market Analysis (Value & Volume) 2020 & 2033
- Table 8: Global Packaging Market Volume Trillion Forecast, by Export Market Analysis (Value & Volume) 2020 & 2033
- Table 9: Global Packaging Market Revenue Million Forecast, by Price Trend Analysis 2020 & 2033
- Table 10: Global Packaging Market Volume Trillion Forecast, by Price Trend Analysis 2020 & 2033
- Table 11: Global Packaging Market Revenue Million Forecast, by Region 2020 & 2033
- Table 12: Global Packaging Market Volume Trillion Forecast, by Region 2020 & 2033
- Table 13: Global Packaging Market Revenue Million Forecast, by Production Analysis 2020 & 2033
- Table 14: Global Packaging Market Volume Trillion Forecast, by Production Analysis 2020 & 2033
- Table 15: Global Packaging Market Revenue Million Forecast, by Consumption Analysis 2020 & 2033
- Table 16: Global Packaging Market Volume Trillion Forecast, by Consumption Analysis 2020 & 2033
- Table 17: Global Packaging Market Revenue Million Forecast, by Import Market Analysis (Value & Volume) 2020 & 2033
- Table 18: Global Packaging Market Volume Trillion Forecast, by Import Market Analysis (Value & Volume) 2020 & 2033
- Table 19: Global Packaging Market Revenue Million Forecast, by Export Market Analysis (Value & Volume) 2020 & 2033
- Table 20: Global Packaging Market Volume Trillion Forecast, by Export Market Analysis (Value & Volume) 2020 & 2033
- Table 21: Global Packaging Market Revenue Million Forecast, by Price Trend Analysis 2020 & 2033
- Table 22: Global Packaging Market Volume Trillion Forecast, by Price Trend Analysis 2020 & 2033
- Table 23: Global Packaging Market Revenue Million Forecast, by Country 2020 & 2033
- Table 24: Global Packaging Market Volume Trillion Forecast, by Country 2020 & 2033
- Table 25: United States Packaging Market Revenue (Million) Forecast, by Application 2020 & 2033
- Table 26: United States Packaging Market Volume (Trillion) Forecast, by Application 2020 & 2033
- Table 27: Canada Packaging Market Revenue (Million) Forecast, by Application 2020 & 2033
- Table 28: Canada Packaging Market Volume (Trillion) Forecast, by Application 2020 & 2033
- Table 29: Mexico Packaging Market Revenue (Million) Forecast, by Application 2020 & 2033
- Table 30: Mexico Packaging Market Volume (Trillion) Forecast, by Application 2020 & 2033
- Table 31: Global Packaging Market Revenue Million Forecast, by Production Analysis 2020 & 2033
- Table 32: Global Packaging Market Volume Trillion Forecast, by Production Analysis 2020 & 2033
- Table 33: Global Packaging Market Revenue Million Forecast, by Consumption Analysis 2020 & 2033
- Table 34: Global Packaging Market Volume Trillion Forecast, by Consumption Analysis 2020 & 2033
- Table 35: Global Packaging Market Revenue Million Forecast, by Import Market Analysis (Value & Volume) 2020 & 2033
- Table 36: Global Packaging Market Volume Trillion Forecast, by Import Market Analysis (Value & Volume) 2020 & 2033
- Table 37: Global Packaging Market Revenue Million Forecast, by Export Market Analysis (Value & Volume) 2020 & 2033
- Table 38: Global Packaging Market Volume Trillion Forecast, by Export Market Analysis (Value & Volume) 2020 & 2033
- Table 39: Global Packaging Market Revenue Million Forecast, by Price Trend Analysis 2020 & 2033
- Table 40: Global Packaging Market Volume Trillion Forecast, by Price Trend Analysis 2020 & 2033
- Table 41: Global Packaging Market Revenue Million Forecast, by Country 2020 & 2033
- Table 42: Global Packaging Market Volume Trillion Forecast, by Country 2020 & 2033
- Table 43: Brazil Packaging Market Revenue (Million) Forecast, by Application 2020 & 2033
- Table 44: Brazil Packaging Market Volume (Trillion) Forecast, by Application 2020 & 2033
- Table 45: Argentina Packaging Market Revenue (Million) Forecast, by Application 2020 & 2033
- Table 46: Argentina Packaging Market Volume (Trillion) Forecast, by Application 2020 & 2033
- Table 47: Rest of South America Packaging Market Revenue (Million) Forecast, by Application 2020 & 2033
- Table 48: Rest of South America Packaging Market Volume (Trillion) Forecast, by Application 2020 & 2033
- Table 49: Global Packaging Market Revenue Million Forecast, by Production Analysis 2020 & 2033
- Table 50: Global Packaging Market Volume Trillion Forecast, by Production Analysis 2020 & 2033
- Table 51: Global Packaging Market Revenue Million Forecast, by Consumption Analysis 2020 & 2033
- Table 52: Global Packaging Market Volume Trillion Forecast, by Consumption Analysis 2020 & 2033
- Table 53: Global Packaging Market Revenue Million Forecast, by Import Market Analysis (Value & Volume) 2020 & 2033
- Table 54: Global Packaging Market Volume Trillion Forecast, by Import Market Analysis (Value & Volume) 2020 & 2033
- Table 55: Global Packaging Market Revenue Million Forecast, by Export Market Analysis (Value & Volume) 2020 & 2033
- Table 56: Global Packaging Market Volume Trillion Forecast, by Export Market Analysis (Value & Volume) 2020 & 2033
- Table 57: Global Packaging Market Revenue Million Forecast, by Price Trend Analysis 2020 & 2033
- Table 58: Global Packaging Market Volume Trillion Forecast, by Price Trend Analysis 2020 & 2033
- Table 59: Global Packaging Market Revenue Million Forecast, by Country 2020 & 2033
- Table 60: Global Packaging Market Volume Trillion Forecast, by Country 2020 & 2033
- Table 61: United Kingdom Packaging Market Revenue (Million) Forecast, by Application 2020 & 2033
- Table 62: United Kingdom Packaging Market Volume (Trillion) Forecast, by Application 2020 & 2033
- Table 63: Germany Packaging Market Revenue (Million) Forecast, by Application 2020 & 2033
- Table 64: Germany Packaging Market Volume (Trillion) Forecast, by Application 2020 & 2033
- Table 65: France Packaging Market Revenue (Million) Forecast, by Application 2020 & 2033
- Table 66: France Packaging Market Volume (Trillion) Forecast, by Application 2020 & 2033
- Table 67: Italy Packaging Market Revenue (Million) Forecast, by Application 2020 & 2033
- Table 68: Italy Packaging Market Volume (Trillion) Forecast, by Application 2020 & 2033
- Table 69: Spain Packaging Market Revenue (Million) Forecast, by Application 2020 & 2033
- Table 70: Spain Packaging Market Volume (Trillion) Forecast, by Application 2020 & 2033
- Table 71: Russia Packaging Market Revenue (Million) Forecast, by Application 2020 & 2033
- Table 72: Russia Packaging Market Volume (Trillion) Forecast, by Application 2020 & 2033
- Table 73: Benelux Packaging Market Revenue (Million) Forecast, by Application 2020 & 2033
- Table 74: Benelux Packaging Market Volume (Trillion) Forecast, by Application 2020 & 2033
- Table 75: Nordics Packaging Market Revenue (Million) Forecast, by Application 2020 & 2033
- Table 76: Nordics Packaging Market Volume (Trillion) Forecast, by Application 2020 & 2033
- Table 77: Rest of Europe Packaging Market Revenue (Million) Forecast, by Application 2020 & 2033
- Table 78: Rest of Europe Packaging Market Volume (Trillion) Forecast, by Application 2020 & 2033
- Table 79: Global Packaging Market Revenue Million Forecast, by Production Analysis 2020 & 2033
- Table 80: Global Packaging Market Volume Trillion Forecast, by Production Analysis 2020 & 2033
- Table 81: Global Packaging Market Revenue Million Forecast, by Consumption Analysis 2020 & 2033
- Table 82: Global Packaging Market Volume Trillion Forecast, by Consumption Analysis 2020 & 2033
- Table 83: Global Packaging Market Revenue Million Forecast, by Import Market Analysis (Value & Volume) 2020 & 2033
- Table 84: Global Packaging Market Volume Trillion Forecast, by Import Market Analysis (Value & Volume) 2020 & 2033
- Table 85: Global Packaging Market Revenue Million Forecast, by Export Market Analysis (Value & Volume) 2020 & 2033
- Table 86: Global Packaging Market Volume Trillion Forecast, by Export Market Analysis (Value & Volume) 2020 & 2033
- Table 87: Global Packaging Market Revenue Million Forecast, by Price Trend Analysis 2020 & 2033
- Table 88: Global Packaging Market Volume Trillion Forecast, by Price Trend Analysis 2020 & 2033
- Table 89: Global Packaging Market Revenue Million Forecast, by Country 2020 & 2033
- Table 90: Global Packaging Market Volume Trillion Forecast, by Country 2020 & 2033
- Table 91: Turkey Packaging Market Revenue (Million) Forecast, by Application 2020 & 2033
- Table 92: Turkey Packaging Market Volume (Trillion) Forecast, by Application 2020 & 2033
- Table 93: Israel Packaging Market Revenue (Million) Forecast, by Application 2020 & 2033
- Table 94: Israel Packaging Market Volume (Trillion) Forecast, by Application 2020 & 2033
- Table 95: GCC Packaging Market Revenue (Million) Forecast, by Application 2020 & 2033
- Table 96: GCC Packaging Market Volume (Trillion) Forecast, by Application 2020 & 2033
- Table 97: North Africa Packaging Market Revenue (Million) Forecast, by Application 2020 & 2033
- Table 98: North Africa Packaging Market Volume (Trillion) Forecast, by Application 2020 & 2033
- Table 99: South Africa Packaging Market Revenue (Million) Forecast, by Application 2020 & 2033
- Table 100: South Africa Packaging Market Volume (Trillion) Forecast, by Application 2020 & 2033
- Table 101: Rest of Middle East & Africa Packaging Market Revenue (Million) Forecast, by Application 2020 & 2033
- Table 102: Rest of Middle East & Africa Packaging Market Volume (Trillion) Forecast, by Application 2020 & 2033
- Table 103: Global Packaging Market Revenue Million Forecast, by Production Analysis 2020 & 2033
- Table 104: Global Packaging Market Volume Trillion Forecast, by Production Analysis 2020 & 2033
- Table 105: Global Packaging Market Revenue Million Forecast, by Consumption Analysis 2020 & 2033
- Table 106: Global Packaging Market Volume Trillion Forecast, by Consumption Analysis 2020 & 2033
- Table 107: Global Packaging Market Revenue Million Forecast, by Import Market Analysis (Value & Volume) 2020 & 2033
- Table 108: Global Packaging Market Volume Trillion Forecast, by Import Market Analysis (Value & Volume) 2020 & 2033
- Table 109: Global Packaging Market Revenue Million Forecast, by Export Market Analysis (Value & Volume) 2020 & 2033
- Table 110: Global Packaging Market Volume Trillion Forecast, by Export Market Analysis (Value & Volume) 2020 & 2033
- Table 111: Global Packaging Market Revenue Million Forecast, by Price Trend Analysis 2020 & 2033
- Table 112: Global Packaging Market Volume Trillion Forecast, by Price Trend Analysis 2020 & 2033
- Table 113: Global Packaging Market Revenue Million Forecast, by Country 2020 & 2033
- Table 114: Global Packaging Market Volume Trillion Forecast, by Country 2020 & 2033
- Table 115: China Packaging Market Revenue (Million) Forecast, by Application 2020 & 2033
- Table 116: China Packaging Market Volume (Trillion) Forecast, by Application 2020 & 2033
- Table 117: India Packaging Market Revenue (Million) Forecast, by Application 2020 & 2033
- Table 118: India Packaging Market Volume (Trillion) Forecast, by Application 2020 & 2033
- Table 119: Japan Packaging Market Revenue (Million) Forecast, by Application 2020 & 2033
- Table 120: Japan Packaging Market Volume (Trillion) Forecast, by Application 2020 & 2033
- Table 121: South Korea Packaging Market Revenue (Million) Forecast, by Application 2020 & 2033
- Table 122: South Korea Packaging Market Volume (Trillion) Forecast, by Application 2020 & 2033
- Table 123: ASEAN Packaging Market Revenue (Million) Forecast, by Application 2020 & 2033
- Table 124: ASEAN Packaging Market Volume (Trillion) Forecast, by Application 2020 & 2033
- Table 125: Oceania Packaging Market Revenue (Million) Forecast, by Application 2020 & 2033
- Table 126: Oceania Packaging Market Volume (Trillion) Forecast, by Application 2020 & 2033
- Table 127: Rest of Asia Pacific Packaging Market Revenue (Million) Forecast, by Application 2020 & 2033
- Table 128: Rest of Asia Pacific Packaging Market Volume (Trillion) Forecast, by Application 2020 & 2033
Frequently Asked Questions
1. What is the projected Compound Annual Growth Rate (CAGR) of the Packaging Market?
The projected CAGR is approximately 3.89%.
2. Which companies are prominent players in the Packaging Market?
Key companies in the market include International Paper Company, Mondi Group, Smurfit Kappa Group, DS Smith PLC, WestRock Company, UFlex Limited, Huhtamaki Oyj, Amcor Group GmbH, Coveris Holding SA, Sealed Air Corporation, Greif Inc, Sonoco Products Company, Aptar Group Inc, Berry Global Group Inc, Alpla Group, Owens-illinois Inc, Vidrala S A, Verallia SA, Gerresheimer AG, Vitro S A B De C V, Ball Corporation, Crown Holdings Inc, Ardagh Group S A, Can Pack SA, Silgan Holdings Inc.
3. What are the main segments of the Packaging Market?
The market segments include Production Analysis, Consumption Analysis, Import Market Analysis (Value & Volume), Export Market Analysis (Value & Volume), Price Trend Analysis.
4. Can you provide details about the market size?
The market size is estimated to be USD 1.14 Million as of 2022.
5. What are some drivers contributing to market growth?
N/A
6. What are the notable trends driving market growth?
Paper and Paperboard Packaging Products to Witness the Highest Growth.
7. Are there any restraints impacting market growth?
N/A
8. Can you provide examples of recent developments in the market?
June 2024: Sonoco Products Company announced its agreement to acquire Eviosys, a Europe manufacturer of food cans, ends, and closures, from KPS Capital Partners, LP, at around USD 3.9 billion.
9. What pricing options are available for accessing the report?
Pricing options include single-user, multi-user, and enterprise licenses priced at USD 3800, USD 4500, and USD 5800 respectively.
10. Is the market size provided in terms of value or volume?
The market size is provided in terms of value, measured in Million and volume, measured in Trillion.
11. Are there any specific market keywords associated with the report?
Yes, the market keyword associated with the report is "Packaging Market," which aids in identifying and referencing the specific market segment covered.
12. How do I determine which pricing option suits my needs best?
The pricing options vary based on user requirements and access needs. Individual users may opt for single-user licenses, while businesses requiring broader access may choose multi-user or enterprise licenses for cost-effective access to the report.
13. Are there any additional resources or data provided in the Packaging Market report?
While the report offers comprehensive insights, it's advisable to review the specific contents or supplementary materials provided to ascertain if additional resources or data are available.
14. How can I stay updated on further developments or reports in the Packaging Market?
To stay informed about further developments, trends, and reports in the Packaging Market, consider subscribing to industry newsletters, following relevant companies and organizations, or regularly checking reputable industry news sources and publications.
Methodology
Step 1 - Identification of Relevant Samples Size from Population Database


Step 2 - Approaches for Defining Global Market Size (Value, Volume* & Price*)

Note*: In applicable scenarios
Step 3 - Data Sources
Primary Research
- Web Analytics
- Survey Reports
- Research Institute
- Latest Research Reports
- Opinion Leaders
Secondary Research
- Annual Reports
- White Paper
- Latest Press Release
- Industry Association
- Paid Database
- Investor Presentations

Step 4 - Data Triangulation
Involves using different sources of information in order to increase the validity of a study
These sources are likely to be stakeholders in a program - participants, other researchers, program staff, other community members, and so on.
Then we put all data in single framework & apply various statistical tools to find out the dynamic on the market.
During the analysis stage, feedback from the stakeholder groups would be compared to determine areas of agreement as well as areas of divergence