

Key Insights
The global pharmaceutical glass tubing market is poised for substantial growth, projected to reach $9.56 billion by 2025. This market is expected to expand at a compound annual growth rate (CAGR) of 7.3% from 2025 to 2033. Key growth drivers include escalating demand for injectable pharmaceuticals and vaccines, particularly in emerging markets, and increasingly stringent regulatory mandates for sterile and tamper-evident pharmaceutical packaging. Technological advancements in glass manufacturing are also enhancing product quality and reducing production costs, further stimulating market expansion. The primary applications for pharmaceutical glass tubing include vials, ampoules, cartridges, and syringes. While North America and Europe currently dominate the market, the Asia-Pacific region is anticipated to experience significant growth due to expanding healthcare infrastructure and rising pharmaceutical production in key economies such as China and India.
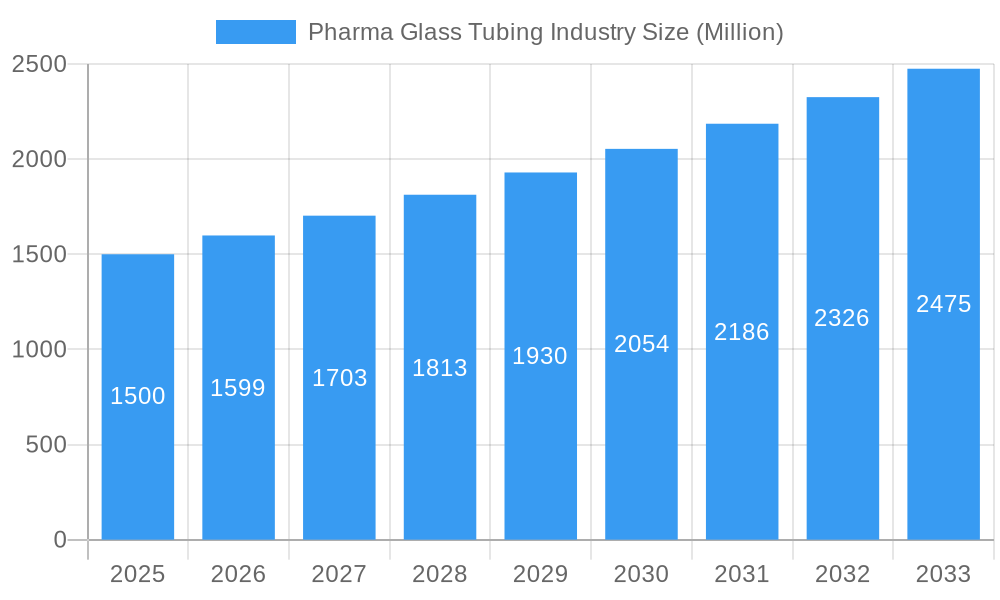
Pharma Glass Tubing Industry Market Size (In Billion)
The forecast period (2025-2033) is expected to see evolving market dynamics. Established market leaders will continue to hold strong positions, but increasing demand will present opportunities for new entrants, especially those specializing in niche applications or sustainable manufacturing. Growth will remain geographically diverse, with emerging markets offering considerable potential but necessitating careful navigation of regulatory environments and infrastructure development. Future expansion will likely be driven by innovation in glass formulations, the development of eco-friendly packaging solutions, and efficient supply chain management. The critical role of reliable pharmaceutical packaging, underscored by recent global health events, reinforces a positive market outlook. Furthermore, the rise of personalized medicine and advanced drug delivery systems will spur demand for specialized glass tubing solutions.
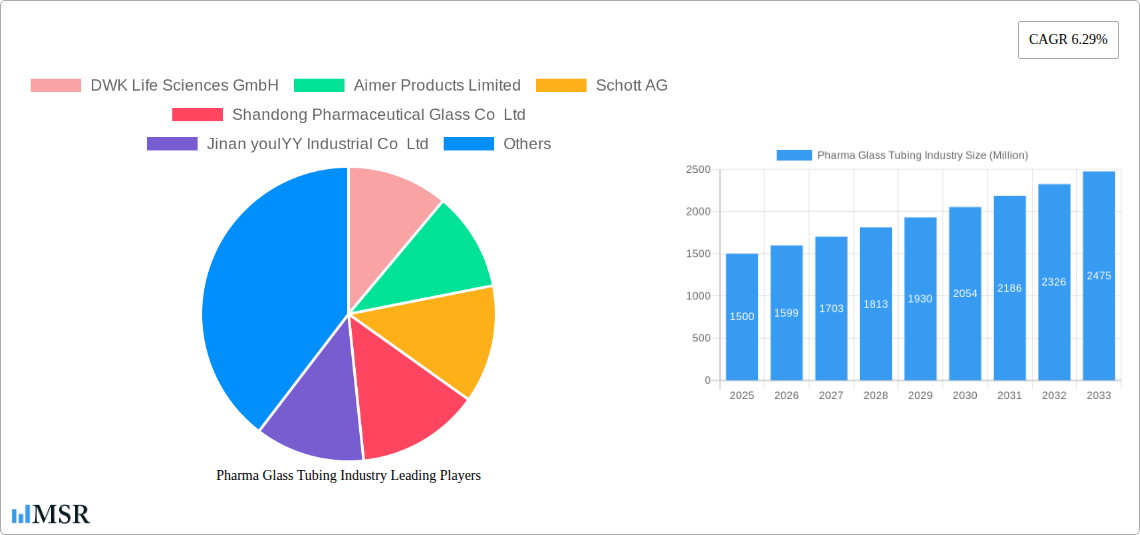
Pharma Glass Tubing Industry Company Market Share
Pharma Glass Tubing Industry: A Comprehensive Market Report (2019-2033)
This comprehensive report provides a detailed analysis of the global Pharma Glass Tubing industry, offering invaluable insights for stakeholders, investors, and industry professionals. The study period covers 2019-2033, with 2025 as the base and estimated year. The report meticulously examines market dynamics, key players, emerging trends, and future growth potential, providing actionable intelligence for strategic decision-making. With a focus on key segments like vials, ampoules, cartridges, and syringes, this report offers a 360-degree view of this vital sector. The global market size is projected to reach xx Million by 2033, exhibiting a CAGR of xx% during the forecast period (2025-2033).
Pharma Glass Tubing Industry Market Concentration & Dynamics
The global pharma glass tubing market exhibits a moderately concentrated structure, with several major players holding significant market share. DWK Life Sciences GmbH, Schott AG, and Corning Incorporated are among the leading companies, collectively accounting for approximately xx% of the market in 2025. However, the presence of numerous smaller regional players contributes to a dynamic competitive landscape.
- Market Concentration: The Herfindahl-Hirschman Index (HHI) is estimated at xx in 2025, indicating a moderately concentrated market.
- Innovation Ecosystems: Significant investments in R&D are driving innovation in materials science, leading to the development of high-performance glass tubing with enhanced properties like durability, chemical resistance, and clarity.
- Regulatory Frameworks: Stringent regulatory requirements concerning drug safety and product quality drive the need for high-quality, compliant glass tubing, influencing market growth and shaping industry practices. Compliance costs represent a significant portion of overall manufacturing expense, estimated at xx Million in 2025.
- Substitute Products: While plastic alternatives exist, glass tubing remains preferred for many pharmaceutical applications due to its inertness, barrier properties, and suitability for sterilization. However, the growth of sustainable alternatives is a growing factor to consider.
- End-User Trends: The increasing demand for injectable drugs and the growth of the pharmaceutical industry are key drivers of market growth. Specifically, the demand for pre-filled syringes is experiencing robust growth, contributing to xx Million in market value in 2025.
- M&A Activities: The industry has witnessed xx M&A deals in the past five years, indicating strategic consolidation and expansion efforts among key players.
Pharma Glass Tubing Industry Industry Insights & Trends
The global pharma glass tubing market is experiencing significant growth driven by several factors. The burgeoning pharmaceutical industry, particularly in emerging economies, is a primary driver. Technological advancements in glass manufacturing processes, enabling the creation of more precise and durable tubing, further fuel market expansion. The growing preference for injectable drugs and the increasing demand for convenience in drug administration also contribute significantly to market growth. Rising healthcare expenditure globally and government initiatives promoting healthcare infrastructure development in developing countries add additional momentum. The market size reached xx Million in 2024 and is projected to reach xx Million by 2033, growing at a CAGR of xx%. The increased focus on sustainable and environmentally friendly packaging is also shaping industry developments.
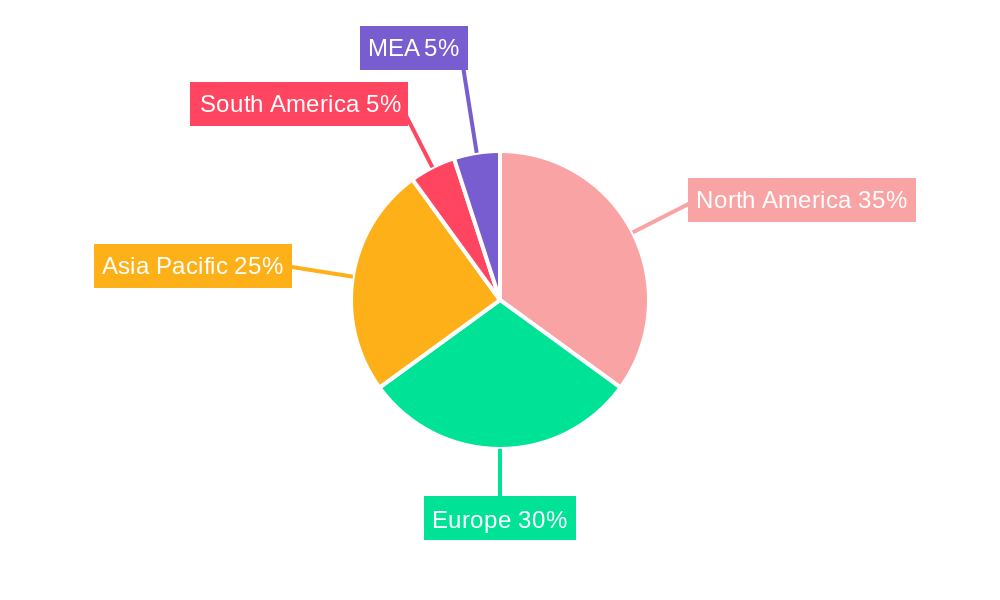
Key Markets & Segments Leading Pharma Glass Tubing Industry
North America currently holds the largest market share in the global pharma glass tubing industry, driven by robust pharmaceutical research and development activities, a large aging population requiring more pharmaceuticals, and high disposable incomes. Europe follows as a significant market, while Asia-Pacific shows the fastest growth rate. Among applications, vials account for the largest market segment, driven by their widespread use in pharmaceutical packaging.
- North America Dominance Drivers:
- Strong pharmaceutical industry presence and high R&D spending.
- Large aging population increasing demand for pharmaceuticals.
- High disposable incomes and robust healthcare infrastructure.
- Asia-Pacific Growth Drivers:
- Rapid economic growth and rising healthcare expenditure.
- Expanding pharmaceutical manufacturing base.
- Growing middle class with increasing healthcare awareness.
- Vials Segment Dominance:
- Widespread use in pharmaceutical packaging.
- Versatility and adaptability for various drug formulations.
- Established infrastructure and supply chains supporting vial production.
Pharma Glass Tubing Industry Product Developments
Recent innovations in pharma glass tubing include the development of specialized glass formulations with enhanced chemical resistance and improved durability. This includes the integration of coatings to enhance the barrier properties and prevent drug-glass interactions. The industry is also focused on developing sustainable and recyclable glass tubing options to address environmental concerns. These developments provide manufacturers with competitive advantages and contribute to improved drug safety and efficacy.
Challenges in the Pharma Glass Tubing Industry Market
The industry faces several challenges, including stringent regulatory requirements and associated compliance costs which is estimated to have caused a xx Million loss in 2024. Supply chain disruptions can impact production and delivery schedules, and intense competition among manufacturers creates price pressure. The increasing adoption of sustainable alternatives creates additional challenges to traditional players.
Forces Driving Pharma Glass Tubing Industry Growth
Several factors drive the growth of this industry, including technological advancements in glass manufacturing, rising healthcare expenditure globally, and a growing demand for injectable drugs and pre-filled syringes, contributing to estimated growth of xx Million by 2028. Furthermore, regulatory support for pharmaceutical innovation and expansion creates a supportive environment.
Long-Term Growth Catalysts in the Pharma Glass Tubing Industry
Long-term growth will be fueled by continued innovation in glass formulations, strategic partnerships and collaborations among manufacturers and pharmaceutical companies, and expansion into emerging markets.
Emerging Opportunities in Pharma Glass Tubing Industry
Emerging opportunities include the development of specialized glass tubing for novel drug delivery systems, the growing demand for sustainable and eco-friendly packaging solutions, and the expansion into new therapeutic areas such as biologics and personalized medicine.
Leading Players in the Pharma Glass Tubing Industry Sector
- DWK Life Sciences GmbH
- Aimer Products Limited
- Schott AG
- Shandong Pharmaceutical Glass Co Ltd
- Jinan youlYY Industrial Co Ltd
- Puyang New Harmony Industrial Development Co Ltd
- Cangzhou Four-star Glass Co Ltd
- Jinan Snail International Co Ltd
- Nippon Electric Glass Co Ltd
- LINUO Group
- Nipro Pharma Corporation
- Accu-Glass LLC
- Corning Incorporated
Key Milestones in Pharma Glass Tubing Industry Industry
- 2020: Increased investment in automation and digitalization by key players, resulting in improved efficiency and production capacity.
- 2022: Launch of new glass formulations with enhanced chemical resistance by Schott AG.
- 2023: Several significant M&A deals consolidating the market and expanding the reach of major players.
- 2024: The impact of supply chain disruptions on production and delivery schedules.
Strategic Outlook for Pharma Glass Tubing Industry Market
The pharma glass tubing industry is poised for continued growth, driven by factors such as technological innovation, increasing demand from the pharmaceutical sector, and expansion into new markets. Strategic partnerships, investments in R&D, and a focus on sustainable practices will be critical for companies seeking to capitalize on future market opportunities. The focus on reducing the environmental footprint of manufacturing processes and packaging will also be important for long-term success.
Pharma Glass Tubing Industry Segmentation
-
1. Application
- 1.1. Vials
- 1.2. Ampoules
- 1.3. Cartridges
- 1.4. Syringes
Pharma Glass Tubing Industry Segmentation By Geography
-
1. North America
- 1.1. United States
- 1.2. Canada
-
2. Europe
- 2.1. Germany
- 2.2. United Kingdom
- 2.3. France
- 2.4. Rest of Europe
-
3. Asia Pacific
- 3.1. China
- 3.2. India
- 3.3. Japan
- 3.4. Rest of Asia Pacific
- 4. Latin America
- 5. Middle East and Africa
Pharma Glass Tubing Industry Regional Market Share
Geographic Coverage of Pharma Glass Tubing Industry
Pharma Glass Tubing Industry REPORT HIGHLIGHTS
| Aspects | Details |
|---|---|
| Study Period | 2020-2034 |
| Base Year | 2025 |
| Estimated Year | 2026 |
| Forecast Period | 2026-2034 |
| Historical Period | 2020-2025 |
| Growth Rate | CAGR of 7.3% from 2020-2034 |
| Segmentation |
|
Table of Contents
- 1. Introduction
- 1.1. Research Scope
- 1.2. Market Segmentation
- 1.3. Research Objective
- 1.4. Definitions and Assumptions
- 2. Executive Summary
- 2.1. Market Snapshot
- 3. Market Dynamics
- 3.1. Market Drivers
- 3.2. Market Restrains
- 3.3. Market Trends
- 3.4. Market Opportunities
- 4. Market Factor Analysis
- 4.1. Porters Five Forces
- 4.1.1. Bargaining Power of Suppliers
- 4.1.2. Bargaining Power of Buyers
- 4.1.3. Threat of New Entrants
- 4.1.4. Threat of Substitutes
- 4.1.5. Competitive Rivalry
- 4.2. PESTEL analysis
- 4.3. BCG Analysis
- 4.3.1. Stars (High Growth, High Market Share)
- 4.3.2. Cash Cows (Low Growth, High Market Share)
- 4.3.3. Question Mark (High Growth, Low Market Share)
- 4.3.4. Dogs (Low Growth, Low Market Share)
- 4.4. Ansoff Matrix Analysis
- 4.5. Supply Chain Analysis
- 4.6. Regulatory Landscape
- 4.7. Current Market Potential and Opportunity Assessment (TAM–SAM–SOM Framework)
- 4.8. MSR Analyst Note
- 4.1. Porters Five Forces
- 5. Market Analysis, Insights and Forecast 2021-2033
- 5.1. Market Analysis, Insights and Forecast - by Application
- 5.1.1. Vials
- 5.1.2. Ampoules
- 5.1.3. Cartridges
- 5.1.4. Syringes
- 5.2. Market Analysis, Insights and Forecast - by Region
- 5.2.1. North America
- 5.2.2. Europe
- 5.2.3. Asia Pacific
- 5.2.4. Latin America
- 5.2.5. Middle East and Africa
- 5.1. Market Analysis, Insights and Forecast - by Application
- 6. Global Pharma Glass Tubing Industry Analysis, Insights and Forecast, 2021-2033
- 6.1. Market Analysis, Insights and Forecast - by Application
- 6.1.1. Vials
- 6.1.2. Ampoules
- 6.1.3. Cartridges
- 6.1.4. Syringes
- 6.1. Market Analysis, Insights and Forecast - by Application
- 7. North America Pharma Glass Tubing Industry Analysis, Insights and Forecast, 2020-2032
- 7.1. Market Analysis, Insights and Forecast - by Application
- 7.1.1. Vials
- 7.1.2. Ampoules
- 7.1.3. Cartridges
- 7.1.4. Syringes
- 7.1. Market Analysis, Insights and Forecast - by Application
- 8. Europe Pharma Glass Tubing Industry Analysis, Insights and Forecast, 2020-2032
- 8.1. Market Analysis, Insights and Forecast - by Application
- 8.1.1. Vials
- 8.1.2. Ampoules
- 8.1.3. Cartridges
- 8.1.4. Syringes
- 8.1. Market Analysis, Insights and Forecast - by Application
- 9. Asia Pacific Pharma Glass Tubing Industry Analysis, Insights and Forecast, 2020-2032
- 9.1. Market Analysis, Insights and Forecast - by Application
- 9.1.1. Vials
- 9.1.2. Ampoules
- 9.1.3. Cartridges
- 9.1.4. Syringes
- 9.1. Market Analysis, Insights and Forecast - by Application
- 10. Latin America Pharma Glass Tubing Industry Analysis, Insights and Forecast, 2020-2032
- 10.1. Market Analysis, Insights and Forecast - by Application
- 10.1.1. Vials
- 10.1.2. Ampoules
- 10.1.3. Cartridges
- 10.1.4. Syringes
- 10.1. Market Analysis, Insights and Forecast - by Application
- 11. Middle East and Africa Pharma Glass Tubing Industry Analysis, Insights and Forecast, 2020-2032
- 11.1. Market Analysis, Insights and Forecast - by Application
- 11.1.1. Vials
- 11.1.2. Ampoules
- 11.1.3. Cartridges
- 11.1.4. Syringes
- 11.1. Market Analysis, Insights and Forecast - by Application
- 12. Competitive Analysis
- 12.1. Company Profiles
- 12.1.1 DWK Life Sciences GmbH
- 12.1.1.1. Company Overview
- 12.1.1.2. Products
- 12.1.1.3. Company Financials
- 12.1.1.4. SWOT Analysis
- 12.1.2 Aimer Products Limited
- 12.1.2.1. Company Overview
- 12.1.2.2. Products
- 12.1.2.3. Company Financials
- 12.1.2.4. SWOT Analysis
- 12.1.3 Schott AG
- 12.1.3.1. Company Overview
- 12.1.3.2. Products
- 12.1.3.3. Company Financials
- 12.1.3.4. SWOT Analysis
- 12.1.4 Shandong Pharmaceutical Glass Co Ltd
- 12.1.4.1. Company Overview
- 12.1.4.2. Products
- 12.1.4.3. Company Financials
- 12.1.4.4. SWOT Analysis
- 12.1.5 Jinan youlYY Industrial Co Ltd
- 12.1.5.1. Company Overview
- 12.1.5.2. Products
- 12.1.5.3. Company Financials
- 12.1.5.4. SWOT Analysis
- 12.1.6 Puyang New Harmony Industrial Development Co Ltd
- 12.1.6.1. Company Overview
- 12.1.6.2. Products
- 12.1.6.3. Company Financials
- 12.1.6.4. SWOT Analysis
- 12.1.7 Cangzhou Four-star Glass Co Ltd
- 12.1.7.1. Company Overview
- 12.1.7.2. Products
- 12.1.7.3. Company Financials
- 12.1.7.4. SWOT Analysis
- 12.1.8 Jinan Snail International Co Ltd*List Not Exhaustive
- 12.1.8.1. Company Overview
- 12.1.8.2. Products
- 12.1.8.3. Company Financials
- 12.1.8.4. SWOT Analysis
- 12.1.9 Nippon Electric Glass Co Ltd
- 12.1.9.1. Company Overview
- 12.1.9.2. Products
- 12.1.9.3. Company Financials
- 12.1.9.4. SWOT Analysis
- 12.1.10 LINUO Group
- 12.1.10.1. Company Overview
- 12.1.10.2. Products
- 12.1.10.3. Company Financials
- 12.1.10.4. SWOT Analysis
- 12.1.11 Nipro Pharma Corporation
- 12.1.11.1. Company Overview
- 12.1.11.2. Products
- 12.1.11.3. Company Financials
- 12.1.11.4. SWOT Analysis
- 12.1.12 Accu-Glass LLC
- 12.1.12.1. Company Overview
- 12.1.12.2. Products
- 12.1.12.3. Company Financials
- 12.1.12.4. SWOT Analysis
- 12.1.13 Corning Incorporated
- 12.1.13.1. Company Overview
- 12.1.13.2. Products
- 12.1.13.3. Company Financials
- 12.1.13.4. SWOT Analysis
- 12.1.1 DWK Life Sciences GmbH
- 12.2. Market Entropy
- 12.2.1 Company's Key Areas Served
- 12.2.2 Recent Developments
- 12.3. Company Market Share Analysis 2025
- 12.3.1 Top 5 Companies Market Share Analysis
- 12.3.2 Top 3 Companies Market Share Analysis
- 12.4. List of Potential Customers
- 13. Research Methodology
List of Figures
- Figure 1: Global Pharma Glass Tubing Industry Revenue Breakdown (billion, %) by Region 2025 & 2033
- Figure 2: North America Pharma Glass Tubing Industry Revenue (billion), by Application 2025 & 2033
- Figure 3: North America Pharma Glass Tubing Industry Revenue Share (%), by Application 2025 & 2033
- Figure 4: North America Pharma Glass Tubing Industry Revenue (billion), by Country 2025 & 2033
- Figure 5: North America Pharma Glass Tubing Industry Revenue Share (%), by Country 2025 & 2033
- Figure 6: Europe Pharma Glass Tubing Industry Revenue (billion), by Application 2025 & 2033
- Figure 7: Europe Pharma Glass Tubing Industry Revenue Share (%), by Application 2025 & 2033
- Figure 8: Europe Pharma Glass Tubing Industry Revenue (billion), by Country 2025 & 2033
- Figure 9: Europe Pharma Glass Tubing Industry Revenue Share (%), by Country 2025 & 2033
- Figure 10: Asia Pacific Pharma Glass Tubing Industry Revenue (billion), by Application 2025 & 2033
- Figure 11: Asia Pacific Pharma Glass Tubing Industry Revenue Share (%), by Application 2025 & 2033
- Figure 12: Asia Pacific Pharma Glass Tubing Industry Revenue (billion), by Country 2025 & 2033
- Figure 13: Asia Pacific Pharma Glass Tubing Industry Revenue Share (%), by Country 2025 & 2033
- Figure 14: Latin America Pharma Glass Tubing Industry Revenue (billion), by Application 2025 & 2033
- Figure 15: Latin America Pharma Glass Tubing Industry Revenue Share (%), by Application 2025 & 2033
- Figure 16: Latin America Pharma Glass Tubing Industry Revenue (billion), by Country 2025 & 2033
- Figure 17: Latin America Pharma Glass Tubing Industry Revenue Share (%), by Country 2025 & 2033
- Figure 18: Middle East and Africa Pharma Glass Tubing Industry Revenue (billion), by Application 2025 & 2033
- Figure 19: Middle East and Africa Pharma Glass Tubing Industry Revenue Share (%), by Application 2025 & 2033
- Figure 20: Middle East and Africa Pharma Glass Tubing Industry Revenue (billion), by Country 2025 & 2033
- Figure 21: Middle East and Africa Pharma Glass Tubing Industry Revenue Share (%), by Country 2025 & 2033
List of Tables
- Table 1: Global Pharma Glass Tubing Industry Revenue billion Forecast, by Application 2020 & 2033
- Table 2: Global Pharma Glass Tubing Industry Revenue billion Forecast, by Region 2020 & 2033
- Table 3: Global Pharma Glass Tubing Industry Revenue billion Forecast, by Application 2020 & 2033
- Table 4: Global Pharma Glass Tubing Industry Revenue billion Forecast, by Country 2020 & 2033
- Table 5: United States Pharma Glass Tubing Industry Revenue (billion) Forecast, by Application 2020 & 2033
- Table 6: Canada Pharma Glass Tubing Industry Revenue (billion) Forecast, by Application 2020 & 2033
- Table 7: Global Pharma Glass Tubing Industry Revenue billion Forecast, by Application 2020 & 2033
- Table 8: Global Pharma Glass Tubing Industry Revenue billion Forecast, by Country 2020 & 2033
- Table 9: Germany Pharma Glass Tubing Industry Revenue (billion) Forecast, by Application 2020 & 2033
- Table 10: United Kingdom Pharma Glass Tubing Industry Revenue (billion) Forecast, by Application 2020 & 2033
- Table 11: France Pharma Glass Tubing Industry Revenue (billion) Forecast, by Application 2020 & 2033
- Table 12: Rest of Europe Pharma Glass Tubing Industry Revenue (billion) Forecast, by Application 2020 & 2033
- Table 13: Global Pharma Glass Tubing Industry Revenue billion Forecast, by Application 2020 & 2033
- Table 14: Global Pharma Glass Tubing Industry Revenue billion Forecast, by Country 2020 & 2033
- Table 15: China Pharma Glass Tubing Industry Revenue (billion) Forecast, by Application 2020 & 2033
- Table 16: India Pharma Glass Tubing Industry Revenue (billion) Forecast, by Application 2020 & 2033
- Table 17: Japan Pharma Glass Tubing Industry Revenue (billion) Forecast, by Application 2020 & 2033
- Table 18: Rest of Asia Pacific Pharma Glass Tubing Industry Revenue (billion) Forecast, by Application 2020 & 2033
- Table 19: Global Pharma Glass Tubing Industry Revenue billion Forecast, by Application 2020 & 2033
- Table 20: Global Pharma Glass Tubing Industry Revenue billion Forecast, by Country 2020 & 2033
- Table 21: Global Pharma Glass Tubing Industry Revenue billion Forecast, by Application 2020 & 2033
- Table 22: Global Pharma Glass Tubing Industry Revenue billion Forecast, by Country 2020 & 2033
Frequently Asked Questions
1. What is the projected Compound Annual Growth Rate (CAGR) of the Pharma Glass Tubing Industry?
The projected CAGR is approximately 7.3%.
2. Which companies are prominent players in the Pharma Glass Tubing Industry?
Key companies in the market include DWK Life Sciences GmbH, Aimer Products Limited, Schott AG, Shandong Pharmaceutical Glass Co Ltd, Jinan youlYY Industrial Co Ltd, Puyang New Harmony Industrial Development Co Ltd, Cangzhou Four-star Glass Co Ltd, Jinan Snail International Co Ltd*List Not Exhaustive, Nippon Electric Glass Co Ltd, LINUO Group, Nipro Pharma Corporation, Accu-Glass LLC, Corning Incorporated.
3. What are the main segments of the Pharma Glass Tubing Industry?
The market segments include Application.
4. Can you provide details about the market size?
The market size is estimated to be USD 9.56 billion as of 2022.
5. What are some drivers contributing to market growth?
; Growth of the Pharmaceutical Industry in Emerging Economies; Commodity Value of Glass Increased with Recyclability.
6. What are the notable trends driving market growth?
Vials is Expected to Witness Significant Growth in Pharmaceutical sector.
7. Are there any restraints impacting market growth?
; Increased Relevance of Alternate Sources.
8. Can you provide examples of recent developments in the market?
N/A
9. What pricing options are available for accessing the report?
Pricing options include single-user, multi-user, and enterprise licenses priced at USD 4750, USD 5250, and USD 8750 respectively.
10. Is the market size provided in terms of value or volume?
The market size is provided in terms of value, measured in billion.
11. Are there any specific market keywords associated with the report?
Yes, the market keyword associated with the report is "Pharma Glass Tubing Industry," which aids in identifying and referencing the specific market segment covered.
12. How do I determine which pricing option suits my needs best?
The pricing options vary based on user requirements and access needs. Individual users may opt for single-user licenses, while businesses requiring broader access may choose multi-user or enterprise licenses for cost-effective access to the report.
13. Are there any additional resources or data provided in the Pharma Glass Tubing Industry report?
While the report offers comprehensive insights, it's advisable to review the specific contents or supplementary materials provided to ascertain if additional resources or data are available.
14. How can I stay updated on further developments or reports in the Pharma Glass Tubing Industry?
To stay informed about further developments, trends, and reports in the Pharma Glass Tubing Industry, consider subscribing to industry newsletters, following relevant companies and organizations, or regularly checking reputable industry news sources and publications.
Methodology
Step 1 - Identification of Relevant Samples Size from Population Database


Step 2 - Approaches for Defining Global Market Size (Value, Volume* & Price*)

Note*: In applicable scenarios
Step 3 - Data Sources
Primary Research
- Web Analytics
- Survey Reports
- Research Institute
- Latest Research Reports
- Opinion Leaders
Secondary Research
- Annual Reports
- White Paper
- Latest Press Release
- Industry Association
- Paid Database
- Investor Presentations

Step 4 - Data Triangulation
Involves using different sources of information in order to increase the validity of a study
These sources are likely to be stakeholders in a program - participants, other researchers, program staff, other community members, and so on.
Then we put all data in single framework & apply various statistical tools to find out the dynamic on the market.
During the analysis stage, feedback from the stakeholder groups would be compared to determine areas of agreement as well as areas of divergence