

Key Insights
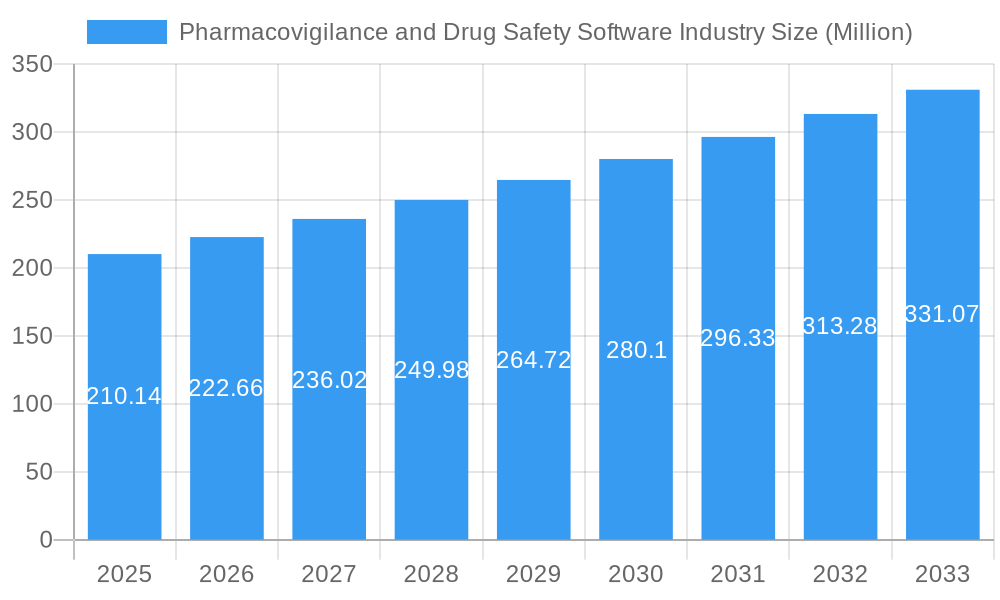
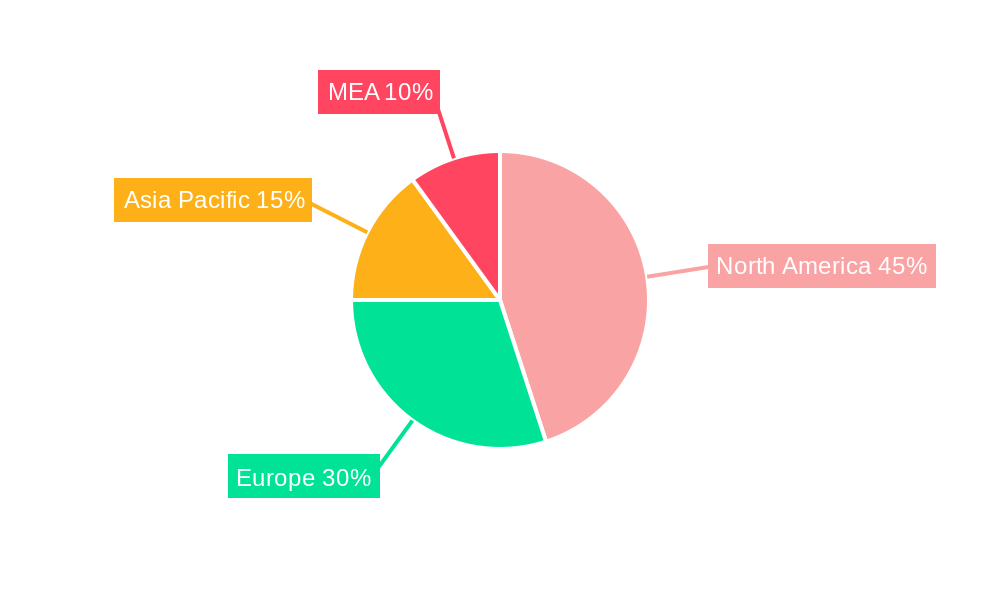
The global pharmacovigilance and drug safety software market is experiencing robust growth, projected to reach $210.14 million in 2025 and maintain a Compound Annual Growth Rate (CAGR) of 5.73% from 2025 to 2033. This expansion is fueled by several key factors. Increasing regulatory scrutiny necessitates comprehensive drug safety monitoring, driving demand for sophisticated software solutions. The growing adoption of cloud-based (SaaS) delivery models offers scalability and cost-effectiveness, further accelerating market penetration. Furthermore, the rising prevalence of chronic diseases and the consequent increase in drug consumption are contributing to the market's growth trajectory. Pharmaceutical and biotechnology companies are at the forefront of adopting these technologies, followed by contract research organizations (CROs) and business process outsourcing (BPO) firms. The market's segmentation, encompassing diverse functionalities like adverse event reporting, drug safety audits, and issue tracking software, caters to a wide spectrum of user needs and preferences. The integration of these functionalities into comprehensive platforms further enhances efficiency and compliance. North America currently dominates the market, driven by advanced technological infrastructure and stringent regulatory frameworks, but the Asia-Pacific region is projected to witness significant growth in the coming years due to increasing healthcare spending and rising awareness of drug safety.
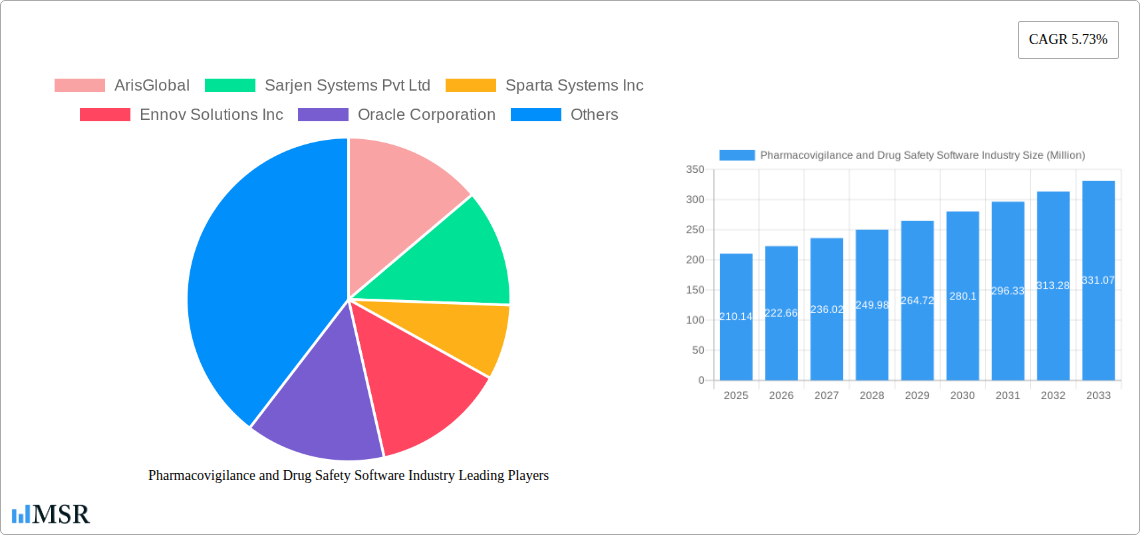
Pharmacovigilance and Drug Safety Software Industry Market Size (In Million)
The competitive landscape is characterized by a mix of established players and emerging innovative companies. Key players like ArisGlobal, Veeva Systems, and Oracle Corporation are leveraging their existing market presence and technological capabilities to expand their offerings. Meanwhile, smaller, specialized firms are focusing on niche functionalities and innovative solutions to carve out market share. Ongoing technological advancements, particularly in areas such as artificial intelligence and machine learning, will continue to shape the market's evolution. These technologies are expected to enhance data analysis capabilities, improve predictive modeling for adverse events, and streamline the overall drug safety process. Future growth will also depend on the continued adoption of cloud-based solutions and the expansion of the market into emerging economies. The development of user-friendly interfaces and robust integration capabilities will be crucial for maximizing market penetration and user satisfaction.
Pharmacovigilance and Drug Safety Software Industry Company Market Share
Pharmacovigilance and Drug Safety Software Market Report: 2019-2033
This comprehensive report provides a detailed analysis of the Pharmacovigilance and Drug Safety Software market, encompassing market size, growth drivers, key players, and future trends. The study period covers 2019-2033, with 2025 as the base and estimated year, and a forecast period of 2025-2033. The report offers actionable insights for stakeholders across pharmaceutical and biotechnology companies, CROs, and other industry players. The market is projected to reach xx Million by 2033, exhibiting a CAGR of xx% during the forecast period.
Pharmacovigilance and Drug Safety Software Industry Market Concentration & Dynamics
The Pharmacovigilance and Drug Safety Software market exhibits a moderately concentrated landscape, with several major players holding significant market share. The top 10 companies – ArisGlobal, Sarjen Systems Pvt Ltd, Sparta Systems Inc, Ennov Solutions Inc, Oracle Corporation, Anju Software Inc, Veeva Systems, Ab Cube, United BioSource Corporation, and Extedo GmbH – collectively account for approximately xx% of the global market in 2025. Market share is largely determined by technological capabilities, product breadth, global reach, and customer service.
Innovation is a key driver, with companies continuously developing advanced features such as AI-powered adverse event detection and cloud-based solutions. Stringent regulatory frameworks, including those from the FDA and EMA, significantly influence market dynamics, driving demand for compliant software. Substitute products, such as legacy systems and manual processes, pose a limited threat given the efficiency and scalability offered by specialized software.
End-user trends show a growing preference for cloud-based solutions due to their cost-effectiveness and accessibility. Mergers and acquisitions (M&A) activity has been moderate, with xx M&A deals recorded between 2019 and 2024, primarily focused on expanding product portfolios and market reach. Future M&A activity is expected to increase as companies seek to consolidate their positions in this growing market.
Pharmacovigilance and Drug Safety Software Industry Industry Insights & Trends
The global Pharmacovigilance and Drug Safety Software market is experiencing robust growth, driven by several key factors. The increasing volume of clinical trial data, stricter regulatory requirements for drug safety monitoring, and the rising adoption of cloud-based solutions are major catalysts. Technological advancements, such as the integration of artificial intelligence (AI) and machine learning (ML) into pharmacovigilance software, are enhancing efficiency and accuracy in adverse event detection and risk assessment. Furthermore, the increasing prevalence of chronic diseases globally is driving demand for sophisticated drug safety monitoring systems.
The market is witnessing significant technological disruptions, with the adoption of AI and ML leading to the development of more intelligent and automated systems. Cloud-based solutions are becoming increasingly prevalent, offering flexibility, scalability, and reduced infrastructure costs. Consumer behavior is shifting towards a preference for user-friendly, integrated platforms that streamline workflows and improve collaboration among stakeholders. This trend is leading to the development of integrated solutions addressing multiple pharmacovigilance needs. The market size is estimated at xx Million in 2025, projected to reach xx Million by 2033.
Key Markets & Segments Leading Pharmacovigilance and Drug Safety Software Industry
Dominant Region/Country: North America currently holds the largest market share, driven by robust pharmaceutical R&D spending, stringent regulatory frameworks, and early adoption of advanced technologies. Europe is another significant market, characterized by strong regulatory oversight and a high concentration of pharmaceutical companies.
Dominant Segments:
- Functionality: Fully Integrated Software is experiencing rapid growth due to its ability to streamline workflows and improve data management across various pharmacovigilance functions. Adverse Event Reporting Software remains a significant segment, with ongoing demand from pharmaceutical companies and CROs.
- Mode of Delivery: On-demand/Cloud-based (SaaS) Delivery is experiencing the most significant growth, driven by its cost-effectiveness, accessibility, and scalability.
- End Users: Pharmaceutical and Biotechnology Companies constitute the largest end-user segment, followed by Contract Research Organizations (CROs).
Drivers:
- Strong economic growth in key markets fuels investment in advanced drug safety systems.
- Stringent regulatory requirements mandate the use of compliant software.
- Technological advancements such as AI and ML enable more efficient and accurate risk assessment.
- Growing prevalence of chronic diseases increases the need for effective pharmacovigilance.
Pharmacovigilance and Drug Safety Software Industry Product Developments
Recent product innovations include the integration of AI/ML for enhanced signal detection and risk assessment, improved data visualization and reporting capabilities, and enhanced interoperability with other systems. These advancements are enhancing efficiency, accuracy, and regulatory compliance in pharmacovigilance practices. Companies are focusing on delivering fully integrated solutions that address diverse needs within a single platform, offering a competitive edge in the market.
Challenges in the Pharmacovigilance and Drug Safety Software Industry Market
The market faces challenges like high implementation costs for sophisticated software, the need for continuous updates to meet evolving regulatory requirements, and integrating legacy systems with new technologies. Data security and privacy concerns also pose a significant challenge, necessitating robust security measures. Intense competition among established players and emerging startups can put downward pressure on pricing and margins. Regulatory hurdles for new software approvals and compliance requirements add to operational complexity. These challenges can lead to xx Million in annual losses across the industry.
Forces Driving Pharmacovigilance and Drug Safety Software Industry Growth
Key growth drivers include the increasing complexity of drug development, stringent regulatory requirements, rising adoption of cloud-based solutions, and growing awareness of the importance of proactive drug safety monitoring. Technological advancements, such as AI and ML, significantly improve efficiency and reduce costs, boosting adoption rates. Favorable economic conditions in key markets provide funding for technology upgrades and expansion. Government initiatives supporting innovation and pharmacovigilance further strengthen market growth.
Long-Term Growth Catalysts in the Pharmacovigilance and Drug Safety Software Industry
Long-term growth will be fueled by the continuous development of AI-powered solutions, partnerships between software vendors and pharmaceutical companies, and expansion into emerging markets. The integration of real-world data (RWD) into pharmacovigilance systems will also drive growth. Focus on improving user experience and system interoperability will enhance adoption and improve market penetration. Expansion into new therapeutic areas and geographical regions will unlock further market opportunities.
Emerging Opportunities in Pharmacovigilance and Drug Safety Software Industry
Emerging opportunities include the integration of wearable sensors for real-time patient monitoring, the application of blockchain technology for secure data management, and the development of predictive models for adverse event identification. Expansion into emerging markets in Asia and Latin America presents significant growth potential. Focus on personalized medicine and targeted therapies will drive the demand for specialized pharmacovigilance solutions. Growing emphasis on data analytics and business intelligence will lead to new opportunities for data-driven decision-making in drug safety.
Leading Players in the Pharmacovigilance and Drug Safety Software Industry Sector
- ArisGlobal
- Sarjen Systems Pvt Ltd
- Sparta Systems Inc
- Ennov Solutions Inc
- Oracle Corporation
- Anju Software Inc
- Veeva Systems
- Ab Cube
- United BioSource Corporation
- Extedo GmbH
Key Milestones in Pharmacovigilance and Drug Safety Software Industry Industry
- October 2022: PegBio selects ArisGlobal's LifeSphere MultiVigilance, signifying a shift towards in-house pharmacovigilance solutions and highlighting the software's market leadership.
- July 2022: Dotmatics launches its Small Molecule Drug Discovery Solution, expanding data management capabilities and influencing related pharmacovigilance software integration.
Strategic Outlook for Pharmacovigilance and Drug Safety Software Market
The future of the Pharmacovigilance and Drug Safety Software market is bright, driven by continuous technological advancements, increasing regulatory scrutiny, and the growing need for efficient drug safety monitoring. Companies that invest in AI/ML, cloud-based solutions, and robust data security measures are expected to gain a significant competitive advantage. Strategic partnerships and acquisitions will play a crucial role in consolidating market share and expanding product offerings. The market presents substantial opportunities for growth, particularly in emerging markets and for companies focusing on innovative solutions tailored to meet evolving industry needs.
Pharmacovigilance and Drug Safety Software Industry Segmentation
-
1. Functionality
- 1.1. Adverse Event Reporting Software
- 1.2. Drug Safety Audits Software
- 1.3. Issue Tracking Software
- 1.4. Fully Integrated Software
-
2. Mode of Delivery
- 2.1. On-premise Delivery
- 2.2. On-demand/ Cloud-based (SaaS) Delivery
-
3. End Users
- 3.1. Pharmaceutical and Biotechnology Companies
- 3.2. Contract Research Organizations
- 3.3. Business Process Outsourcing Firms
- 3.4. Other Pharmacovigilance Service Providers
Pharmacovigilance and Drug Safety Software Industry Segmentation By Geography
-
1. North America
- 1.1. United States
- 1.2. Canada
- 1.3. Mexico
-
2. Europe
- 2.1. Germany
- 2.2. United Kingdom
- 2.3. France
- 2.4. Italy
- 2.5. Spain
- 2.6. Rest of Europe
-
3. Asia Pacific
- 3.1. China
- 3.2. Japan
- 3.3. India
- 3.4. Australia
- 3.5. South Korea
- 3.6. Rest of Asia Pacific
-
4. Middle East and Africa
- 4.1. GCC
- 4.2. South Africa
- 4.3. Rest of Middle East and Africa
-
5. South America
- 5.1. Brazil
- 5.2. Argentina
- 5.3. Rest of South America
Pharmacovigilance and Drug Safety Software Industry Regional Market Share
Geographic Coverage of Pharmacovigilance and Drug Safety Software Industry
Pharmacovigilance and Drug Safety Software Industry REPORT HIGHLIGHTS
| Aspects | Details |
|---|---|
| Study Period | 2020-2034 |
| Base Year | 2025 |
| Estimated Year | 2026 |
| Forecast Period | 2026-2034 |
| Historical Period | 2020-2025 |
| Growth Rate | CAGR of 5.73% from 2020-2034 |
| Segmentation |
|
Table of Contents
- 1. Introduction
- 1.1. Research Scope
- 1.2. Market Segmentation
- 1.3. Research Methodology
- 1.4. Definitions and Assumptions
- 2. Executive Summary
- 2.1. Introduction
- 3. Market Dynamics
- 3.1. Introduction
- 3.2. Market Drivers
- 3.2.1. Increasing Incidence of Adverse Drug Reactions (ADRs); Increasing Adoption of Pharmacovigilance Software by Outsourcing Companies
- 3.3. Market Restrains
- 3.3.1. Lack of Awareness about Pharmacovigilance
- 3.4. Market Trends
- 3.4.1. Fully Integrated Software Expected to Witness Significant Growth Over the Forecast Period
- 4. Market Factor Analysis
- 4.1. Porters Five Forces
- 4.2. Supply/Value Chain
- 4.3. PESTEL analysis
- 4.4. Market Entropy
- 4.5. Patent/Trademark Analysis
- 5. Global Pharmacovigilance and Drug Safety Software Industry Analysis, Insights and Forecast, 2020-2032
- 5.1. Market Analysis, Insights and Forecast - by Functionality
- 5.1.1. Adverse Event Reporting Software
- 5.1.2. Drug Safety Audits Software
- 5.1.3. Issue Tracking Software
- 5.1.4. Fully Integrated Software
- 5.2. Market Analysis, Insights and Forecast - by Mode of Delivery
- 5.2.1. On-premise Delivery
- 5.2.2. On-demand/ Cloud-based (SaaS) Delivery
- 5.3. Market Analysis, Insights and Forecast - by End Users
- 5.3.1. Pharmaceutical and Biotechnology Companies
- 5.3.2. Contract Research Organizations
- 5.3.3. Business Process Outsourcing Firms
- 5.3.4. Other Pharmacovigilance Service Providers
- 5.4. Market Analysis, Insights and Forecast - by Region
- 5.4.1. North America
- 5.4.2. Europe
- 5.4.3. Asia Pacific
- 5.4.4. Middle East and Africa
- 5.4.5. South America
- 5.1. Market Analysis, Insights and Forecast - by Functionality
- 6. North America Pharmacovigilance and Drug Safety Software Industry Analysis, Insights and Forecast, 2020-2032
- 6.1. Market Analysis, Insights and Forecast - by Functionality
- 6.1.1. Adverse Event Reporting Software
- 6.1.2. Drug Safety Audits Software
- 6.1.3. Issue Tracking Software
- 6.1.4. Fully Integrated Software
- 6.2. Market Analysis, Insights and Forecast - by Mode of Delivery
- 6.2.1. On-premise Delivery
- 6.2.2. On-demand/ Cloud-based (SaaS) Delivery
- 6.3. Market Analysis, Insights and Forecast - by End Users
- 6.3.1. Pharmaceutical and Biotechnology Companies
- 6.3.2. Contract Research Organizations
- 6.3.3. Business Process Outsourcing Firms
- 6.3.4. Other Pharmacovigilance Service Providers
- 6.1. Market Analysis, Insights and Forecast - by Functionality
- 7. Europe Pharmacovigilance and Drug Safety Software Industry Analysis, Insights and Forecast, 2020-2032
- 7.1. Market Analysis, Insights and Forecast - by Functionality
- 7.1.1. Adverse Event Reporting Software
- 7.1.2. Drug Safety Audits Software
- 7.1.3. Issue Tracking Software
- 7.1.4. Fully Integrated Software
- 7.2. Market Analysis, Insights and Forecast - by Mode of Delivery
- 7.2.1. On-premise Delivery
- 7.2.2. On-demand/ Cloud-based (SaaS) Delivery
- 7.3. Market Analysis, Insights and Forecast - by End Users
- 7.3.1. Pharmaceutical and Biotechnology Companies
- 7.3.2. Contract Research Organizations
- 7.3.3. Business Process Outsourcing Firms
- 7.3.4. Other Pharmacovigilance Service Providers
- 7.1. Market Analysis, Insights and Forecast - by Functionality
- 8. Asia Pacific Pharmacovigilance and Drug Safety Software Industry Analysis, Insights and Forecast, 2020-2032
- 8.1. Market Analysis, Insights and Forecast - by Functionality
- 8.1.1. Adverse Event Reporting Software
- 8.1.2. Drug Safety Audits Software
- 8.1.3. Issue Tracking Software
- 8.1.4. Fully Integrated Software
- 8.2. Market Analysis, Insights and Forecast - by Mode of Delivery
- 8.2.1. On-premise Delivery
- 8.2.2. On-demand/ Cloud-based (SaaS) Delivery
- 8.3. Market Analysis, Insights and Forecast - by End Users
- 8.3.1. Pharmaceutical and Biotechnology Companies
- 8.3.2. Contract Research Organizations
- 8.3.3. Business Process Outsourcing Firms
- 8.3.4. Other Pharmacovigilance Service Providers
- 8.1. Market Analysis, Insights and Forecast - by Functionality
- 9. Middle East and Africa Pharmacovigilance and Drug Safety Software Industry Analysis, Insights and Forecast, 2020-2032
- 9.1. Market Analysis, Insights and Forecast - by Functionality
- 9.1.1. Adverse Event Reporting Software
- 9.1.2. Drug Safety Audits Software
- 9.1.3. Issue Tracking Software
- 9.1.4. Fully Integrated Software
- 9.2. Market Analysis, Insights and Forecast - by Mode of Delivery
- 9.2.1. On-premise Delivery
- 9.2.2. On-demand/ Cloud-based (SaaS) Delivery
- 9.3. Market Analysis, Insights and Forecast - by End Users
- 9.3.1. Pharmaceutical and Biotechnology Companies
- 9.3.2. Contract Research Organizations
- 9.3.3. Business Process Outsourcing Firms
- 9.3.4. Other Pharmacovigilance Service Providers
- 9.1. Market Analysis, Insights and Forecast - by Functionality
- 10. South America Pharmacovigilance and Drug Safety Software Industry Analysis, Insights and Forecast, 2020-2032
- 10.1. Market Analysis, Insights and Forecast - by Functionality
- 10.1.1. Adverse Event Reporting Software
- 10.1.2. Drug Safety Audits Software
- 10.1.3. Issue Tracking Software
- 10.1.4. Fully Integrated Software
- 10.2. Market Analysis, Insights and Forecast - by Mode of Delivery
- 10.2.1. On-premise Delivery
- 10.2.2. On-demand/ Cloud-based (SaaS) Delivery
- 10.3. Market Analysis, Insights and Forecast - by End Users
- 10.3.1. Pharmaceutical and Biotechnology Companies
- 10.3.2. Contract Research Organizations
- 10.3.3. Business Process Outsourcing Firms
- 10.3.4. Other Pharmacovigilance Service Providers
- 10.1. Market Analysis, Insights and Forecast - by Functionality
- 11. Competitive Analysis
- 11.1. Global Market Share Analysis 2025
- 11.2. Company Profiles
- 11.2.1 ArisGlobal
- 11.2.1.1. Overview
- 11.2.1.2. Products
- 11.2.1.3. SWOT Analysis
- 11.2.1.4. Recent Developments
- 11.2.1.5. Financials (Based on Availability)
- 11.2.2 Sarjen Systems Pvt Ltd
- 11.2.2.1. Overview
- 11.2.2.2. Products
- 11.2.2.3. SWOT Analysis
- 11.2.2.4. Recent Developments
- 11.2.2.5. Financials (Based on Availability)
- 11.2.3 Sparta Systems Inc
- 11.2.3.1. Overview
- 11.2.3.2. Products
- 11.2.3.3. SWOT Analysis
- 11.2.3.4. Recent Developments
- 11.2.3.5. Financials (Based on Availability)
- 11.2.4 Ennov Solutions Inc
- 11.2.4.1. Overview
- 11.2.4.2. Products
- 11.2.4.3. SWOT Analysis
- 11.2.4.4. Recent Developments
- 11.2.4.5. Financials (Based on Availability)
- 11.2.5 Oracle Corporation
- 11.2.5.1. Overview
- 11.2.5.2. Products
- 11.2.5.3. SWOT Analysis
- 11.2.5.4. Recent Developments
- 11.2.5.5. Financials (Based on Availability)
- 11.2.6 Anju Software Inc
- 11.2.6.1. Overview
- 11.2.6.2. Products
- 11.2.6.3. SWOT Analysis
- 11.2.6.4. Recent Developments
- 11.2.6.5. Financials (Based on Availability)
- 11.2.7 Veeva Systems
- 11.2.7.1. Overview
- 11.2.7.2. Products
- 11.2.7.3. SWOT Analysis
- 11.2.7.4. Recent Developments
- 11.2.7.5. Financials (Based on Availability)
- 11.2.8 Ab Cube
- 11.2.8.1. Overview
- 11.2.8.2. Products
- 11.2.8.3. SWOT Analysis
- 11.2.8.4. Recent Developments
- 11.2.8.5. Financials (Based on Availability)
- 11.2.9 United BioSource Corporation
- 11.2.9.1. Overview
- 11.2.9.2. Products
- 11.2.9.3. SWOT Analysis
- 11.2.9.4. Recent Developments
- 11.2.9.5. Financials (Based on Availability)
- 11.2.10 Extedo GmbH
- 11.2.10.1. Overview
- 11.2.10.2. Products
- 11.2.10.3. SWOT Analysis
- 11.2.10.4. Recent Developments
- 11.2.10.5. Financials (Based on Availability)
- 11.2.1 ArisGlobal
List of Figures
- Figure 1: Global Pharmacovigilance and Drug Safety Software Industry Revenue Breakdown (Million, %) by Region 2025 & 2033
- Figure 2: North America Pharmacovigilance and Drug Safety Software Industry Revenue (Million), by Functionality 2025 & 2033
- Figure 3: North America Pharmacovigilance and Drug Safety Software Industry Revenue Share (%), by Functionality 2025 & 2033
- Figure 4: North America Pharmacovigilance and Drug Safety Software Industry Revenue (Million), by Mode of Delivery 2025 & 2033
- Figure 5: North America Pharmacovigilance and Drug Safety Software Industry Revenue Share (%), by Mode of Delivery 2025 & 2033
- Figure 6: North America Pharmacovigilance and Drug Safety Software Industry Revenue (Million), by End Users 2025 & 2033
- Figure 7: North America Pharmacovigilance and Drug Safety Software Industry Revenue Share (%), by End Users 2025 & 2033
- Figure 8: North America Pharmacovigilance and Drug Safety Software Industry Revenue (Million), by Country 2025 & 2033
- Figure 9: North America Pharmacovigilance and Drug Safety Software Industry Revenue Share (%), by Country 2025 & 2033
- Figure 10: Europe Pharmacovigilance and Drug Safety Software Industry Revenue (Million), by Functionality 2025 & 2033
- Figure 11: Europe Pharmacovigilance and Drug Safety Software Industry Revenue Share (%), by Functionality 2025 & 2033
- Figure 12: Europe Pharmacovigilance and Drug Safety Software Industry Revenue (Million), by Mode of Delivery 2025 & 2033
- Figure 13: Europe Pharmacovigilance and Drug Safety Software Industry Revenue Share (%), by Mode of Delivery 2025 & 2033
- Figure 14: Europe Pharmacovigilance and Drug Safety Software Industry Revenue (Million), by End Users 2025 & 2033
- Figure 15: Europe Pharmacovigilance and Drug Safety Software Industry Revenue Share (%), by End Users 2025 & 2033
- Figure 16: Europe Pharmacovigilance and Drug Safety Software Industry Revenue (Million), by Country 2025 & 2033
- Figure 17: Europe Pharmacovigilance and Drug Safety Software Industry Revenue Share (%), by Country 2025 & 2033
- Figure 18: Asia Pacific Pharmacovigilance and Drug Safety Software Industry Revenue (Million), by Functionality 2025 & 2033
- Figure 19: Asia Pacific Pharmacovigilance and Drug Safety Software Industry Revenue Share (%), by Functionality 2025 & 2033
- Figure 20: Asia Pacific Pharmacovigilance and Drug Safety Software Industry Revenue (Million), by Mode of Delivery 2025 & 2033
- Figure 21: Asia Pacific Pharmacovigilance and Drug Safety Software Industry Revenue Share (%), by Mode of Delivery 2025 & 2033
- Figure 22: Asia Pacific Pharmacovigilance and Drug Safety Software Industry Revenue (Million), by End Users 2025 & 2033
- Figure 23: Asia Pacific Pharmacovigilance and Drug Safety Software Industry Revenue Share (%), by End Users 2025 & 2033
- Figure 24: Asia Pacific Pharmacovigilance and Drug Safety Software Industry Revenue (Million), by Country 2025 & 2033
- Figure 25: Asia Pacific Pharmacovigilance and Drug Safety Software Industry Revenue Share (%), by Country 2025 & 2033
- Figure 26: Middle East and Africa Pharmacovigilance and Drug Safety Software Industry Revenue (Million), by Functionality 2025 & 2033
- Figure 27: Middle East and Africa Pharmacovigilance and Drug Safety Software Industry Revenue Share (%), by Functionality 2025 & 2033
- Figure 28: Middle East and Africa Pharmacovigilance and Drug Safety Software Industry Revenue (Million), by Mode of Delivery 2025 & 2033
- Figure 29: Middle East and Africa Pharmacovigilance and Drug Safety Software Industry Revenue Share (%), by Mode of Delivery 2025 & 2033
- Figure 30: Middle East and Africa Pharmacovigilance and Drug Safety Software Industry Revenue (Million), by End Users 2025 & 2033
- Figure 31: Middle East and Africa Pharmacovigilance and Drug Safety Software Industry Revenue Share (%), by End Users 2025 & 2033
- Figure 32: Middle East and Africa Pharmacovigilance and Drug Safety Software Industry Revenue (Million), by Country 2025 & 2033
- Figure 33: Middle East and Africa Pharmacovigilance and Drug Safety Software Industry Revenue Share (%), by Country 2025 & 2033
- Figure 34: South America Pharmacovigilance and Drug Safety Software Industry Revenue (Million), by Functionality 2025 & 2033
- Figure 35: South America Pharmacovigilance and Drug Safety Software Industry Revenue Share (%), by Functionality 2025 & 2033
- Figure 36: South America Pharmacovigilance and Drug Safety Software Industry Revenue (Million), by Mode of Delivery 2025 & 2033
- Figure 37: South America Pharmacovigilance and Drug Safety Software Industry Revenue Share (%), by Mode of Delivery 2025 & 2033
- Figure 38: South America Pharmacovigilance and Drug Safety Software Industry Revenue (Million), by End Users 2025 & 2033
- Figure 39: South America Pharmacovigilance and Drug Safety Software Industry Revenue Share (%), by End Users 2025 & 2033
- Figure 40: South America Pharmacovigilance and Drug Safety Software Industry Revenue (Million), by Country 2025 & 2033
- Figure 41: South America Pharmacovigilance and Drug Safety Software Industry Revenue Share (%), by Country 2025 & 2033
List of Tables
- Table 1: Global Pharmacovigilance and Drug Safety Software Industry Revenue Million Forecast, by Functionality 2020 & 2033
- Table 2: Global Pharmacovigilance and Drug Safety Software Industry Revenue Million Forecast, by Mode of Delivery 2020 & 2033
- Table 3: Global Pharmacovigilance and Drug Safety Software Industry Revenue Million Forecast, by End Users 2020 & 2033
- Table 4: Global Pharmacovigilance and Drug Safety Software Industry Revenue Million Forecast, by Region 2020 & 2033
- Table 5: Global Pharmacovigilance and Drug Safety Software Industry Revenue Million Forecast, by Functionality 2020 & 2033
- Table 6: Global Pharmacovigilance and Drug Safety Software Industry Revenue Million Forecast, by Mode of Delivery 2020 & 2033
- Table 7: Global Pharmacovigilance and Drug Safety Software Industry Revenue Million Forecast, by End Users 2020 & 2033
- Table 8: Global Pharmacovigilance and Drug Safety Software Industry Revenue Million Forecast, by Country 2020 & 2033
- Table 9: United States Pharmacovigilance and Drug Safety Software Industry Revenue (Million) Forecast, by Application 2020 & 2033
- Table 10: Canada Pharmacovigilance and Drug Safety Software Industry Revenue (Million) Forecast, by Application 2020 & 2033
- Table 11: Mexico Pharmacovigilance and Drug Safety Software Industry Revenue (Million) Forecast, by Application 2020 & 2033
- Table 12: Global Pharmacovigilance and Drug Safety Software Industry Revenue Million Forecast, by Functionality 2020 & 2033
- Table 13: Global Pharmacovigilance and Drug Safety Software Industry Revenue Million Forecast, by Mode of Delivery 2020 & 2033
- Table 14: Global Pharmacovigilance and Drug Safety Software Industry Revenue Million Forecast, by End Users 2020 & 2033
- Table 15: Global Pharmacovigilance and Drug Safety Software Industry Revenue Million Forecast, by Country 2020 & 2033
- Table 16: Germany Pharmacovigilance and Drug Safety Software Industry Revenue (Million) Forecast, by Application 2020 & 2033
- Table 17: United Kingdom Pharmacovigilance and Drug Safety Software Industry Revenue (Million) Forecast, by Application 2020 & 2033
- Table 18: France Pharmacovigilance and Drug Safety Software Industry Revenue (Million) Forecast, by Application 2020 & 2033
- Table 19: Italy Pharmacovigilance and Drug Safety Software Industry Revenue (Million) Forecast, by Application 2020 & 2033
- Table 20: Spain Pharmacovigilance and Drug Safety Software Industry Revenue (Million) Forecast, by Application 2020 & 2033
- Table 21: Rest of Europe Pharmacovigilance and Drug Safety Software Industry Revenue (Million) Forecast, by Application 2020 & 2033
- Table 22: Global Pharmacovigilance and Drug Safety Software Industry Revenue Million Forecast, by Functionality 2020 & 2033
- Table 23: Global Pharmacovigilance and Drug Safety Software Industry Revenue Million Forecast, by Mode of Delivery 2020 & 2033
- Table 24: Global Pharmacovigilance and Drug Safety Software Industry Revenue Million Forecast, by End Users 2020 & 2033
- Table 25: Global Pharmacovigilance and Drug Safety Software Industry Revenue Million Forecast, by Country 2020 & 2033
- Table 26: China Pharmacovigilance and Drug Safety Software Industry Revenue (Million) Forecast, by Application 2020 & 2033
- Table 27: Japan Pharmacovigilance and Drug Safety Software Industry Revenue (Million) Forecast, by Application 2020 & 2033
- Table 28: India Pharmacovigilance and Drug Safety Software Industry Revenue (Million) Forecast, by Application 2020 & 2033
- Table 29: Australia Pharmacovigilance and Drug Safety Software Industry Revenue (Million) Forecast, by Application 2020 & 2033
- Table 30: South Korea Pharmacovigilance and Drug Safety Software Industry Revenue (Million) Forecast, by Application 2020 & 2033
- Table 31: Rest of Asia Pacific Pharmacovigilance and Drug Safety Software Industry Revenue (Million) Forecast, by Application 2020 & 2033
- Table 32: Global Pharmacovigilance and Drug Safety Software Industry Revenue Million Forecast, by Functionality 2020 & 2033
- Table 33: Global Pharmacovigilance and Drug Safety Software Industry Revenue Million Forecast, by Mode of Delivery 2020 & 2033
- Table 34: Global Pharmacovigilance and Drug Safety Software Industry Revenue Million Forecast, by End Users 2020 & 2033
- Table 35: Global Pharmacovigilance and Drug Safety Software Industry Revenue Million Forecast, by Country 2020 & 2033
- Table 36: GCC Pharmacovigilance and Drug Safety Software Industry Revenue (Million) Forecast, by Application 2020 & 2033
- Table 37: South Africa Pharmacovigilance and Drug Safety Software Industry Revenue (Million) Forecast, by Application 2020 & 2033
- Table 38: Rest of Middle East and Africa Pharmacovigilance and Drug Safety Software Industry Revenue (Million) Forecast, by Application 2020 & 2033
- Table 39: Global Pharmacovigilance and Drug Safety Software Industry Revenue Million Forecast, by Functionality 2020 & 2033
- Table 40: Global Pharmacovigilance and Drug Safety Software Industry Revenue Million Forecast, by Mode of Delivery 2020 & 2033
- Table 41: Global Pharmacovigilance and Drug Safety Software Industry Revenue Million Forecast, by End Users 2020 & 2033
- Table 42: Global Pharmacovigilance and Drug Safety Software Industry Revenue Million Forecast, by Country 2020 & 2033
- Table 43: Brazil Pharmacovigilance and Drug Safety Software Industry Revenue (Million) Forecast, by Application 2020 & 2033
- Table 44: Argentina Pharmacovigilance and Drug Safety Software Industry Revenue (Million) Forecast, by Application 2020 & 2033
- Table 45: Rest of South America Pharmacovigilance and Drug Safety Software Industry Revenue (Million) Forecast, by Application 2020 & 2033
Frequently Asked Questions
1. What is the projected Compound Annual Growth Rate (CAGR) of the Pharmacovigilance and Drug Safety Software Industry?
The projected CAGR is approximately 5.73%.
2. Which companies are prominent players in the Pharmacovigilance and Drug Safety Software Industry?
Key companies in the market include ArisGlobal, Sarjen Systems Pvt Ltd, Sparta Systems Inc, Ennov Solutions Inc, Oracle Corporation, Anju Software Inc, Veeva Systems, Ab Cube, United BioSource Corporation, Extedo GmbH.
3. What are the main segments of the Pharmacovigilance and Drug Safety Software Industry?
The market segments include Functionality, Mode of Delivery, End Users.
4. Can you provide details about the market size?
The market size is estimated to be USD 210.14 Million as of 2022.
5. What are some drivers contributing to market growth?
Increasing Incidence of Adverse Drug Reactions (ADRs); Increasing Adoption of Pharmacovigilance Software by Outsourcing Companies.
6. What are the notable trends driving market growth?
Fully Integrated Software Expected to Witness Significant Growth Over the Forecast Period.
7. Are there any restraints impacting market growth?
Lack of Awareness about Pharmacovigilance.
8. Can you provide examples of recent developments in the market?
October 2022: PegBio selected LifeSphere MultiVigilance, a flagship product by ArisGlobal, to transition their pharmacovigilance from Contract Research Organization (CRO) services to in-house practices with this leading pharmacovigilance software.
9. What pricing options are available for accessing the report?
Pricing options include single-user, multi-user, and enterprise licenses priced at USD 4750, USD 5250, and USD 8750 respectively.
10. Is the market size provided in terms of value or volume?
The market size is provided in terms of value, measured in Million.
11. Are there any specific market keywords associated with the report?
Yes, the market keyword associated with the report is "Pharmacovigilance and Drug Safety Software Industry," which aids in identifying and referencing the specific market segment covered.
12. How do I determine which pricing option suits my needs best?
The pricing options vary based on user requirements and access needs. Individual users may opt for single-user licenses, while businesses requiring broader access may choose multi-user or enterprise licenses for cost-effective access to the report.
13. Are there any additional resources or data provided in the Pharmacovigilance and Drug Safety Software Industry report?
While the report offers comprehensive insights, it's advisable to review the specific contents or supplementary materials provided to ascertain if additional resources or data are available.
14. How can I stay updated on further developments or reports in the Pharmacovigilance and Drug Safety Software Industry?
To stay informed about further developments, trends, and reports in the Pharmacovigilance and Drug Safety Software Industry, consider subscribing to industry newsletters, following relevant companies and organizations, or regularly checking reputable industry news sources and publications.
Methodology
Step 1 - Identification of Relevant Samples Size from Population Database


Step 2 - Approaches for Defining Global Market Size (Value, Volume* & Price*)

Note*: In applicable scenarios
Step 3 - Data Sources
Primary Research
- Web Analytics
- Survey Reports
- Research Institute
- Latest Research Reports
- Opinion Leaders
Secondary Research
- Annual Reports
- White Paper
- Latest Press Release
- Industry Association
- Paid Database
- Investor Presentations

Step 4 - Data Triangulation
Involves using different sources of information in order to increase the validity of a study
These sources are likely to be stakeholders in a program - participants, other researchers, program staff, other community members, and so on.
Then we put all data in single framework & apply various statistical tools to find out the dynamic on the market.
During the analysis stage, feedback from the stakeholder groups would be compared to determine areas of agreement as well as areas of divergence