

Key Insights
The Tissue Microarray (TMA) market is demonstrating significant expansion, driven by the escalating incidence of chronic diseases and the growing demand for precise diagnostic and research solutions. Projections indicate a Compound Annual Growth Rate (CAGR) of 10.36%. This growth trajectory is propelled by innovations in molecular diagnostics, personalized medicine initiatives, and the increasing need for high-throughput screening within pharmaceutical and biotechnology sectors. While immunohistochemistry (IHC) and fluorescence in situ hybridization (FISH) remain key applications, the integration of advanced techniques such as Polymerase Chain Reaction (PCR) and Next-Generation Sequencing (NGS) is enhancing market performance through improved diagnostic accuracy. North America currently leads the market, supported by robust healthcare infrastructure and early adoption of cutting-edge technologies. Conversely, the Asia-Pacific region is anticipated to experience the most rapid growth, influenced by expanding healthcare investments and a rising prevalence of target diseases. Market expansion is moderated by factors including the substantial cost of TMAs, rigorous regulatory processes, and the requirement for specialized analytical expertise.
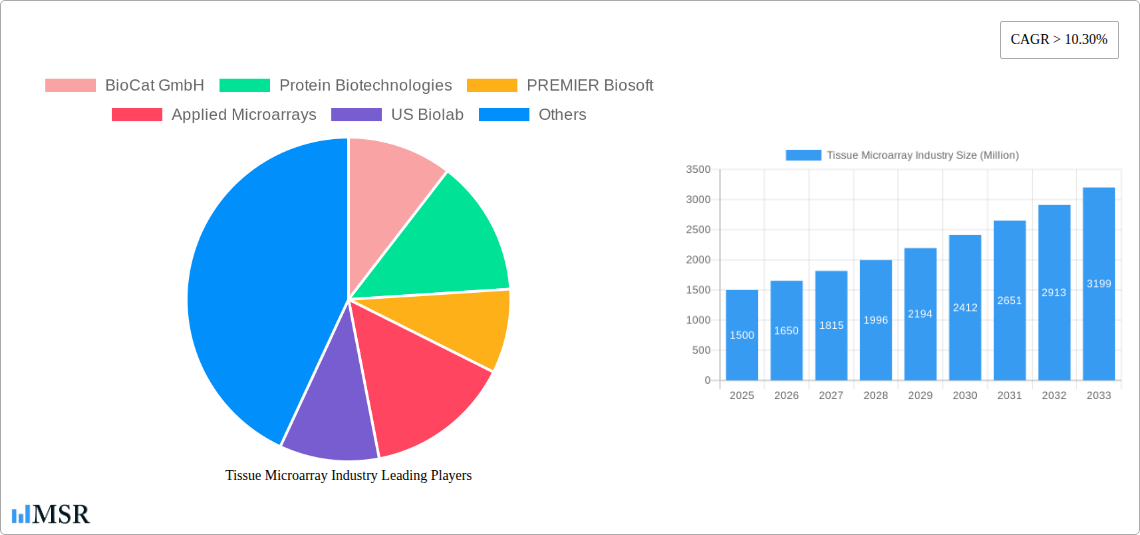
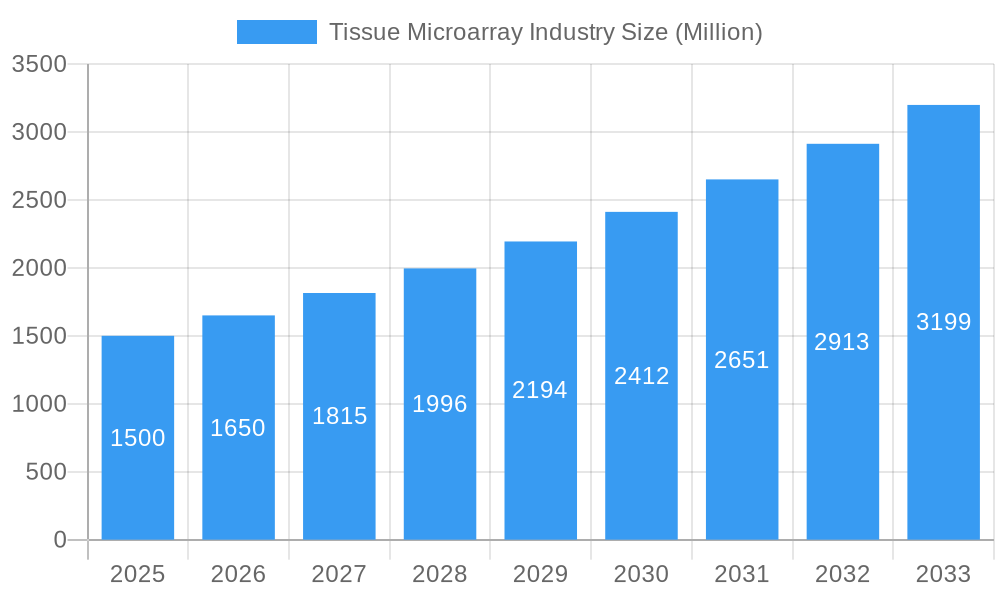
Tissue Microarray Industry Market Size (In Billion)
Despite existing hurdles, the TMA market is set for sustained expansion. The incorporation of Artificial Intelligence (AI) and Machine Learning into TMA analysis is expected to revolutionize diagnostic precision and operational efficiency, thereby accelerating market growth. The increasing utilization of TMAs in drug discovery and development, coupled with the rising demand for tailored cancer therapies, will further bolster market expansion. The market's segmentation by end-users, including pharmaceutical and biotechnology firms, and research institutions, as well as by procedures like IHC and FISH, underscores the broad applicability of TMAs across diverse research and clinical environments. Leading industry players are prioritizing innovation and strategic collaborations to leverage emerging opportunities and solidify their market standing. The outlook for the TMA market is highly positive, with substantial growth prospects fueled by technological advancements and a burgeoning need for enhanced diagnostic and research capabilities. The market is valued at $14.07 billion in the base year of 2025, with the projected market size expected to reach a significant figure by the end of the forecast period.
Tissue Microarray Industry Company Market Share
Tissue Microarray Industry Market Report: 2019-2033 Forecast
This comprehensive report provides an in-depth analysis of the Tissue Microarray (TMA) industry, offering valuable insights for stakeholders across the value chain. Covering the period 2019-2033, with a focus on 2025, this report analyzes market size, growth drivers, key segments (by end-user, procedure, and technology), leading players, and emerging opportunities. The report utilizes a robust methodology, incorporating both historical data and future projections, to provide a complete picture of this dynamic market. The global Tissue Microarray market is projected to reach xx Million by 2033, exhibiting a CAGR of xx% during the forecast period (2025-2033).
Tissue Microarray Industry Market Concentration & Dynamics
The Tissue Microarray market exhibits a moderately concentrated landscape, with several key players holding significant market share. The top five companies account for approximately xx% of the global market in 2025. However, the market is also characterized by a vibrant ecosystem of smaller players, particularly in niche segments. Innovation is a key driver, with ongoing advancements in technologies like Next-Generation Sequencing (NGS) and DNA microarray significantly impacting market dynamics.
Regulatory frameworks, primarily focused on ensuring the safety and efficacy of diagnostic tools, play a crucial role. Substitute products, such as traditional histopathological methods, pose some competition, but the advantages of TMAs in terms of efficiency and cost-effectiveness continue to fuel market growth. Consolidation through mergers and acquisitions (M&A) is also a noticeable trend. The number of M&A deals in the TMA sector has increased in recent years, with xx deals recorded between 2021 and 2023. This suggests a growing interest from larger players seeking to expand their market share and product portfolios. End-user trends reveal a strong preference for TMAs in high-throughput screening applications, particularly within the pharmaceutical and biotechnological sectors.
- Market Share (2025): Top 5 players - xx%
- M&A Deal Count (2021-2023): xx
- Key Growth Drivers: Technological innovation, increasing demand for high-throughput screening, regulatory approvals.
- Key Challenges: Competition from substitutes, stringent regulatory requirements.
Tissue Microarray Industry Industry Insights & Trends
The Tissue Microarray market is experiencing robust growth, driven by several key factors. The rising prevalence of chronic diseases, particularly cancers, is a significant contributor, fueling the demand for efficient diagnostic and research tools. The increasing adoption of personalized medicine is another key factor. TMAs play a crucial role in enabling personalized therapies by facilitating the analysis of individual patient samples. Technological advancements, particularly the integration of NGS and DNA microarray technologies with TMAs, have further enhanced the capabilities and applications of TMAs, driving market expansion. The market size is estimated at xx Million in 2025, and is projected to reach xx Million by 2033, reflecting a strong CAGR of xx%. This growth is supported by ongoing research and development efforts, leading to the development of more efficient and cost-effective TMA platforms. Consumer behavior trends show a preference for faster turnaround times and more comprehensive diagnostic information, which TMAs effectively address.
Key Markets & Segments Leading Tissue Microarray Industry
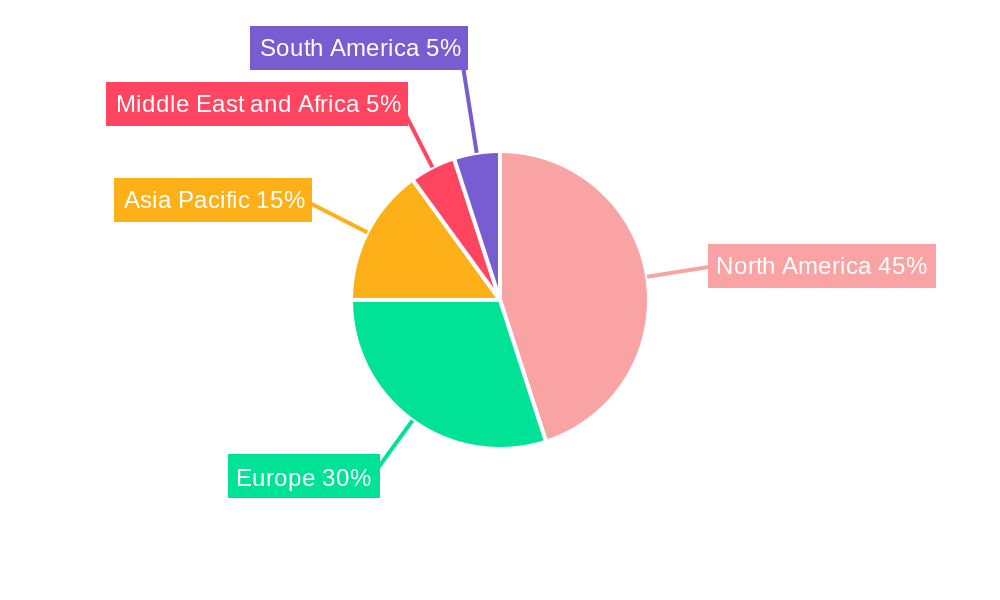
The North American region currently holds the largest market share in the TMA industry, driven by factors such as strong healthcare infrastructure, high research funding, and a large pool of pharmaceutical and biotechnological companies. However, the Asia-Pacific region is anticipated to witness significant growth in the coming years, fueled by rising healthcare expenditure and increasing awareness of advanced diagnostic techniques.
By End-User:
- Pharmaceutical and Biotechnological Companies: This segment dominates the market, driven by the need for efficient drug discovery and development.
- Research Organizations: Academic institutions and research centers form a substantial user base, utilizing TMAs for various research purposes.
By Procedure:
- Immunohistochemistry (IHC): This is the most widely used procedure, owing to its versatility and established methodology.
- Fluorescence in situ hybridization (FISH): FISH is becoming increasingly popular, particularly in cancer research.
By Technology:
- Polymerase Chain Reaction (PCR): PCR remains a cornerstone technology integrated with TMAs for molecular analysis.
- Next-Generation Sequencing (NGS): The integration of NGS with TMAs is a significant trend, opening new avenues in genomic research.
Growth Drivers:
- North America: Robust healthcare infrastructure, high research funding, large pharmaceutical/biotech sector.
- Asia-Pacific: Rising healthcare expenditure, increasing awareness of advanced diagnostics.
Tissue Microarray Industry Product Developments
Recent product innovations in the TMA market focus on enhancing efficiency, improving data quality, and expanding applications. This includes the development of automated tissue coring systems, high-throughput microarray platforms, and sophisticated software for data analysis. These advancements provide researchers and clinicians with more streamlined workflows and improved diagnostic capabilities, creating a competitive edge for manufacturers offering these enhanced products. The integration of NGS and other advanced molecular technologies with TMAs is a key area of innovation, providing a powerful tool for comprehensive genomic analysis.
Challenges in the Tissue Microarray Industry Market
The TMA market faces challenges including stringent regulatory hurdles for diagnostic applications, potentially leading to delays in product approvals and increased costs. Supply chain disruptions, particularly in the procurement of specialized reagents and equipment, can impact production and delivery timelines. Intense competition among established players and the emergence of new entrants also put pressure on pricing and margins. These factors collectively can impact market growth and profitability. Estimates suggest that regulatory delays account for xx% of project setbacks in the industry.
Forces Driving Tissue Microarray Industry Growth
The TMA market is driven by several factors, including the increasing prevalence of chronic diseases necessitating advanced diagnostics, technological advancements leading to improved efficiency and data quality, and increasing government investments in healthcare infrastructure supporting research and development. The rising demand for personalized medicine and the growing adoption of high-throughput screening methods are also significant drivers.
Challenges in the Tissue Microarray Industry Market
Long-term growth in the TMA market will depend on continued innovation in technology, strategic partnerships to expand market reach, and the exploration of new applications and markets. The development of automated systems, advanced software, and the integration of novel molecular techniques will be key for sustained growth.
Emerging Opportunities in Tissue Microarray Industry
Emerging opportunities lie in the development of more user-friendly and automated TMA platforms, expansion into new applications such as infectious disease diagnostics, and increased focus on data analytics and bioinformatics solutions to facilitate the interpretation of complex datasets generated by TMAs. New markets in developing countries with rising healthcare expenditure and growing awareness of advanced diagnostics also represent significant opportunities for expansion.
Leading Players in the Tissue Microarray Industry Sector
- BioCat GmbH
- Protein Biotechnologies
- PREMIER Biosoft
- Applied Microarrays
- US Biolab
- Arrayit Corporation
- Bio SB
- OriGene
- ProteoGenex
- Biocompare
- Novus Biologicals
- BioIVT
Key Milestones in Tissue Microarray Industry Industry
- May 2023: PathogenDx plans to launch a microarray-based urinary tract infection test, identifying 26 pathogens and 20 antimicrobial resistance genes. This will significantly improve targeted therapies.
- March 2023: TriMetis Life Sciences and ISENET collaborate on an automated tissue coring system, revolutionizing genomic profiling services.
Strategic Outlook for Tissue Microarray Industry Market
The future of the TMA market looks promising, with significant growth potential driven by continued technological advancements, expanding applications, and increasing demand for personalized medicine. Strategic partnerships, acquisitions, and investments in R&D will be crucial for companies seeking to capitalize on emerging opportunities and solidify their market position. The market's future hinges on addressing existing challenges and capitalizing on the increasing demand for advanced diagnostic tools.
Tissue Microarray Industry Segmentation
-
1. Procedure
- 1.1. Immunohistochemistry
- 1.2. Fluorescence in situ hybridization (FISH)
- 1.3. In Situ Hybridization
- 1.4. Other Procedure Types
-
2. Technology
- 2.1. Polymerase Chain Reaction (PCR)
- 2.2. Next-Generation Sequencing
- 2.3. DNA Microarray
- 2.4. Other Technology Types
-
3. End-User
- 3.1. Pharmaceutical and Biotechnological Companies
- 3.2. Research Organizations
Tissue Microarray Industry Segmentation By Geography
-
1. North America
- 1.1. United States
- 1.2. Canada
- 1.3. Mexico
-
2. Europe
- 2.1. Germany
- 2.2. United Kingdom
- 2.3. France
- 2.4. Italy
- 2.5. Spain
- 2.6. Rest of Europe
-
3. Asia Pacific
- 3.1. China
- 3.2. Japan
- 3.3. India
- 3.4. Australia
- 3.5. South Korea
- 3.6. Rest of Asia Pacific
-
4. Middle East and Africa
- 4.1. GCC
- 4.2. South Africa
- 4.3. Rest of Middle East and Africa
-
5. South America
- 5.1. Brazil
- 5.2. Argentina
- 5.3. Rest of South America
Tissue Microarray Industry Regional Market Share
Geographic Coverage of Tissue Microarray Industry
Tissue Microarray Industry REPORT HIGHLIGHTS
| Aspects | Details |
|---|---|
| Study Period | 2020-2034 |
| Base Year | 2025 |
| Estimated Year | 2026 |
| Forecast Period | 2026-2034 |
| Historical Period | 2020-2025 |
| Growth Rate | CAGR of 10.36% from 2020-2034 |
| Segmentation |
|
Table of Contents
- 1. Introduction
- 1.1. Research Scope
- 1.2. Market Segmentation
- 1.3. Research Methodology
- 1.4. Definitions and Assumptions
- 2. Executive Summary
- 2.1. Introduction
- 3. Market Dynamics
- 3.1. Introduction
- 3.2. Market Drivers
- 3.2.1. Growing Research and Development in Drug Discovery; Rising Burden of Cancer; Increasing Demand For Accurate Diagnostic Methods
- 3.3. Market Restrains
- 3.3.1. Availability of Alternative Techniques; High Cost Associated With Microarray Techniques
- 3.4. Market Trends
- 3.4.1. Immunohistochemistry Segment is Expected to Hold a Significant Market Share in the Tissue Microarray Market
- 4. Market Factor Analysis
- 4.1. Porters Five Forces
- 4.2. Supply/Value Chain
- 4.3. PESTEL analysis
- 4.4. Market Entropy
- 4.5. Patent/Trademark Analysis
- 5. Global Tissue Microarray Industry Analysis, Insights and Forecast, 2020-2032
- 5.1. Market Analysis, Insights and Forecast - by Procedure
- 5.1.1. Immunohistochemistry
- 5.1.2. Fluorescence in situ hybridization (FISH)
- 5.1.3. In Situ Hybridization
- 5.1.4. Other Procedure Types
- 5.2. Market Analysis, Insights and Forecast - by Technology
- 5.2.1. Polymerase Chain Reaction (PCR)
- 5.2.2. Next-Generation Sequencing
- 5.2.3. DNA Microarray
- 5.2.4. Other Technology Types
- 5.3. Market Analysis, Insights and Forecast - by End-User
- 5.3.1. Pharmaceutical and Biotechnological Companies
- 5.3.2. Research Organizations
- 5.4. Market Analysis, Insights and Forecast - by Region
- 5.4.1. North America
- 5.4.2. Europe
- 5.4.3. Asia Pacific
- 5.4.4. Middle East and Africa
- 5.4.5. South America
- 5.1. Market Analysis, Insights and Forecast - by Procedure
- 6. North America Tissue Microarray Industry Analysis, Insights and Forecast, 2020-2032
- 6.1. Market Analysis, Insights and Forecast - by Procedure
- 6.1.1. Immunohistochemistry
- 6.1.2. Fluorescence in situ hybridization (FISH)
- 6.1.3. In Situ Hybridization
- 6.1.4. Other Procedure Types
- 6.2. Market Analysis, Insights and Forecast - by Technology
- 6.2.1. Polymerase Chain Reaction (PCR)
- 6.2.2. Next-Generation Sequencing
- 6.2.3. DNA Microarray
- 6.2.4. Other Technology Types
- 6.3. Market Analysis, Insights and Forecast - by End-User
- 6.3.1. Pharmaceutical and Biotechnological Companies
- 6.3.2. Research Organizations
- 6.1. Market Analysis, Insights and Forecast - by Procedure
- 7. Europe Tissue Microarray Industry Analysis, Insights and Forecast, 2020-2032
- 7.1. Market Analysis, Insights and Forecast - by Procedure
- 7.1.1. Immunohistochemistry
- 7.1.2. Fluorescence in situ hybridization (FISH)
- 7.1.3. In Situ Hybridization
- 7.1.4. Other Procedure Types
- 7.2. Market Analysis, Insights and Forecast - by Technology
- 7.2.1. Polymerase Chain Reaction (PCR)
- 7.2.2. Next-Generation Sequencing
- 7.2.3. DNA Microarray
- 7.2.4. Other Technology Types
- 7.3. Market Analysis, Insights and Forecast - by End-User
- 7.3.1. Pharmaceutical and Biotechnological Companies
- 7.3.2. Research Organizations
- 7.1. Market Analysis, Insights and Forecast - by Procedure
- 8. Asia Pacific Tissue Microarray Industry Analysis, Insights and Forecast, 2020-2032
- 8.1. Market Analysis, Insights and Forecast - by Procedure
- 8.1.1. Immunohistochemistry
- 8.1.2. Fluorescence in situ hybridization (FISH)
- 8.1.3. In Situ Hybridization
- 8.1.4. Other Procedure Types
- 8.2. Market Analysis, Insights and Forecast - by Technology
- 8.2.1. Polymerase Chain Reaction (PCR)
- 8.2.2. Next-Generation Sequencing
- 8.2.3. DNA Microarray
- 8.2.4. Other Technology Types
- 8.3. Market Analysis, Insights and Forecast - by End-User
- 8.3.1. Pharmaceutical and Biotechnological Companies
- 8.3.2. Research Organizations
- 8.1. Market Analysis, Insights and Forecast - by Procedure
- 9. Middle East and Africa Tissue Microarray Industry Analysis, Insights and Forecast, 2020-2032
- 9.1. Market Analysis, Insights and Forecast - by Procedure
- 9.1.1. Immunohistochemistry
- 9.1.2. Fluorescence in situ hybridization (FISH)
- 9.1.3. In Situ Hybridization
- 9.1.4. Other Procedure Types
- 9.2. Market Analysis, Insights and Forecast - by Technology
- 9.2.1. Polymerase Chain Reaction (PCR)
- 9.2.2. Next-Generation Sequencing
- 9.2.3. DNA Microarray
- 9.2.4. Other Technology Types
- 9.3. Market Analysis, Insights and Forecast - by End-User
- 9.3.1. Pharmaceutical and Biotechnological Companies
- 9.3.2. Research Organizations
- 9.1. Market Analysis, Insights and Forecast - by Procedure
- 10. South America Tissue Microarray Industry Analysis, Insights and Forecast, 2020-2032
- 10.1. Market Analysis, Insights and Forecast - by Procedure
- 10.1.1. Immunohistochemistry
- 10.1.2. Fluorescence in situ hybridization (FISH)
- 10.1.3. In Situ Hybridization
- 10.1.4. Other Procedure Types
- 10.2. Market Analysis, Insights and Forecast - by Technology
- 10.2.1. Polymerase Chain Reaction (PCR)
- 10.2.2. Next-Generation Sequencing
- 10.2.3. DNA Microarray
- 10.2.4. Other Technology Types
- 10.3. Market Analysis, Insights and Forecast - by End-User
- 10.3.1. Pharmaceutical and Biotechnological Companies
- 10.3.2. Research Organizations
- 10.1. Market Analysis, Insights and Forecast - by Procedure
- 11. Competitive Analysis
- 11.1. Global Market Share Analysis 2025
- 11.2. Company Profiles
- 11.2.1 BioCat GmbH
- 11.2.1.1. Overview
- 11.2.1.2. Products
- 11.2.1.3. SWOT Analysis
- 11.2.1.4. Recent Developments
- 11.2.1.5. Financials (Based on Availability)
- 11.2.2 Protein Biotechnologies
- 11.2.2.1. Overview
- 11.2.2.2. Products
- 11.2.2.3. SWOT Analysis
- 11.2.2.4. Recent Developments
- 11.2.2.5. Financials (Based on Availability)
- 11.2.3 PREMIER Biosoft
- 11.2.3.1. Overview
- 11.2.3.2. Products
- 11.2.3.3. SWOT Analysis
- 11.2.3.4. Recent Developments
- 11.2.3.5. Financials (Based on Availability)
- 11.2.4 Applied Microarrays
- 11.2.4.1. Overview
- 11.2.4.2. Products
- 11.2.4.3. SWOT Analysis
- 11.2.4.4. Recent Developments
- 11.2.4.5. Financials (Based on Availability)
- 11.2.5 US Biolab
- 11.2.5.1. Overview
- 11.2.5.2. Products
- 11.2.5.3. SWOT Analysis
- 11.2.5.4. Recent Developments
- 11.2.5.5. Financials (Based on Availability)
- 11.2.6 Arrayit Corporation
- 11.2.6.1. Overview
- 11.2.6.2. Products
- 11.2.6.3. SWOT Analysis
- 11.2.6.4. Recent Developments
- 11.2.6.5. Financials (Based on Availability)
- 11.2.7 Bio SB
- 11.2.7.1. Overview
- 11.2.7.2. Products
- 11.2.7.3. SWOT Analysis
- 11.2.7.4. Recent Developments
- 11.2.7.5. Financials (Based on Availability)
- 11.2.8 OriGene
- 11.2.8.1. Overview
- 11.2.8.2. Products
- 11.2.8.3. SWOT Analysis
- 11.2.8.4. Recent Developments
- 11.2.8.5. Financials (Based on Availability)
- 11.2.9 ProteoGenex
- 11.2.9.1. Overview
- 11.2.9.2. Products
- 11.2.9.3. SWOT Analysis
- 11.2.9.4. Recent Developments
- 11.2.9.5. Financials (Based on Availability)
- 11.2.10 Biocompare
- 11.2.10.1. Overview
- 11.2.10.2. Products
- 11.2.10.3. SWOT Analysis
- 11.2.10.4. Recent Developments
- 11.2.10.5. Financials (Based on Availability)
- 11.2.11 Novus Biologicals
- 11.2.11.1. Overview
- 11.2.11.2. Products
- 11.2.11.3. SWOT Analysis
- 11.2.11.4. Recent Developments
- 11.2.11.5. Financials (Based on Availability)
- 11.2.12 BioIVT
- 11.2.12.1. Overview
- 11.2.12.2. Products
- 11.2.12.3. SWOT Analysis
- 11.2.12.4. Recent Developments
- 11.2.12.5. Financials (Based on Availability)
- 11.2.1 BioCat GmbH
List of Figures
- Figure 1: Global Tissue Microarray Industry Revenue Breakdown (billion, %) by Region 2025 & 2033
- Figure 2: Global Tissue Microarray Industry Volume Breakdown (K Unit, %) by Region 2025 & 2033
- Figure 3: North America Tissue Microarray Industry Revenue (billion), by Procedure 2025 & 2033
- Figure 4: North America Tissue Microarray Industry Volume (K Unit), by Procedure 2025 & 2033
- Figure 5: North America Tissue Microarray Industry Revenue Share (%), by Procedure 2025 & 2033
- Figure 6: North America Tissue Microarray Industry Volume Share (%), by Procedure 2025 & 2033
- Figure 7: North America Tissue Microarray Industry Revenue (billion), by Technology 2025 & 2033
- Figure 8: North America Tissue Microarray Industry Volume (K Unit), by Technology 2025 & 2033
- Figure 9: North America Tissue Microarray Industry Revenue Share (%), by Technology 2025 & 2033
- Figure 10: North America Tissue Microarray Industry Volume Share (%), by Technology 2025 & 2033
- Figure 11: North America Tissue Microarray Industry Revenue (billion), by End-User 2025 & 2033
- Figure 12: North America Tissue Microarray Industry Volume (K Unit), by End-User 2025 & 2033
- Figure 13: North America Tissue Microarray Industry Revenue Share (%), by End-User 2025 & 2033
- Figure 14: North America Tissue Microarray Industry Volume Share (%), by End-User 2025 & 2033
- Figure 15: North America Tissue Microarray Industry Revenue (billion), by Country 2025 & 2033
- Figure 16: North America Tissue Microarray Industry Volume (K Unit), by Country 2025 & 2033
- Figure 17: North America Tissue Microarray Industry Revenue Share (%), by Country 2025 & 2033
- Figure 18: North America Tissue Microarray Industry Volume Share (%), by Country 2025 & 2033
- Figure 19: Europe Tissue Microarray Industry Revenue (billion), by Procedure 2025 & 2033
- Figure 20: Europe Tissue Microarray Industry Volume (K Unit), by Procedure 2025 & 2033
- Figure 21: Europe Tissue Microarray Industry Revenue Share (%), by Procedure 2025 & 2033
- Figure 22: Europe Tissue Microarray Industry Volume Share (%), by Procedure 2025 & 2033
- Figure 23: Europe Tissue Microarray Industry Revenue (billion), by Technology 2025 & 2033
- Figure 24: Europe Tissue Microarray Industry Volume (K Unit), by Technology 2025 & 2033
- Figure 25: Europe Tissue Microarray Industry Revenue Share (%), by Technology 2025 & 2033
- Figure 26: Europe Tissue Microarray Industry Volume Share (%), by Technology 2025 & 2033
- Figure 27: Europe Tissue Microarray Industry Revenue (billion), by End-User 2025 & 2033
- Figure 28: Europe Tissue Microarray Industry Volume (K Unit), by End-User 2025 & 2033
- Figure 29: Europe Tissue Microarray Industry Revenue Share (%), by End-User 2025 & 2033
- Figure 30: Europe Tissue Microarray Industry Volume Share (%), by End-User 2025 & 2033
- Figure 31: Europe Tissue Microarray Industry Revenue (billion), by Country 2025 & 2033
- Figure 32: Europe Tissue Microarray Industry Volume (K Unit), by Country 2025 & 2033
- Figure 33: Europe Tissue Microarray Industry Revenue Share (%), by Country 2025 & 2033
- Figure 34: Europe Tissue Microarray Industry Volume Share (%), by Country 2025 & 2033
- Figure 35: Asia Pacific Tissue Microarray Industry Revenue (billion), by Procedure 2025 & 2033
- Figure 36: Asia Pacific Tissue Microarray Industry Volume (K Unit), by Procedure 2025 & 2033
- Figure 37: Asia Pacific Tissue Microarray Industry Revenue Share (%), by Procedure 2025 & 2033
- Figure 38: Asia Pacific Tissue Microarray Industry Volume Share (%), by Procedure 2025 & 2033
- Figure 39: Asia Pacific Tissue Microarray Industry Revenue (billion), by Technology 2025 & 2033
- Figure 40: Asia Pacific Tissue Microarray Industry Volume (K Unit), by Technology 2025 & 2033
- Figure 41: Asia Pacific Tissue Microarray Industry Revenue Share (%), by Technology 2025 & 2033
- Figure 42: Asia Pacific Tissue Microarray Industry Volume Share (%), by Technology 2025 & 2033
- Figure 43: Asia Pacific Tissue Microarray Industry Revenue (billion), by End-User 2025 & 2033
- Figure 44: Asia Pacific Tissue Microarray Industry Volume (K Unit), by End-User 2025 & 2033
- Figure 45: Asia Pacific Tissue Microarray Industry Revenue Share (%), by End-User 2025 & 2033
- Figure 46: Asia Pacific Tissue Microarray Industry Volume Share (%), by End-User 2025 & 2033
- Figure 47: Asia Pacific Tissue Microarray Industry Revenue (billion), by Country 2025 & 2033
- Figure 48: Asia Pacific Tissue Microarray Industry Volume (K Unit), by Country 2025 & 2033
- Figure 49: Asia Pacific Tissue Microarray Industry Revenue Share (%), by Country 2025 & 2033
- Figure 50: Asia Pacific Tissue Microarray Industry Volume Share (%), by Country 2025 & 2033
- Figure 51: Middle East and Africa Tissue Microarray Industry Revenue (billion), by Procedure 2025 & 2033
- Figure 52: Middle East and Africa Tissue Microarray Industry Volume (K Unit), by Procedure 2025 & 2033
- Figure 53: Middle East and Africa Tissue Microarray Industry Revenue Share (%), by Procedure 2025 & 2033
- Figure 54: Middle East and Africa Tissue Microarray Industry Volume Share (%), by Procedure 2025 & 2033
- Figure 55: Middle East and Africa Tissue Microarray Industry Revenue (billion), by Technology 2025 & 2033
- Figure 56: Middle East and Africa Tissue Microarray Industry Volume (K Unit), by Technology 2025 & 2033
- Figure 57: Middle East and Africa Tissue Microarray Industry Revenue Share (%), by Technology 2025 & 2033
- Figure 58: Middle East and Africa Tissue Microarray Industry Volume Share (%), by Technology 2025 & 2033
- Figure 59: Middle East and Africa Tissue Microarray Industry Revenue (billion), by End-User 2025 & 2033
- Figure 60: Middle East and Africa Tissue Microarray Industry Volume (K Unit), by End-User 2025 & 2033
- Figure 61: Middle East and Africa Tissue Microarray Industry Revenue Share (%), by End-User 2025 & 2033
- Figure 62: Middle East and Africa Tissue Microarray Industry Volume Share (%), by End-User 2025 & 2033
- Figure 63: Middle East and Africa Tissue Microarray Industry Revenue (billion), by Country 2025 & 2033
- Figure 64: Middle East and Africa Tissue Microarray Industry Volume (K Unit), by Country 2025 & 2033
- Figure 65: Middle East and Africa Tissue Microarray Industry Revenue Share (%), by Country 2025 & 2033
- Figure 66: Middle East and Africa Tissue Microarray Industry Volume Share (%), by Country 2025 & 2033
- Figure 67: South America Tissue Microarray Industry Revenue (billion), by Procedure 2025 & 2033
- Figure 68: South America Tissue Microarray Industry Volume (K Unit), by Procedure 2025 & 2033
- Figure 69: South America Tissue Microarray Industry Revenue Share (%), by Procedure 2025 & 2033
- Figure 70: South America Tissue Microarray Industry Volume Share (%), by Procedure 2025 & 2033
- Figure 71: South America Tissue Microarray Industry Revenue (billion), by Technology 2025 & 2033
- Figure 72: South America Tissue Microarray Industry Volume (K Unit), by Technology 2025 & 2033
- Figure 73: South America Tissue Microarray Industry Revenue Share (%), by Technology 2025 & 2033
- Figure 74: South America Tissue Microarray Industry Volume Share (%), by Technology 2025 & 2033
- Figure 75: South America Tissue Microarray Industry Revenue (billion), by End-User 2025 & 2033
- Figure 76: South America Tissue Microarray Industry Volume (K Unit), by End-User 2025 & 2033
- Figure 77: South America Tissue Microarray Industry Revenue Share (%), by End-User 2025 & 2033
- Figure 78: South America Tissue Microarray Industry Volume Share (%), by End-User 2025 & 2033
- Figure 79: South America Tissue Microarray Industry Revenue (billion), by Country 2025 & 2033
- Figure 80: South America Tissue Microarray Industry Volume (K Unit), by Country 2025 & 2033
- Figure 81: South America Tissue Microarray Industry Revenue Share (%), by Country 2025 & 2033
- Figure 82: South America Tissue Microarray Industry Volume Share (%), by Country 2025 & 2033
List of Tables
- Table 1: Global Tissue Microarray Industry Revenue billion Forecast, by Procedure 2020 & 2033
- Table 2: Global Tissue Microarray Industry Volume K Unit Forecast, by Procedure 2020 & 2033
- Table 3: Global Tissue Microarray Industry Revenue billion Forecast, by Technology 2020 & 2033
- Table 4: Global Tissue Microarray Industry Volume K Unit Forecast, by Technology 2020 & 2033
- Table 5: Global Tissue Microarray Industry Revenue billion Forecast, by End-User 2020 & 2033
- Table 6: Global Tissue Microarray Industry Volume K Unit Forecast, by End-User 2020 & 2033
- Table 7: Global Tissue Microarray Industry Revenue billion Forecast, by Region 2020 & 2033
- Table 8: Global Tissue Microarray Industry Volume K Unit Forecast, by Region 2020 & 2033
- Table 9: Global Tissue Microarray Industry Revenue billion Forecast, by Procedure 2020 & 2033
- Table 10: Global Tissue Microarray Industry Volume K Unit Forecast, by Procedure 2020 & 2033
- Table 11: Global Tissue Microarray Industry Revenue billion Forecast, by Technology 2020 & 2033
- Table 12: Global Tissue Microarray Industry Volume K Unit Forecast, by Technology 2020 & 2033
- Table 13: Global Tissue Microarray Industry Revenue billion Forecast, by End-User 2020 & 2033
- Table 14: Global Tissue Microarray Industry Volume K Unit Forecast, by End-User 2020 & 2033
- Table 15: Global Tissue Microarray Industry Revenue billion Forecast, by Country 2020 & 2033
- Table 16: Global Tissue Microarray Industry Volume K Unit Forecast, by Country 2020 & 2033
- Table 17: United States Tissue Microarray Industry Revenue (billion) Forecast, by Application 2020 & 2033
- Table 18: United States Tissue Microarray Industry Volume (K Unit) Forecast, by Application 2020 & 2033
- Table 19: Canada Tissue Microarray Industry Revenue (billion) Forecast, by Application 2020 & 2033
- Table 20: Canada Tissue Microarray Industry Volume (K Unit) Forecast, by Application 2020 & 2033
- Table 21: Mexico Tissue Microarray Industry Revenue (billion) Forecast, by Application 2020 & 2033
- Table 22: Mexico Tissue Microarray Industry Volume (K Unit) Forecast, by Application 2020 & 2033
- Table 23: Global Tissue Microarray Industry Revenue billion Forecast, by Procedure 2020 & 2033
- Table 24: Global Tissue Microarray Industry Volume K Unit Forecast, by Procedure 2020 & 2033
- Table 25: Global Tissue Microarray Industry Revenue billion Forecast, by Technology 2020 & 2033
- Table 26: Global Tissue Microarray Industry Volume K Unit Forecast, by Technology 2020 & 2033
- Table 27: Global Tissue Microarray Industry Revenue billion Forecast, by End-User 2020 & 2033
- Table 28: Global Tissue Microarray Industry Volume K Unit Forecast, by End-User 2020 & 2033
- Table 29: Global Tissue Microarray Industry Revenue billion Forecast, by Country 2020 & 2033
- Table 30: Global Tissue Microarray Industry Volume K Unit Forecast, by Country 2020 & 2033
- Table 31: Germany Tissue Microarray Industry Revenue (billion) Forecast, by Application 2020 & 2033
- Table 32: Germany Tissue Microarray Industry Volume (K Unit) Forecast, by Application 2020 & 2033
- Table 33: United Kingdom Tissue Microarray Industry Revenue (billion) Forecast, by Application 2020 & 2033
- Table 34: United Kingdom Tissue Microarray Industry Volume (K Unit) Forecast, by Application 2020 & 2033
- Table 35: France Tissue Microarray Industry Revenue (billion) Forecast, by Application 2020 & 2033
- Table 36: France Tissue Microarray Industry Volume (K Unit) Forecast, by Application 2020 & 2033
- Table 37: Italy Tissue Microarray Industry Revenue (billion) Forecast, by Application 2020 & 2033
- Table 38: Italy Tissue Microarray Industry Volume (K Unit) Forecast, by Application 2020 & 2033
- Table 39: Spain Tissue Microarray Industry Revenue (billion) Forecast, by Application 2020 & 2033
- Table 40: Spain Tissue Microarray Industry Volume (K Unit) Forecast, by Application 2020 & 2033
- Table 41: Rest of Europe Tissue Microarray Industry Revenue (billion) Forecast, by Application 2020 & 2033
- Table 42: Rest of Europe Tissue Microarray Industry Volume (K Unit) Forecast, by Application 2020 & 2033
- Table 43: Global Tissue Microarray Industry Revenue billion Forecast, by Procedure 2020 & 2033
- Table 44: Global Tissue Microarray Industry Volume K Unit Forecast, by Procedure 2020 & 2033
- Table 45: Global Tissue Microarray Industry Revenue billion Forecast, by Technology 2020 & 2033
- Table 46: Global Tissue Microarray Industry Volume K Unit Forecast, by Technology 2020 & 2033
- Table 47: Global Tissue Microarray Industry Revenue billion Forecast, by End-User 2020 & 2033
- Table 48: Global Tissue Microarray Industry Volume K Unit Forecast, by End-User 2020 & 2033
- Table 49: Global Tissue Microarray Industry Revenue billion Forecast, by Country 2020 & 2033
- Table 50: Global Tissue Microarray Industry Volume K Unit Forecast, by Country 2020 & 2033
- Table 51: China Tissue Microarray Industry Revenue (billion) Forecast, by Application 2020 & 2033
- Table 52: China Tissue Microarray Industry Volume (K Unit) Forecast, by Application 2020 & 2033
- Table 53: Japan Tissue Microarray Industry Revenue (billion) Forecast, by Application 2020 & 2033
- Table 54: Japan Tissue Microarray Industry Volume (K Unit) Forecast, by Application 2020 & 2033
- Table 55: India Tissue Microarray Industry Revenue (billion) Forecast, by Application 2020 & 2033
- Table 56: India Tissue Microarray Industry Volume (K Unit) Forecast, by Application 2020 & 2033
- Table 57: Australia Tissue Microarray Industry Revenue (billion) Forecast, by Application 2020 & 2033
- Table 58: Australia Tissue Microarray Industry Volume (K Unit) Forecast, by Application 2020 & 2033
- Table 59: South Korea Tissue Microarray Industry Revenue (billion) Forecast, by Application 2020 & 2033
- Table 60: South Korea Tissue Microarray Industry Volume (K Unit) Forecast, by Application 2020 & 2033
- Table 61: Rest of Asia Pacific Tissue Microarray Industry Revenue (billion) Forecast, by Application 2020 & 2033
- Table 62: Rest of Asia Pacific Tissue Microarray Industry Volume (K Unit) Forecast, by Application 2020 & 2033
- Table 63: Global Tissue Microarray Industry Revenue billion Forecast, by Procedure 2020 & 2033
- Table 64: Global Tissue Microarray Industry Volume K Unit Forecast, by Procedure 2020 & 2033
- Table 65: Global Tissue Microarray Industry Revenue billion Forecast, by Technology 2020 & 2033
- Table 66: Global Tissue Microarray Industry Volume K Unit Forecast, by Technology 2020 & 2033
- Table 67: Global Tissue Microarray Industry Revenue billion Forecast, by End-User 2020 & 2033
- Table 68: Global Tissue Microarray Industry Volume K Unit Forecast, by End-User 2020 & 2033
- Table 69: Global Tissue Microarray Industry Revenue billion Forecast, by Country 2020 & 2033
- Table 70: Global Tissue Microarray Industry Volume K Unit Forecast, by Country 2020 & 2033
- Table 71: GCC Tissue Microarray Industry Revenue (billion) Forecast, by Application 2020 & 2033
- Table 72: GCC Tissue Microarray Industry Volume (K Unit) Forecast, by Application 2020 & 2033
- Table 73: South Africa Tissue Microarray Industry Revenue (billion) Forecast, by Application 2020 & 2033
- Table 74: South Africa Tissue Microarray Industry Volume (K Unit) Forecast, by Application 2020 & 2033
- Table 75: Rest of Middle East and Africa Tissue Microarray Industry Revenue (billion) Forecast, by Application 2020 & 2033
- Table 76: Rest of Middle East and Africa Tissue Microarray Industry Volume (K Unit) Forecast, by Application 2020 & 2033
- Table 77: Global Tissue Microarray Industry Revenue billion Forecast, by Procedure 2020 & 2033
- Table 78: Global Tissue Microarray Industry Volume K Unit Forecast, by Procedure 2020 & 2033
- Table 79: Global Tissue Microarray Industry Revenue billion Forecast, by Technology 2020 & 2033
- Table 80: Global Tissue Microarray Industry Volume K Unit Forecast, by Technology 2020 & 2033
- Table 81: Global Tissue Microarray Industry Revenue billion Forecast, by End-User 2020 & 2033
- Table 82: Global Tissue Microarray Industry Volume K Unit Forecast, by End-User 2020 & 2033
- Table 83: Global Tissue Microarray Industry Revenue billion Forecast, by Country 2020 & 2033
- Table 84: Global Tissue Microarray Industry Volume K Unit Forecast, by Country 2020 & 2033
- Table 85: Brazil Tissue Microarray Industry Revenue (billion) Forecast, by Application 2020 & 2033
- Table 86: Brazil Tissue Microarray Industry Volume (K Unit) Forecast, by Application 2020 & 2033
- Table 87: Argentina Tissue Microarray Industry Revenue (billion) Forecast, by Application 2020 & 2033
- Table 88: Argentina Tissue Microarray Industry Volume (K Unit) Forecast, by Application 2020 & 2033
- Table 89: Rest of South America Tissue Microarray Industry Revenue (billion) Forecast, by Application 2020 & 2033
- Table 90: Rest of South America Tissue Microarray Industry Volume (K Unit) Forecast, by Application 2020 & 2033
Frequently Asked Questions
1. What is the projected Compound Annual Growth Rate (CAGR) of the Tissue Microarray Industry?
The projected CAGR is approximately 10.36%.
2. Which companies are prominent players in the Tissue Microarray Industry?
Key companies in the market include BioCat GmbH, Protein Biotechnologies, PREMIER Biosoft, Applied Microarrays, US Biolab, Arrayit Corporation, Bio SB, OriGene, ProteoGenex, Biocompare, Novus Biologicals, BioIVT.
3. What are the main segments of the Tissue Microarray Industry?
The market segments include Procedure, Technology, End-User.
4. Can you provide details about the market size?
The market size is estimated to be USD 14.07 billion as of 2022.
5. What are some drivers contributing to market growth?
Growing Research and Development in Drug Discovery; Rising Burden of Cancer; Increasing Demand For Accurate Diagnostic Methods.
6. What are the notable trends driving market growth?
Immunohistochemistry Segment is Expected to Hold a Significant Market Share in the Tissue Microarray Market.
7. Are there any restraints impacting market growth?
Availability of Alternative Techniques; High Cost Associated With Microarray Techniques.
8. Can you provide examples of recent developments in the market?
May 2023: PathogenDx planned to launch a microarray-based test for urinary tract infections in late 2023. The new urinary tract infection assay will help in the identification of 26 pathogens and 20 associated antimicrobial resistance genes in one multiplexed test and favor targeted therapies for patients.
9. What pricing options are available for accessing the report?
Pricing options include single-user, multi-user, and enterprise licenses priced at USD 4750, USD 5250, and USD 8750 respectively.
10. Is the market size provided in terms of value or volume?
The market size is provided in terms of value, measured in billion and volume, measured in K Unit.
11. Are there any specific market keywords associated with the report?
Yes, the market keyword associated with the report is "Tissue Microarray Industry," which aids in identifying and referencing the specific market segment covered.
12. How do I determine which pricing option suits my needs best?
The pricing options vary based on user requirements and access needs. Individual users may opt for single-user licenses, while businesses requiring broader access may choose multi-user or enterprise licenses for cost-effective access to the report.
13. Are there any additional resources or data provided in the Tissue Microarray Industry report?
While the report offers comprehensive insights, it's advisable to review the specific contents or supplementary materials provided to ascertain if additional resources or data are available.
14. How can I stay updated on further developments or reports in the Tissue Microarray Industry?
To stay informed about further developments, trends, and reports in the Tissue Microarray Industry, consider subscribing to industry newsletters, following relevant companies and organizations, or regularly checking reputable industry news sources and publications.
Methodology
Step 1 - Identification of Relevant Samples Size from Population Database


Step 2 - Approaches for Defining Global Market Size (Value, Volume* & Price*)

Note*: In applicable scenarios
Step 3 - Data Sources
Primary Research
- Web Analytics
- Survey Reports
- Research Institute
- Latest Research Reports
- Opinion Leaders
Secondary Research
- Annual Reports
- White Paper
- Latest Press Release
- Industry Association
- Paid Database
- Investor Presentations

Step 4 - Data Triangulation
Involves using different sources of information in order to increase the validity of a study
These sources are likely to be stakeholders in a program - participants, other researchers, program staff, other community members, and so on.
Then we put all data in single framework & apply various statistical tools to find out the dynamic on the market.
During the analysis stage, feedback from the stakeholder groups would be compared to determine areas of agreement as well as areas of divergence