

Key Insights
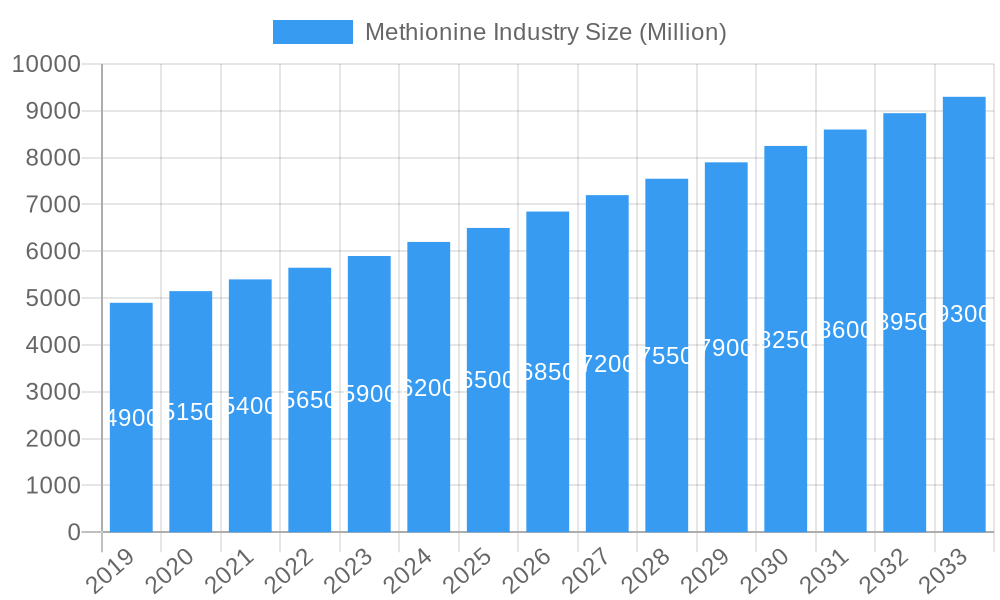
The global Methionine market is projected to reach USD 6310 million by 2025, exhibiting a CAGR of 4.3%. This growth is primarily driven by escalating demand in the animal feed sector, essential for livestock health and feed efficiency. Increased global protein consumption, fueled by population growth, further bolsters methionine demand. The pharmaceutical industry's expanding use in therapeutic applications and nutritional supplements also contributes significantly. Technological advancements and strategic investments in production capacity by key players are also supporting market expansion.
Methionine Industry Market Size (In Billion)
The market is segmented by form into Liquid and Powder, with Powder methionine leading due to its logistical advantages in animal feed. The Food and Beverage sector also utilizes methionine for nutritional fortification and as a flavor enhancer. However, market growth faces headwinds from fluctuating raw material prices, particularly crude oil, and stringent environmental regulations. Despite these challenges, robust demand from animal feed, emerging applications, and global expansion by major companies like Sumitomo Chemical, Evonik Industries, and Adisseo, indicate a strong growth trajectory for the methionine market.
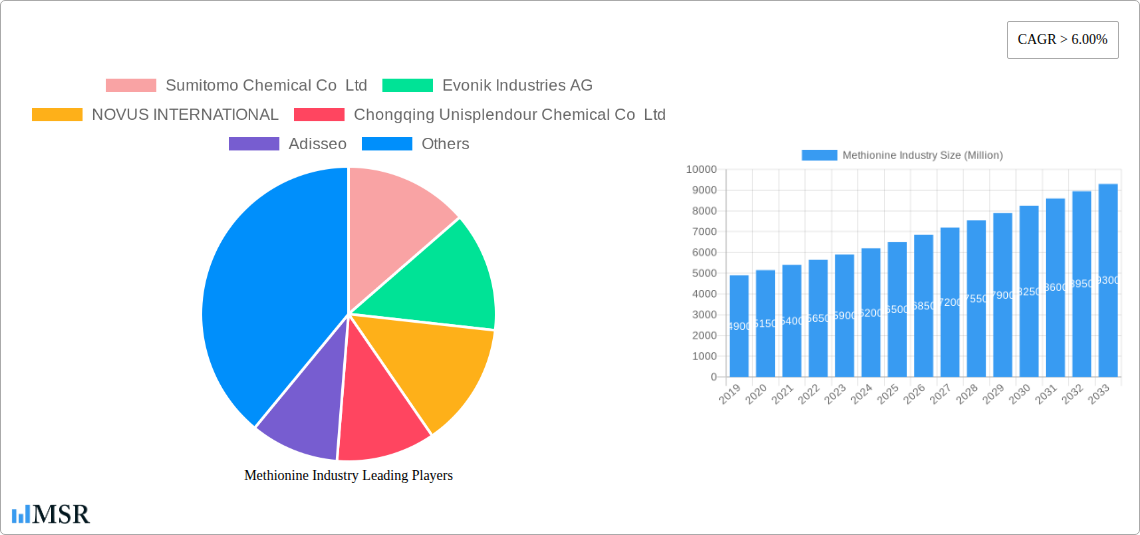
Methionine Industry Company Market Share
This comprehensive Methionine Industry report analyzes the global market from 2019 to 2033, with a base year of 2025 and forecasts to 2033. It covers historical performance (2019-2024), market dynamics, key players, growth drivers, and emerging opportunities. Explore the competitive landscape, technological innovations, and regulatory influences shaping the future of methionine production and consumption.
Methionine Industry Market Concentration & Dynamics
The global methionine market exhibits a moderate to high concentration, dominated by a few key players who command significant market share. Leading companies like Evonik Industries AG, Adisseo, and Novus International are at the forefront, investing heavily in capacity expansion and technological innovation to maintain their competitive edge. The innovation ecosystem is driven by research and development focused on improving production efficiency, enhancing product purity, and developing sustainable manufacturing processes. Regulatory frameworks, particularly concerning animal feed additives and food safety, play a crucial role in market access and product development. While direct substitutes for methionine are limited due to its essential amino acid status, the development of alternative feed formulations and advancements in nutrient management can influence demand. End-user trends, especially the growing demand for animal protein and the increasing adoption of precision nutrition in animal feed, are significant drivers. Merger and acquisition (M&A) activities, though infrequent, can significantly reshape the market landscape and consolidate market power. For instance, strategic acquisitions of smaller players or joint ventures can bolster a company's global presence and product portfolio, contributing to the overall market dynamics. The continuous pursuit of higher purity and more bioavailable forms of methionine is a key area of focus for market leaders.
Methionine Industry Industry Insights & Trends
The methionine industry is poised for robust growth, driven by escalating global demand for animal protein and a burgeoning pharmaceutical sector. The market size is projected to reach USD 7,500 million by 2025, with a projected Compound Annual Growth Rate (CAGR) of 5.8% during the forecast period of 2025–2033. This growth is fundamentally underpinned by the indispensable role of methionine in animal nutrition, serving as a crucial amino acid for poultry, swine, and aquaculture, promoting optimal growth, feed conversion efficiency, and overall animal health. The increasing global population and rising disposable incomes in emerging economies are fueling a significant surge in meat and dairy consumption, directly translating to higher demand for methionine as an additive in animal feed.
Technological disruptions are also playing a pivotal role. Continuous advancements in manufacturing processes, such as the development of more efficient fermentation techniques and improved synthesis pathways, are leading to higher yields and reduced production costs. Companies are investing in research to optimize the DL-methionine and L-methionine production, catering to specific application needs. Furthermore, the pharmaceutical industry's demand for methionine as a building block for various active pharmaceutical ingredients (APIs) and its use in nutritional supplements are contributing to market expansion.
Evolving consumer behaviors, particularly the growing preference for ethically sourced and sustainably produced animal products, are indirectly influencing the methionine market. Producers are under pressure to adopt greener manufacturing practices and ensure the traceability and safety of their products. The trend towards precision nutrition in animal husbandry, where feed formulations are tailored to specific animal needs, is also creating opportunities for specialized methionine products with enhanced bioavailability. The integration of digital technologies in supply chain management and production monitoring is further enhancing operational efficiency and market responsiveness. The global methionine market is a dynamic sector, adapting to both macro-economic shifts and micro-level technological innovations.
Key Markets & Segments Leading Methionine Industry
The methionine industry is characterized by the dominance of specific regions and end-user segments, driven by distinct economic and demographic factors.
Dominant Regions:
Asia Pacific: This region is emerging as the largest and fastest-growing market for methionine.
- Drivers: Rapid population growth, increasing per capita income, and the subsequent surge in demand for animal protein, particularly in China, India, and Southeast Asian nations. Significant investments in modernizing animal husbandry practices and aquaculture. Supportive government policies encouraging domestic production and consumption of animal-based foods.
- Analysis: The burgeoning poultry and swine industries in countries like China and Vietnam are major consumers of methionine. The region's strong manufacturing base and increasing focus on agricultural productivity contribute to its market leadership.
North America: A mature yet significant market, driven by advanced animal agriculture and a robust pharmaceutical sector.
- Drivers: Highly developed and industrialized animal farming sectors, particularly poultry and swine. Strong demand for high-quality feed additives to optimize animal performance. Growing use of methionine in nutraceuticals and pharmaceutical applications.
- Analysis: The US and Canada are key markets, with stringent quality standards and a focus on efficiency driving the adoption of advanced feed formulations.
Europe: A well-established market with a strong emphasis on sustainable agriculture and animal welfare.
- Drivers: Stringent regulations promoting animal welfare and food safety indirectly support the demand for high-quality feed ingredients like methionine. A significant presence of major methionine producers. Growing interest in plant-based diets influencing the overall animal feed market.
- Analysis: While growth rates might be moderate, Europe remains a critical market due to its established infrastructure and consumer demand for responsibly produced food.
Dominant Segments:
End-user Industry: Animal Feed: This segment overwhelmingly dominates the global methionine market, accounting for over 85% of the total demand.
- Drivers: Methionine is an essential amino acid for animal growth, health, and productivity. It is a critical component in feed formulations for poultry, swine, aquaculture, and ruminants. Increasing intensification of animal farming to meet global protein demand.
- Analysis: The poultry sector is the largest consumer, followed by swine and aquaculture. The efficiency gains and cost-effectiveness that methionine provides in animal feed are unparalleled, making it a non-negotiable ingredient for large-scale animal producers.
Type: Powder: While liquid methionine is gaining traction, the powder form, primarily DL-methionine, continues to hold a significant market share due to its ease of handling, storage, and integration into dry feed formulations.
- Drivers: Cost-effectiveness, established supply chains, and familiarity among feed manufacturers. Suitable for a wide range of feed milling operations.
- Analysis: The widespread adoption of powdered methionine across various animal feed applications ensures its continued dominance.
End-user Industry: Pharmaceutical: This segment, while smaller than animal feed, is experiencing steady growth.
- Drivers: Methionine's role as a precursor for protein synthesis and its antioxidant properties. Use in the synthesis of various drugs and as a dietary supplement for human health.
- Analysis: Increasing awareness of health and wellness, coupled with advancements in pharmaceutical research, drives the demand for high-purity methionine.
Methionine Industry Product Developments
Recent product developments in the methionine industry highlight a focus on enhancing production efficiency, product sustainability, and catering to specific application needs. Companies are investing in advanced manufacturing technologies to produce both DL-methionine and L-methionine with improved purity and bioavailability. For instance, the development of liquid methionine formulations by key players like Adisseo signifies a move towards more versatile and easier-to-handle products, particularly for large-scale feed operations. Research is also ongoing to optimize fermentation processes and explore alternative feedstocks, aiming to reduce the environmental footprint of methionine production. These innovations are crucial for maintaining competitive advantages, meeting evolving regulatory demands, and expanding into niche markets within the pharmaceutical and nutraceutical sectors.
Challenges in the Methionine Industry Market
The methionine industry faces several critical challenges that impact its growth trajectory.
- Volatile Raw Material Prices: The primary raw materials for methionine synthesis, such as acrolein and methyl mercaptan, are often derived from petrochemicals. Fluctuations in crude oil prices directly affect production costs, creating price volatility for methionine.
- Stringent Environmental Regulations: Increasing global focus on environmental sustainability and stricter regulations concerning emissions and waste disposal can lead to higher compliance costs for manufacturers. The energy-intensive nature of methionine production poses an ongoing challenge.
- Supply Chain Disruptions: Geopolitical events, natural disasters, and logistics issues can disrupt the global supply chain for methionine, leading to potential shortages and price hikes. The concentration of production in certain regions exacerbates this risk.
- Intense Competition and Price Pressure: The presence of a few dominant players and the continuous drive for cost optimization lead to intense price competition, potentially impacting profit margins for smaller manufacturers.
Forces Driving Methionine Industry Growth
Several key forces are propelling the growth of the methionine industry:
- Growing Global Demand for Animal Protein: The increasing world population and rising disposable incomes in emerging economies are driving a significant rise in the consumption of meat, poultry, eggs, and fish. Methionine is an indispensable component of animal feed, essential for optimizing animal growth and feed conversion ratios, thus directly fueling demand.
- Advancements in Animal Husbandry: Modernization of animal farming practices, including intensification and the adoption of precision nutrition, necessitate the use of high-quality feed additives like methionine to maximize animal performance, health, and welfare.
- Expansion of the Pharmaceutical and Nutraceutical Sectors: Methionine serves as a crucial amino acid in human nutrition and is utilized in the synthesis of various pharmaceutical compounds and dietary supplements. The growing health consciousness and demand for health-promoting products are contributing to this segment's growth.
- Technological Innovations in Production: Ongoing research and development in optimizing methionine synthesis and fermentation processes are leading to improved production efficiency, higher purity products, and potentially lower manufacturing costs, making methionine more accessible.
Challenges in the Methionine Industry Market
The long-term growth catalysts for the methionine industry are deeply intertwined with innovation, strategic market penetration, and adaptation to evolving industry standards.
- Sustainable Production Technologies: The development and widespread adoption of eco-friendly and sustainable manufacturing processes, including the use of renewable energy sources and the minimization of waste, will be crucial for long-term market acceptance and regulatory compliance.
- Diversification of Applications: While animal feed remains the primary driver, exploring and expanding applications in the pharmaceutical, nutraceutical, and even niche industrial sectors can create new revenue streams and reduce reliance on a single market.
- Strategic Partnerships and Collaborations: Forging strategic alliances with feed manufacturers, pharmaceutical companies, and research institutions can accelerate product development, enhance market reach, and foster innovation.
- Geographical Market Expansion: Targeting and penetrating untapped or underserved geographical markets, particularly in developing regions with rapidly growing animal agriculture sectors, will unlock significant growth potential.
Emerging Opportunities in Methionine Industry
The methionine industry is ripe with emerging opportunities driven by evolving consumer preferences, technological advancements, and global health trends.
- Bio-based Methionine Production: Research into producing methionine through fermentation using renewable feedstocks presents a significant opportunity to enhance sustainability and reduce dependence on petrochemicals, aligning with growing environmental consciousness.
- Precision Nutrition for Livestock: The increasing adoption of precision nutrition in animal feed creates opportunities for customized methionine formulations that offer enhanced bioavailability and targeted nutritional benefits, leading to improved animal health and productivity.
- Functional Foods and Nutraceuticals: The growing demand for functional foods and dietary supplements that promote human health presents a burgeoning market for high-purity methionine. Its role in detoxification and as an antioxidant makes it a valuable ingredient.
- Growth in Aquaculture: The global expansion of aquaculture to meet rising seafood demand offers a significant growth avenue for methionine, as it is vital for the optimal growth and health of farmed fish and shellfish.
Leading Players in the Methionine Industry Sector
- Sumitomo Chemical Co Ltd
- Evonik Industries AG
- NOVUS INTERNATIONAL
- Chongqing Unisplendour Chemical Co Ltd
- Adisseo
- Volzhsky Orgsynthese JSC
- Zhejiang NHU Co Ltd
- CJ CheilJedang Corp
Key Milestones in Methionine Industry Industry
- September 2022: Adisseo significantly bolstered its global methionine production capacity by commencing operations at its new 180,000-ton liquid methionine plant in Nanjing, China. This strategic expansion effectively doubled the company's total methionine capacity to 350,000 tons, consolidating its leading position in the global market and enhancing its supply chain resilience.
- March 2022: Evonik Industries AG announced a substantial expansion project at its mobile area manufacturing facility in Theodore, Alabama. This investment of USD 176.5 million was aimed at bolstering its animal nutrition business line by expanding the production of methyl mercaptan, a key intermediate for manufacturing its MetAmino (DL-methionine) product, thereby strengthening its market presence and production capabilities.
Strategic Outlook for Methionine Industry Market
The strategic outlook for the methionine industry is characterized by sustained growth and evolving market dynamics. Key growth accelerators include the continuous expansion of the global animal feed market, driven by increasing protein demand, and the persistent advancements in animal husbandry practices that emphasize feed efficiency and animal welfare. The pharmaceutical and nutraceutical sectors represent a significant avenue for diversification and value addition, with growing consumer interest in health supplements. Furthermore, the industry's focus on developing sustainable production methods and exploring bio-based alternatives will be critical for long-term competitiveness and regulatory compliance. Companies that invest in technological innovation, strengthen their global supply chains, and strategically target emerging markets are best positioned to capitalize on the abundant opportunities within this vital industry.
Methionine Industry Segmentation
-
1. Type
- 1.1. Liquid
- 1.2. Powder
-
2. End-user Industry
- 2.1. Food and Beverage
- 2.2. Pharmaceutical
- 2.3. Animal Feed
- 2.4. Other End-user Industries
Methionine Industry Segmentation By Geography
-
1. Asia Pacific
- 1.1. China
- 1.2. India
- 1.3. Japan
- 1.4. South Korea
- 1.5. Rest of Asia Pacific
-
2. North America
- 2.1. United States
- 2.2. Canada
- 2.3. Mexico
-
3. Europe
- 3.1. Germany
- 3.2. United Kingdom
- 3.3. Italy
- 3.4. France
- 3.5. Rest of Europe
-
4. South America
- 4.1. Brazil
- 4.2. Argentina
- 4.3. Rest of South America
-
5. Middle East and Africa
- 5.1. Saudi Arabia
- 5.2. South Africa
- 5.3. Rest of Middle East and Africa
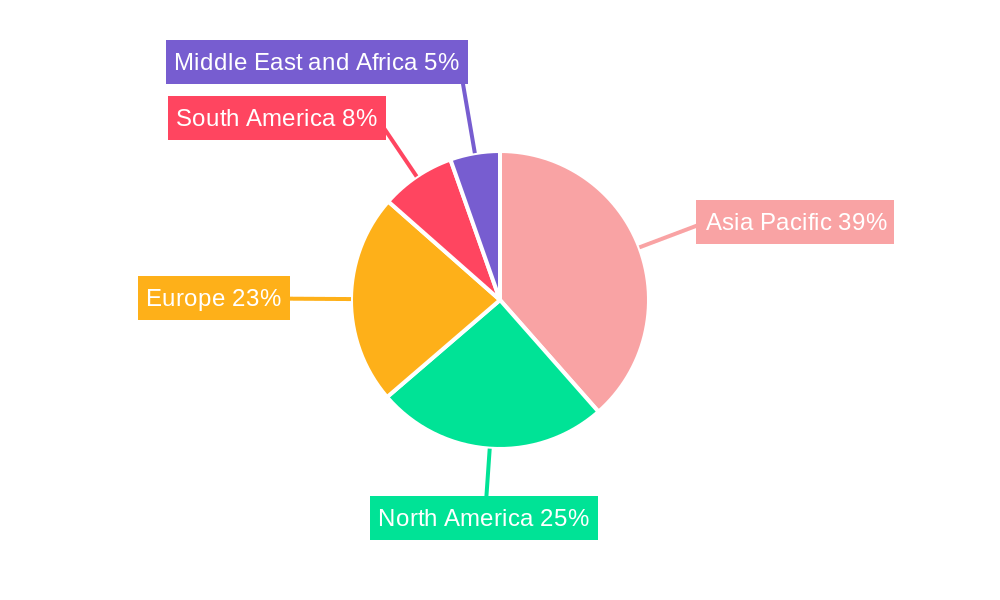
Methionine Industry Regional Market Share
Geographic Coverage of Methionine Industry
Methionine Industry REPORT HIGHLIGHTS
| Aspects | Details |
|---|---|
| Study Period | 2020-2034 |
| Base Year | 2025 |
| Estimated Year | 2026 |
| Forecast Period | 2026-2034 |
| Historical Period | 2020-2025 |
| Growth Rate | CAGR of 4.3% from 2020-2034 |
| Segmentation |
|
Table of Contents
- 1. Introduction
- 1.1. Research Scope
- 1.2. Market Segmentation
- 1.3. Research Objective
- 1.4. Definitions and Assumptions
- 2. Executive Summary
- 2.1. Market Snapshot
- 3. Market Dynamics
- 3.1. Market Drivers
- 3.2. Market Restrains
- 3.3. Market Trends
- 3.4. Market Opportunities
- 4. Market Factor Analysis
- 4.1. Porters Five Forces
- 4.1.1. Bargaining Power of Suppliers
- 4.1.2. Bargaining Power of Buyers
- 4.1.3. Threat of New Entrants
- 4.1.4. Threat of Substitutes
- 4.1.5. Competitive Rivalry
- 4.2. PESTEL analysis
- 4.3. BCG Analysis
- 4.3.1. Stars (High Growth, High Market Share)
- 4.3.2. Cash Cows (Low Growth, High Market Share)
- 4.3.3. Question Mark (High Growth, Low Market Share)
- 4.3.4. Dogs (Low Growth, Low Market Share)
- 4.4. Ansoff Matrix Analysis
- 4.5. Supply Chain Analysis
- 4.6. Regulatory Landscape
- 4.7. Current Market Potential and Opportunity Assessment (TAM–SAM–SOM Framework)
- 4.8. MSR Analyst Note
- 4.1. Porters Five Forces
- 5. Market Analysis, Insights and Forecast 2021-2033
- 5.1. Market Analysis, Insights and Forecast - by Type
- 5.1.1. Liquid
- 5.1.2. Powder
- 5.2. Market Analysis, Insights and Forecast - by End-user Industry
- 5.2.1. Food and Beverage
- 5.2.2. Pharmaceutical
- 5.2.3. Animal Feed
- 5.2.4. Other End-user Industries
- 5.3. Market Analysis, Insights and Forecast - by Region
- 5.3.1. Asia Pacific
- 5.3.2. North America
- 5.3.3. Europe
- 5.3.4. South America
- 5.3.5. Middle East and Africa
- 5.1. Market Analysis, Insights and Forecast - by Type
- 6. Global Methionine Industry Analysis, Insights and Forecast, 2021-2033
- 6.1. Market Analysis, Insights and Forecast - by Type
- 6.1.1. Liquid
- 6.1.2. Powder
- 6.2. Market Analysis, Insights and Forecast - by End-user Industry
- 6.2.1. Food and Beverage
- 6.2.2. Pharmaceutical
- 6.2.3. Animal Feed
- 6.2.4. Other End-user Industries
- 6.1. Market Analysis, Insights and Forecast - by Type
- 7. Asia Pacific Methionine Industry Analysis, Insights and Forecast, 2020-2032
- 7.1. Market Analysis, Insights and Forecast - by Type
- 7.1.1. Liquid
- 7.1.2. Powder
- 7.2. Market Analysis, Insights and Forecast - by End-user Industry
- 7.2.1. Food and Beverage
- 7.2.2. Pharmaceutical
- 7.2.3. Animal Feed
- 7.2.4. Other End-user Industries
- 7.1. Market Analysis, Insights and Forecast - by Type
- 8. North America Methionine Industry Analysis, Insights and Forecast, 2020-2032
- 8.1. Market Analysis, Insights and Forecast - by Type
- 8.1.1. Liquid
- 8.1.2. Powder
- 8.2. Market Analysis, Insights and Forecast - by End-user Industry
- 8.2.1. Food and Beverage
- 8.2.2. Pharmaceutical
- 8.2.3. Animal Feed
- 8.2.4. Other End-user Industries
- 8.1. Market Analysis, Insights and Forecast - by Type
- 9. Europe Methionine Industry Analysis, Insights and Forecast, 2020-2032
- 9.1. Market Analysis, Insights and Forecast - by Type
- 9.1.1. Liquid
- 9.1.2. Powder
- 9.2. Market Analysis, Insights and Forecast - by End-user Industry
- 9.2.1. Food and Beverage
- 9.2.2. Pharmaceutical
- 9.2.3. Animal Feed
- 9.2.4. Other End-user Industries
- 9.1. Market Analysis, Insights and Forecast - by Type
- 10. South America Methionine Industry Analysis, Insights and Forecast, 2020-2032
- 10.1. Market Analysis, Insights and Forecast - by Type
- 10.1.1. Liquid
- 10.1.2. Powder
- 10.2. Market Analysis, Insights and Forecast - by End-user Industry
- 10.2.1. Food and Beverage
- 10.2.2. Pharmaceutical
- 10.2.3. Animal Feed
- 10.2.4. Other End-user Industries
- 10.1. Market Analysis, Insights and Forecast - by Type
- 11. Middle East and Africa Methionine Industry Analysis, Insights and Forecast, 2020-2032
- 11.1. Market Analysis, Insights and Forecast - by Type
- 11.1.1. Liquid
- 11.1.2. Powder
- 11.2. Market Analysis, Insights and Forecast - by End-user Industry
- 11.2.1. Food and Beverage
- 11.2.2. Pharmaceutical
- 11.2.3. Animal Feed
- 11.2.4. Other End-user Industries
- 11.1. Market Analysis, Insights and Forecast - by Type
- 12. Competitive Analysis
- 12.1. Company Profiles
- 12.1.1 Sumitomo Chemical Co Ltd
- 12.1.1.1. Company Overview
- 12.1.1.2. Products
- 12.1.1.3. Company Financials
- 12.1.1.4. SWOT Analysis
- 12.1.2 Evonik Industries AG
- 12.1.2.1. Company Overview
- 12.1.2.2. Products
- 12.1.2.3. Company Financials
- 12.1.2.4. SWOT Analysis
- 12.1.3 NOVUS INTERNATIONAL
- 12.1.3.1. Company Overview
- 12.1.3.2. Products
- 12.1.3.3. Company Financials
- 12.1.3.4. SWOT Analysis
- 12.1.4 Chongqing Unisplendour Chemical Co Ltd
- 12.1.4.1. Company Overview
- 12.1.4.2. Products
- 12.1.4.3. Company Financials
- 12.1.4.4. SWOT Analysis
- 12.1.5 Adisseo
- 12.1.5.1. Company Overview
- 12.1.5.2. Products
- 12.1.5.3. Company Financials
- 12.1.5.4. SWOT Analysis
- 12.1.6 Volzhsky Orgsynthese JSC
- 12.1.6.1. Company Overview
- 12.1.6.2. Products
- 12.1.6.3. Company Financials
- 12.1.6.4. SWOT Analysis
- 12.1.7 Zhejiang NHU Co Ltd*List Not Exhaustive
- 12.1.7.1. Company Overview
- 12.1.7.2. Products
- 12.1.7.3. Company Financials
- 12.1.7.4. SWOT Analysis
- 12.1.8 CJ CheilJedang Corp
- 12.1.8.1. Company Overview
- 12.1.8.2. Products
- 12.1.8.3. Company Financials
- 12.1.8.4. SWOT Analysis
- 12.1.1 Sumitomo Chemical Co Ltd
- 12.2. Market Entropy
- 12.2.1 Company's Key Areas Served
- 12.2.2 Recent Developments
- 12.3. Company Market Share Analysis 2025
- 12.3.1 Top 5 Companies Market Share Analysis
- 12.3.2 Top 3 Companies Market Share Analysis
- 12.4. List of Potential Customers
- 13. Research Methodology
List of Figures
- Figure 1: Global Methionine Industry Revenue Breakdown (million, %) by Region 2025 & 2033
- Figure 2: Asia Pacific Methionine Industry Revenue (million), by Type 2025 & 2033
- Figure 3: Asia Pacific Methionine Industry Revenue Share (%), by Type 2025 & 2033
- Figure 4: Asia Pacific Methionine Industry Revenue (million), by End-user Industry 2025 & 2033
- Figure 5: Asia Pacific Methionine Industry Revenue Share (%), by End-user Industry 2025 & 2033
- Figure 6: Asia Pacific Methionine Industry Revenue (million), by Country 2025 & 2033
- Figure 7: Asia Pacific Methionine Industry Revenue Share (%), by Country 2025 & 2033
- Figure 8: North America Methionine Industry Revenue (million), by Type 2025 & 2033
- Figure 9: North America Methionine Industry Revenue Share (%), by Type 2025 & 2033
- Figure 10: North America Methionine Industry Revenue (million), by End-user Industry 2025 & 2033
- Figure 11: North America Methionine Industry Revenue Share (%), by End-user Industry 2025 & 2033
- Figure 12: North America Methionine Industry Revenue (million), by Country 2025 & 2033
- Figure 13: North America Methionine Industry Revenue Share (%), by Country 2025 & 2033
- Figure 14: Europe Methionine Industry Revenue (million), by Type 2025 & 2033
- Figure 15: Europe Methionine Industry Revenue Share (%), by Type 2025 & 2033
- Figure 16: Europe Methionine Industry Revenue (million), by End-user Industry 2025 & 2033
- Figure 17: Europe Methionine Industry Revenue Share (%), by End-user Industry 2025 & 2033
- Figure 18: Europe Methionine Industry Revenue (million), by Country 2025 & 2033
- Figure 19: Europe Methionine Industry Revenue Share (%), by Country 2025 & 2033
- Figure 20: South America Methionine Industry Revenue (million), by Type 2025 & 2033
- Figure 21: South America Methionine Industry Revenue Share (%), by Type 2025 & 2033
- Figure 22: South America Methionine Industry Revenue (million), by End-user Industry 2025 & 2033
- Figure 23: South America Methionine Industry Revenue Share (%), by End-user Industry 2025 & 2033
- Figure 24: South America Methionine Industry Revenue (million), by Country 2025 & 2033
- Figure 25: South America Methionine Industry Revenue Share (%), by Country 2025 & 2033
- Figure 26: Middle East and Africa Methionine Industry Revenue (million), by Type 2025 & 2033
- Figure 27: Middle East and Africa Methionine Industry Revenue Share (%), by Type 2025 & 2033
- Figure 28: Middle East and Africa Methionine Industry Revenue (million), by End-user Industry 2025 & 2033
- Figure 29: Middle East and Africa Methionine Industry Revenue Share (%), by End-user Industry 2025 & 2033
- Figure 30: Middle East and Africa Methionine Industry Revenue (million), by Country 2025 & 2033
- Figure 31: Middle East and Africa Methionine Industry Revenue Share (%), by Country 2025 & 2033
List of Tables
- Table 1: Global Methionine Industry Revenue million Forecast, by Type 2020 & 2033
- Table 2: Global Methionine Industry Revenue million Forecast, by End-user Industry 2020 & 2033
- Table 3: Global Methionine Industry Revenue million Forecast, by Region 2020 & 2033
- Table 4: Global Methionine Industry Revenue million Forecast, by Type 2020 & 2033
- Table 5: Global Methionine Industry Revenue million Forecast, by End-user Industry 2020 & 2033
- Table 6: Global Methionine Industry Revenue million Forecast, by Country 2020 & 2033
- Table 7: China Methionine Industry Revenue (million) Forecast, by Application 2020 & 2033
- Table 8: India Methionine Industry Revenue (million) Forecast, by Application 2020 & 2033
- Table 9: Japan Methionine Industry Revenue (million) Forecast, by Application 2020 & 2033
- Table 10: South Korea Methionine Industry Revenue (million) Forecast, by Application 2020 & 2033
- Table 11: Rest of Asia Pacific Methionine Industry Revenue (million) Forecast, by Application 2020 & 2033
- Table 12: Global Methionine Industry Revenue million Forecast, by Type 2020 & 2033
- Table 13: Global Methionine Industry Revenue million Forecast, by End-user Industry 2020 & 2033
- Table 14: Global Methionine Industry Revenue million Forecast, by Country 2020 & 2033
- Table 15: United States Methionine Industry Revenue (million) Forecast, by Application 2020 & 2033
- Table 16: Canada Methionine Industry Revenue (million) Forecast, by Application 2020 & 2033
- Table 17: Mexico Methionine Industry Revenue (million) Forecast, by Application 2020 & 2033
- Table 18: Global Methionine Industry Revenue million Forecast, by Type 2020 & 2033
- Table 19: Global Methionine Industry Revenue million Forecast, by End-user Industry 2020 & 2033
- Table 20: Global Methionine Industry Revenue million Forecast, by Country 2020 & 2033
- Table 21: Germany Methionine Industry Revenue (million) Forecast, by Application 2020 & 2033
- Table 22: United Kingdom Methionine Industry Revenue (million) Forecast, by Application 2020 & 2033
- Table 23: Italy Methionine Industry Revenue (million) Forecast, by Application 2020 & 2033
- Table 24: France Methionine Industry Revenue (million) Forecast, by Application 2020 & 2033
- Table 25: Rest of Europe Methionine Industry Revenue (million) Forecast, by Application 2020 & 2033
- Table 26: Global Methionine Industry Revenue million Forecast, by Type 2020 & 2033
- Table 27: Global Methionine Industry Revenue million Forecast, by End-user Industry 2020 & 2033
- Table 28: Global Methionine Industry Revenue million Forecast, by Country 2020 & 2033
- Table 29: Brazil Methionine Industry Revenue (million) Forecast, by Application 2020 & 2033
- Table 30: Argentina Methionine Industry Revenue (million) Forecast, by Application 2020 & 2033
- Table 31: Rest of South America Methionine Industry Revenue (million) Forecast, by Application 2020 & 2033
- Table 32: Global Methionine Industry Revenue million Forecast, by Type 2020 & 2033
- Table 33: Global Methionine Industry Revenue million Forecast, by End-user Industry 2020 & 2033
- Table 34: Global Methionine Industry Revenue million Forecast, by Country 2020 & 2033
- Table 35: Saudi Arabia Methionine Industry Revenue (million) Forecast, by Application 2020 & 2033
- Table 36: South Africa Methionine Industry Revenue (million) Forecast, by Application 2020 & 2033
- Table 37: Rest of Middle East and Africa Methionine Industry Revenue (million) Forecast, by Application 2020 & 2033
Frequently Asked Questions
1. What is the projected Compound Annual Growth Rate (CAGR) of the Methionine Industry?
The projected CAGR is approximately 4.3%.
2. Which companies are prominent players in the Methionine Industry?
Key companies in the market include Sumitomo Chemical Co Ltd, Evonik Industries AG, NOVUS INTERNATIONAL, Chongqing Unisplendour Chemical Co Ltd, Adisseo, Volzhsky Orgsynthese JSC, Zhejiang NHU Co Ltd*List Not Exhaustive, CJ CheilJedang Corp.
3. What are the main segments of the Methionine Industry?
The market segments include Type, End-user Industry.
4. Can you provide details about the market size?
The market size is estimated to be USD 6310 million as of 2022.
5. What are some drivers contributing to market growth?
Growing Demand from the Poultry Industry; Emerging Demand from the Aquaculture Industry.
6. What are the notable trends driving market growth?
Increasing Demand from the Animal Feed Segment.
7. Are there any restraints impacting market growth?
Complex Process of Manufacturing Methionine.
8. Can you provide examples of recent developments in the market?
September 2022: Adisseo started liquid methionine production through its 180,000-ton new plant in Nanjing, China. The company has doubled its methionine capacity to 350,000 tons through its operational new plant consolidating its leading position in the world.
9. What pricing options are available for accessing the report?
Pricing options include single-user, multi-user, and enterprise licenses priced at USD 4750, USD 5250, and USD 8750 respectively.
10. Is the market size provided in terms of value or volume?
The market size is provided in terms of value, measured in million.
11. Are there any specific market keywords associated with the report?
Yes, the market keyword associated with the report is "Methionine Industry," which aids in identifying and referencing the specific market segment covered.
12. How do I determine which pricing option suits my needs best?
The pricing options vary based on user requirements and access needs. Individual users may opt for single-user licenses, while businesses requiring broader access may choose multi-user or enterprise licenses for cost-effective access to the report.
13. Are there any additional resources or data provided in the Methionine Industry report?
While the report offers comprehensive insights, it's advisable to review the specific contents or supplementary materials provided to ascertain if additional resources or data are available.
14. How can I stay updated on further developments or reports in the Methionine Industry?
To stay informed about further developments, trends, and reports in the Methionine Industry, consider subscribing to industry newsletters, following relevant companies and organizations, or regularly checking reputable industry news sources and publications.
Methodology
Step 1 - Identification of Relevant Samples Size from Population Database


Step 2 - Approaches for Defining Global Market Size (Value, Volume* & Price*)

Note*: In applicable scenarios
Step 3 - Data Sources
Primary Research
- Web Analytics
- Survey Reports
- Research Institute
- Latest Research Reports
- Opinion Leaders
Secondary Research
- Annual Reports
- White Paper
- Latest Press Release
- Industry Association
- Paid Database
- Investor Presentations

Step 4 - Data Triangulation
Involves using different sources of information in order to increase the validity of a study
These sources are likely to be stakeholders in a program - participants, other researchers, program staff, other community members, and so on.
Then we put all data in single framework & apply various statistical tools to find out the dynamic on the market.
During the analysis stage, feedback from the stakeholder groups would be compared to determine areas of agreement as well as areas of divergence