

Key Insights
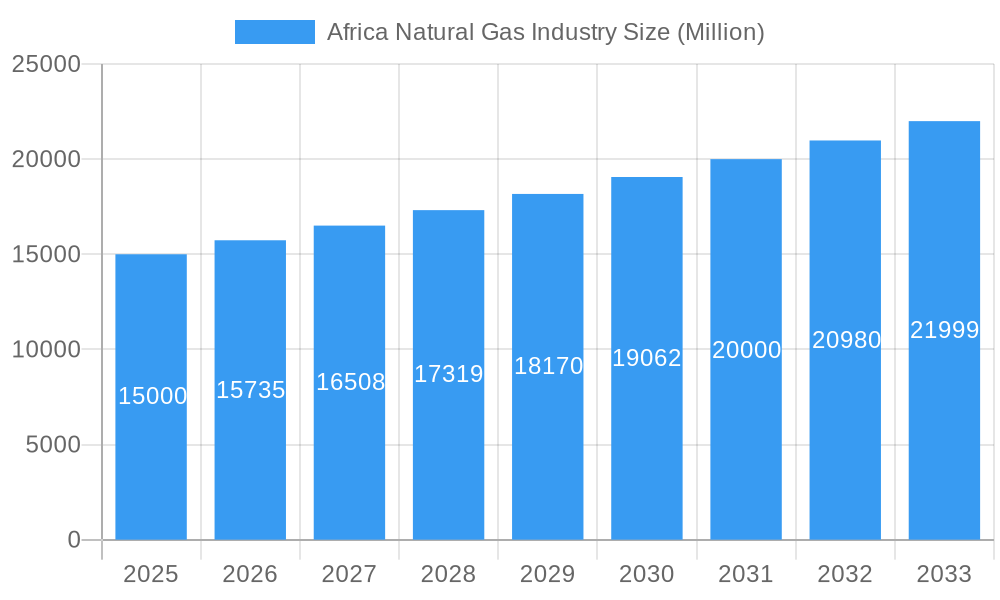
The African natural gas industry is experiencing robust growth, projected to maintain a Compound Annual Growth Rate (CAGR) exceeding 4.5% from 2025 to 2033. This expansion is fueled by several key drivers. Firstly, increasing electricity demand across the continent, particularly in rapidly urbanizing areas, necessitates a reliable and relatively affordable energy source. Natural gas is well-positioned to fill this gap, offering a cleaner alternative to traditional fuels like coal and heavy fuel oil for power generation. Secondly, industrialization across various sectors, including manufacturing and petrochemicals, significantly boosts the demand for natural gas as a feedstock and energy source. Furthermore, governmental initiatives promoting gas infrastructure development and attracting foreign investment are stimulating market growth. Significant investment in pipelines, liquefied natural gas (LNG) terminals, and processing facilities is attracting global players, further accelerating industry expansion. South Africa, Sudan, Uganda, Tanzania, and Kenya represent key regional hubs, but growth is also expected across other regions of Africa.
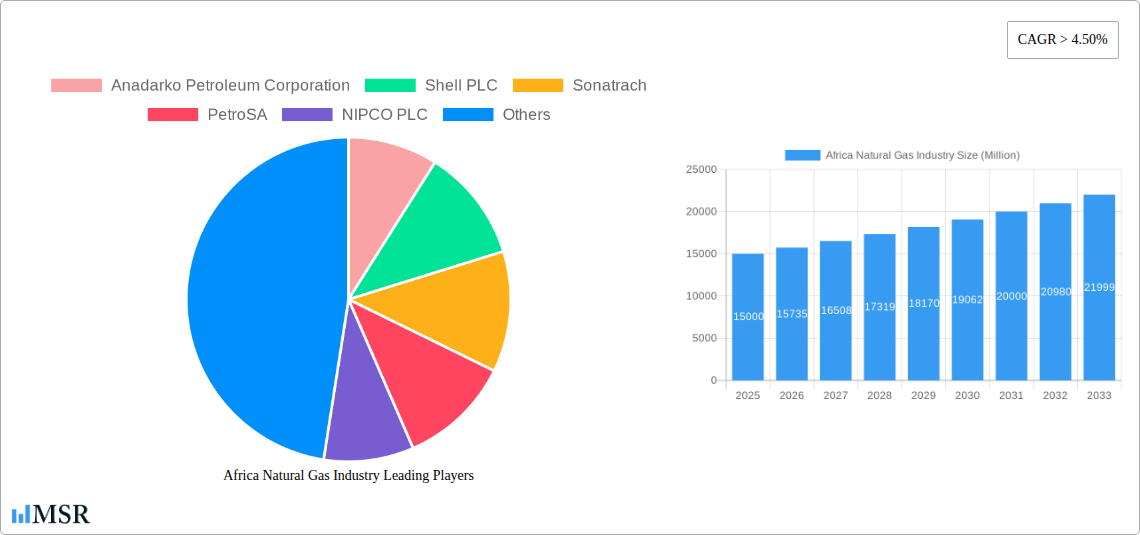
Africa Natural Gas Industry Market Size (In Billion)
However, the market faces certain challenges. Limited infrastructure in several regions remains a significant constraint, hindering efficient gas transportation and distribution. Political instability and regulatory uncertainties in some African countries also pose risks to investment and project implementation. Addressing these infrastructure gaps and fostering a stable regulatory environment will be crucial for unlocking the full potential of the African natural gas market. Segmentation analysis reveals that the power generation sector dominates the end-user segment, followed by the industrial sector. Large companies, with access to capital and expertise, currently hold a major share of the market, but opportunities exist for medium and small companies to participate in the value chain, particularly in downstream activities. By leveraging its vast reserves, Africa has the potential to become a major player in the global natural gas market, provided that these constraints are effectively tackled.
Africa Natural Gas Industry Company Market Share
Africa Natural Gas Industry: A Comprehensive Market Report (2019-2033)
This comprehensive report delivers an in-depth analysis of the dynamic Africa natural gas industry, providing crucial insights for stakeholders, investors, and industry professionals. Covering the period 2019-2033, with a focus on 2025, this report meticulously examines market concentration, growth drivers, key segments, challenges, and emerging opportunities across North Africa, West Africa, Central Africa, East Africa, and Southern Africa. Benefit from actionable data, forecasts, and expert analysis to navigate the complexities of this rapidly evolving market.
Africa Natural Gas Industry Market Concentration & Dynamics
This section assesses the competitive landscape of the African natural gas market, analyzing market concentration, innovation, regulation, substitute products, end-user trends, and mergers & acquisitions (M&A) activity.
The African natural gas market exhibits a moderate level of concentration, with several large players holding significant market share. However, the presence of numerous smaller, independent producers and distributors contributes to a dynamic and competitive environment.
Market Share: Large companies like Shell PLC, TotalEnergies SE, and Eni SpA command significant shares, estimated at xx% collectively in 2025. However, smaller players, particularly in regional markets, contribute a substantial overall volume.
M&A Activity: The historical period (2019-2024) witnessed xx M&A deals, primarily driven by consolidation efforts and expansion into new geographical areas. This activity is expected to continue, albeit at a potentially slower pace, in the forecast period (2025-2033).
Innovation Ecosystems: Innovation is emerging, driven by advancements in exploration and production techniques, alongside efforts to improve gas infrastructure and enhance gas-to-power initiatives.
Regulatory Frameworks: Regulatory inconsistencies and complexities across different African nations pose challenges, creating uncertainty for investors and hindering the development of unified market practices.
Substitute Products: The increasing competitiveness from renewable energy sources like solar and wind represents a potential threat to natural gas market growth. However, natural gas is still likely to play a significant role in providing baseload power, particularly in regions lacking robust renewable energy infrastructure.
End-User Trends: The power generation sector remains the dominant consumer, closely followed by the industrial sector. Residential consumption is projected to increase in the coming years, with increasing urbanization and improving living standards.
Africa Natural Gas Industry Industry Insights & Trends
The African natural gas industry is experiencing substantial growth, driven by rising energy demand, increasing industrialization, and the development of new infrastructure projects. The market size reached an estimated $xx Million in 2025, exhibiting a Compound Annual Growth Rate (CAGR) of xx% during the historical period (2019-2024). This growth is expected to continue at a CAGR of xx% during the forecast period (2025-2033), reaching $xx Million by 2033.
Several key factors are driving this growth, including increasing investment in exploration and production, coupled with the development of new gas pipelines to enhance connectivity and access to international markets. Furthermore, the increasing demand for cleaner energy sources, and gas's role in providing a transition fuel to renewable resources, also plays a significant part. The ongoing technological advancements in exploration techniques, and pipeline technology, along with improvements in efficiency and cost reductions are also contributing factors. However, challenges such as political instability, infrastructure limitations and regulatory uncertainties in some regions still pose significant risks to market growth. Consumer behavior is evolving towards a preference for more reliable and affordable energy sources, leading to increased demand for natural gas across various sectors.
Key Markets & Segments Leading Africa Natural Gas Industry
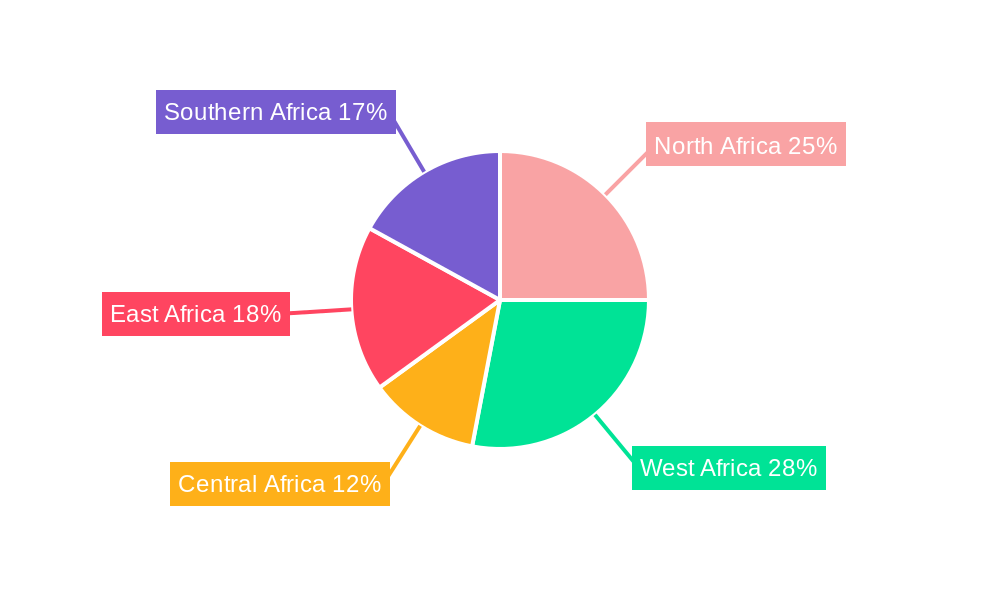
The African natural gas industry is experiencing dynamic shifts, with North Africa maintaining its leadership role, predominantly fueled by Algeria's extensive reserves and robust production capabilities. Concurrently, West Africa is emerging as a hotbed of rapid expansion, spurred by significant new discoveries and substantial investments in critical gas infrastructure projects. This evolving landscape highlights both established strengths and burgeoning opportunities across the continent.
-
Geographic Dynamics:
- North Africa: Continues to dominate due to its high production volumes and well-established infrastructure. This leadership is underpinned by vast reserves, existing export pipelines facilitating international trade, and supportive governmental policies that foster investment and operational efficiency.
- West Africa: Demonstrating remarkable growth, driven by recent, substantial gas discoveries and the aggressive expansion of pipeline infrastructure. A notable example is the highly anticipated Nigeria-Morocco gas pipeline, poised to revolutionize regional energy connectivity and potentially extend to European markets.
- Emerging Regions (Central, East, and Southern Africa): While currently exhibiting lower production levels, these regions possess immense untapped potential. Future growth hinges on strategic infrastructure development, successful exploration initiatives, and favorable investment climates.
-
Key End-User Segments:
- Power Generation: Remains the largest and most critical end-user segment. Demand is projected to climb significantly as African nations prioritize the development of stable and reliable power grids, with natural gas playing a pivotal role in achieving energy security.
- Industrial Applications: Industrial consumers represent a powerful growth engine. Their substantial energy requirements across diverse sectors like manufacturing, mining, and petrochemicals make them a cornerstone of natural gas consumption and a key indicator of economic activity.
- Residential Consumption: This segment shows steady, moderate growth, closely linked to ongoing urbanization trends and the expanding accessibility of gas networks to households, improving living standards and energy access.
-
Company Landscape:
- Major International and National Oil Companies: These industry giants leverage their considerable financial strength, extensive technical expertise, and global operational reach to drive large-scale projects and secure significant market share.
- Independent and Smaller Enterprises: Medium and small-sized companies are vital players, carving out niche markets, contributing specialized services, and fostering local content development, thereby playing an indispensable role in the overall vibrancy and expansion of the industry.
Africa Natural Gas Industry Product Developments
Product innovation focuses on enhancing gas extraction and processing efficiency, maximizing gas recovery from reservoirs, and developing cleaner gas technologies to minimize environmental impact. The focus is on improving pipeline technologies for efficient, secure and reliable transportation.
Challenges in the Africa Natural Gas Industry Market
The African natural gas market is navigating a complex set of hurdles that influence its trajectory. A primary concern is the inadequate and often underdeveloped infrastructure, particularly across sub-Saharan Africa, which limits the efficient transportation and distribution of gas. Regulatory uncertainty in various jurisdictions can deter much-needed investment, while the substantial financial risks associated with large-scale infrastructure projects, such as deep-sea pipelines and processing facilities, present significant barriers to entry. The escalating competition from rapidly advancing renewable energy sources also demands strategic adaptation. Furthermore, prevailing security concerns in certain regions can disrupt exploration activities and impede the construction of vital pipeline networks, thereby capping the market's inherent potential.
Forces Driving Africa Natural Gas Industry Growth
Several potent forces are propelling the expansion of the African natural gas industry. A fundamental driver is the burgeoning energy demand stemming from a rapidly growing population and an increasingly industrialized continent, seeking to fuel economic progress. Significant investments in exploration and production activities are unlocking new reserves and enhancing output. The strategic development of new gas pipelines is crucial for enhancing intra-continental and international connectivity, facilitating trade and supply. Moreover, strong governmental support for gas-based power generation projects is a key catalyst, providing policy certainty and incentives. Advances in technology are also playing a vital role, leading to increased efficiency across the entire natural gas value chain, from extraction to end-use, thereby contributing to sustainable growth.
Long-Term Growth Catalysts in the Africa Natural Gas Industry Market
Long-term growth will be spurred by continued investment in infrastructure development, innovative technologies to enhance efficiency and reduce environmental impact, and strategic partnerships between international and local companies to foster the overall development of the African natural gas sector.
Emerging Opportunities in Africa Natural Gas Industry
Emerging opportunities lie in the development of gas-based power plants to meet rising energy demand, the expansion of gas infrastructure into underserved regions, the exploration of new gas fields and the growing market for liquefied natural gas (LNG) exports to international markets.
Leading Players in the Africa Natural Gas Industry Sector
- Anadarko Petroleum Corporation
- Shell PLC
- Sonatrach
- PetroSA
- NIPCO PLC
- TotalEnergies SE
- Egyptian Natural Gas Holding Company
- Eni SpA
- Nigerian National Petroleum Corporation
- Chevron Corporation
Key Milestones in Africa Natural Gas Industry Industry
- September 2022: The Nigerian National Petroleum Company Limited (NNPCL) signed a Memorandum of Understanding (MoU) for the ambitious 7,000-kilometre Nigeria-Morocco gas pipeline project. This landmark agreement aims to transport up to 3 billion standard cubic feet of gas daily, with potential significant supply to European markets.
- May 2022: Algerian state energy giant Sonatrach and Italian multinational Eni solidified their partnership by signing an MoU focused on accelerating the development of Algerian gas fields. This collaboration targets an increase in annual gas exports by approximately 3 billion cubic meters, primarily channeled through the existing Transmed pipeline.
Strategic Outlook for Africa Natural Gas Industry Market
The African natural gas market is poised for substantial future growth, underpinned by the persistent rise in energy demand, a continuous influx of investment in exploration and infrastructure development, and the cultivation of strategic collaborations designed to foster an enabling environment. Nevertheless, the proactive management of risks, particularly those related to infrastructure deficits and regional security, is paramount to unlocking the market's full, transformative potential. The long-term outlook for the industry remains decidedly positive, contingent upon the implementation of effective and forward-thinking policy frameworks, alongside a steadfast commitment to sustainable development practices that balance economic advancement with environmental stewardship.
Africa Natural Gas Industry Segmentation
-
1. Geography
- 1.1. Nigeria
- 1.2. Algeria
- 1.3. Egypt
- 1.4. South Africa
- 1.5. Rest of Africa
Africa Natural Gas Industry Segmentation By Geography
- 1. Nigeria
- 2. Algeria
- 3. Egypt
- 4. South Africa
- 5. Rest of Africa
Africa Natural Gas Industry Regional Market Share
Geographic Coverage of Africa Natural Gas Industry
Africa Natural Gas Industry REPORT HIGHLIGHTS
| Aspects | Details |
|---|---|
| Study Period | 2020-2034 |
| Base Year | 2025 |
| Estimated Year | 2026 |
| Forecast Period | 2026-2034 |
| Historical Period | 2020-2025 |
| Growth Rate | CAGR of > 4.50% from 2020-2034 |
| Segmentation |
|
Table of Contents
- 1. Introduction
- 1.1. Research Scope
- 1.2. Market Segmentation
- 1.3. Research Objective
- 1.4. Definitions and Assumptions
- 2. Executive Summary
- 2.1. Market Snapshot
- 3. Market Dynamics
- 3.1. Market Drivers
- 3.2. Market Restrains
- 3.3. Market Trends
- 3.4. Market Opportunities
- 4. Market Factor Analysis
- 4.1. Porters Five Forces
- 4.1.1. Bargaining Power of Suppliers
- 4.1.2. Bargaining Power of Buyers
- 4.1.3. Threat of New Entrants
- 4.1.4. Threat of Substitutes
- 4.1.5. Competitive Rivalry
- 4.2. PESTEL analysis
- 4.3. BCG Analysis
- 4.3.1. Stars (High Growth, High Market Share)
- 4.3.2. Cash Cows (Low Growth, High Market Share)
- 4.3.3. Question Mark (High Growth, Low Market Share)
- 4.3.4. Dogs (Low Growth, Low Market Share)
- 4.4. Ansoff Matrix Analysis
- 4.5. Supply Chain Analysis
- 4.6. Regulatory Landscape
- 4.7. Current Market Potential and Opportunity Assessment (TAM–SAM–SOM Framework)
- 4.8. MSR Analyst Note
- 4.1. Porters Five Forces
- 5. Market Analysis, Insights and Forecast 2021-2033
- 5.1. Market Analysis, Insights and Forecast - by Geography
- 5.1.1. Nigeria
- 5.1.2. Algeria
- 5.1.3. Egypt
- 5.1.4. South Africa
- 5.1.5. Rest of Africa
- 5.2. Market Analysis, Insights and Forecast - by Region
- 5.2.1. Nigeria
- 5.2.2. Algeria
- 5.2.3. Egypt
- 5.2.4. South Africa
- 5.2.5. Rest of Africa
- 5.1. Market Analysis, Insights and Forecast - by Geography
- 6. Africa Natural Gas Industry Analysis, Insights and Forecast, 2021-2033
- 6.1. Market Analysis, Insights and Forecast - by Geography
- 6.1.1. Nigeria
- 6.1.2. Algeria
- 6.1.3. Egypt
- 6.1.4. South Africa
- 6.1.5. Rest of Africa
- 6.1. Market Analysis, Insights and Forecast - by Geography
- 7. Nigeria Africa Natural Gas Industry Analysis, Insights and Forecast, 2020-2032
- 7.1. Market Analysis, Insights and Forecast - by Geography
- 7.1.1. Nigeria
- 7.1.2. Algeria
- 7.1.3. Egypt
- 7.1.4. South Africa
- 7.1.5. Rest of Africa
- 7.1. Market Analysis, Insights and Forecast - by Geography
- 8. Algeria Africa Natural Gas Industry Analysis, Insights and Forecast, 2020-2032
- 8.1. Market Analysis, Insights and Forecast - by Geography
- 8.1.1. Nigeria
- 8.1.2. Algeria
- 8.1.3. Egypt
- 8.1.4. South Africa
- 8.1.5. Rest of Africa
- 8.1. Market Analysis, Insights and Forecast - by Geography
- 9. Egypt Africa Natural Gas Industry Analysis, Insights and Forecast, 2020-2032
- 9.1. Market Analysis, Insights and Forecast - by Geography
- 9.1.1. Nigeria
- 9.1.2. Algeria
- 9.1.3. Egypt
- 9.1.4. South Africa
- 9.1.5. Rest of Africa
- 9.1. Market Analysis, Insights and Forecast - by Geography
- 10. South Africa Africa Natural Gas Industry Analysis, Insights and Forecast, 2020-2032
- 10.1. Market Analysis, Insights and Forecast - by Geography
- 10.1.1. Nigeria
- 10.1.2. Algeria
- 10.1.3. Egypt
- 10.1.4. South Africa
- 10.1.5. Rest of Africa
- 10.1. Market Analysis, Insights and Forecast - by Geography
- 11. Rest of Africa Africa Natural Gas Industry Analysis, Insights and Forecast, 2020-2032
- 11.1. Market Analysis, Insights and Forecast - by Geography
- 11.1.1. Nigeria
- 11.1.2. Algeria
- 11.1.3. Egypt
- 11.1.4. South Africa
- 11.1.5. Rest of Africa
- 11.1. Market Analysis, Insights and Forecast - by Geography
- 12. Competitive Analysis
- 12.1. Company Profiles
- 12.1.1 Anadarko Petroleum Corporation
- 12.1.1.1. Company Overview
- 12.1.1.2. Products
- 12.1.1.3. Company Financials
- 12.1.1.4. SWOT Analysis
- 12.1.2 Shell PLC
- 12.1.2.1. Company Overview
- 12.1.2.2. Products
- 12.1.2.3. Company Financials
- 12.1.2.4. SWOT Analysis
- 12.1.3 Sonatrach
- 12.1.3.1. Company Overview
- 12.1.3.2. Products
- 12.1.3.3. Company Financials
- 12.1.3.4. SWOT Analysis
- 12.1.4 PetroSA
- 12.1.4.1. Company Overview
- 12.1.4.2. Products
- 12.1.4.3. Company Financials
- 12.1.4.4. SWOT Analysis
- 12.1.5 NIPCO PLC
- 12.1.5.1. Company Overview
- 12.1.5.2. Products
- 12.1.5.3. Company Financials
- 12.1.5.4. SWOT Analysis
- 12.1.6 TotalEnergies SE
- 12.1.6.1. Company Overview
- 12.1.6.2. Products
- 12.1.6.3. Company Financials
- 12.1.6.4. SWOT Analysis
- 12.1.7 Egyptian Natural Gas Holding Company
- 12.1.7.1. Company Overview
- 12.1.7.2. Products
- 12.1.7.3. Company Financials
- 12.1.7.4. SWOT Analysis
- 12.1.8 Eni SpA
- 12.1.8.1. Company Overview
- 12.1.8.2. Products
- 12.1.8.3. Company Financials
- 12.1.8.4. SWOT Analysis
- 12.1.9 Nigerian National Petroleum Corporation
- 12.1.9.1. Company Overview
- 12.1.9.2. Products
- 12.1.9.3. Company Financials
- 12.1.9.4. SWOT Analysis
- 12.1.10 Chevron Corporation
- 12.1.10.1. Company Overview
- 12.1.10.2. Products
- 12.1.10.3. Company Financials
- 12.1.10.4. SWOT Analysis
- 12.1.1 Anadarko Petroleum Corporation
- 12.2. Market Entropy
- 12.2.1 Company's Key Areas Served
- 12.2.2 Recent Developments
- 12.3. Company Market Share Analysis 2025
- 12.3.1 Top 5 Companies Market Share Analysis
- 12.3.2 Top 3 Companies Market Share Analysis
- 12.4. List of Potential Customers
- 13. Research Methodology
List of Figures
- Figure 1: Africa Natural Gas Industry Revenue Breakdown (Million, %) by Product 2025 & 2033
- Figure 2: Africa Natural Gas Industry Share (%) by Company 2025
List of Tables
- Table 1: Africa Natural Gas Industry Revenue Million Forecast, by Geography 2020 & 2033
- Table 2: Africa Natural Gas Industry Volume Tonnes Forecast, by Geography 2020 & 2033
- Table 3: Africa Natural Gas Industry Revenue Million Forecast, by Region 2020 & 2033
- Table 4: Africa Natural Gas Industry Volume Tonnes Forecast, by Region 2020 & 2033
- Table 5: Africa Natural Gas Industry Revenue Million Forecast, by Geography 2020 & 2033
- Table 6: Africa Natural Gas Industry Volume Tonnes Forecast, by Geography 2020 & 2033
- Table 7: Africa Natural Gas Industry Revenue Million Forecast, by Country 2020 & 2033
- Table 8: Africa Natural Gas Industry Volume Tonnes Forecast, by Country 2020 & 2033
- Table 9: Africa Natural Gas Industry Revenue Million Forecast, by Geography 2020 & 2033
- Table 10: Africa Natural Gas Industry Volume Tonnes Forecast, by Geography 2020 & 2033
- Table 11: Africa Natural Gas Industry Revenue Million Forecast, by Country 2020 & 2033
- Table 12: Africa Natural Gas Industry Volume Tonnes Forecast, by Country 2020 & 2033
- Table 13: Africa Natural Gas Industry Revenue Million Forecast, by Geography 2020 & 2033
- Table 14: Africa Natural Gas Industry Volume Tonnes Forecast, by Geography 2020 & 2033
- Table 15: Africa Natural Gas Industry Revenue Million Forecast, by Country 2020 & 2033
- Table 16: Africa Natural Gas Industry Volume Tonnes Forecast, by Country 2020 & 2033
- Table 17: Africa Natural Gas Industry Revenue Million Forecast, by Geography 2020 & 2033
- Table 18: Africa Natural Gas Industry Volume Tonnes Forecast, by Geography 2020 & 2033
- Table 19: Africa Natural Gas Industry Revenue Million Forecast, by Country 2020 & 2033
- Table 20: Africa Natural Gas Industry Volume Tonnes Forecast, by Country 2020 & 2033
- Table 21: Africa Natural Gas Industry Revenue Million Forecast, by Geography 2020 & 2033
- Table 22: Africa Natural Gas Industry Volume Tonnes Forecast, by Geography 2020 & 2033
- Table 23: Africa Natural Gas Industry Revenue Million Forecast, by Country 2020 & 2033
- Table 24: Africa Natural Gas Industry Volume Tonnes Forecast, by Country 2020 & 2033
Frequently Asked Questions
1. What is the projected Compound Annual Growth Rate (CAGR) of the Africa Natural Gas Industry?
The projected CAGR is approximately > 4.50%.
2. Which companies are prominent players in the Africa Natural Gas Industry?
Key companies in the market include Anadarko Petroleum Corporation, Shell PLC, Sonatrach, PetroSA, NIPCO PLC, TotalEnergies SE, Egyptian Natural Gas Holding Company, Eni SpA, Nigerian National Petroleum Corporation, Chevron Corporation.
3. What are the main segments of the Africa Natural Gas Industry?
The market segments include Geography.
4. Can you provide details about the market size?
The market size is estimated to be USD XX Million as of 2022.
5. What are some drivers contributing to market growth?
4.; Increasing Amount of Waste Generation. Growing Concern for Waste Management to Meet the Needs for Sustainable Urban Living4.; Increasing Focus on Non-fossil Fuel Sources of Energy.
6. What are the notable trends driving market growth?
Governments Moving Towards the Cleaner Energy Sources is Driving the Market.
7. Are there any restraints impacting market growth?
4.; Expensive Nature of Incinerators.
8. Can you provide examples of recent developments in the market?
In September 2022, The Nigerian National Petroleum Company Limited (NNPCL) announced its intention to sign a Memorandum of Understanding (MoU) on developing a gas pipeline with Morocco's National Office of Hydrocarbons and Mines and the commission of the Economic Community of West African States (ECOWAS). As a result of the MoU, the 7,000-kilometre Nigeria-Morocco gas pipeline project is expected to ramp up gas supply to Europe. Upon the project completion, 3 billion standard cubic feet of gas is expected to be supplied along the coast of West Africa from Nigeria, Benin, Togo, Ghana, Cote d'Ivoire, Liberia, Sierra Leone, Guinea, Guinea Bissau, Gambia, Senegal, Mauritania to Morocco.
9. What pricing options are available for accessing the report?
Pricing options include single-user, multi-user, and enterprise licenses priced at USD 4750, USD 5250, and USD 8750 respectively.
10. Is the market size provided in terms of value or volume?
The market size is provided in terms of value, measured in Million and volume, measured in Tonnes.
11. Are there any specific market keywords associated with the report?
Yes, the market keyword associated with the report is "Africa Natural Gas Industry," which aids in identifying and referencing the specific market segment covered.
12. How do I determine which pricing option suits my needs best?
The pricing options vary based on user requirements and access needs. Individual users may opt for single-user licenses, while businesses requiring broader access may choose multi-user or enterprise licenses for cost-effective access to the report.
13. Are there any additional resources or data provided in the Africa Natural Gas Industry report?
While the report offers comprehensive insights, it's advisable to review the specific contents or supplementary materials provided to ascertain if additional resources or data are available.
14. How can I stay updated on further developments or reports in the Africa Natural Gas Industry?
To stay informed about further developments, trends, and reports in the Africa Natural Gas Industry, consider subscribing to industry newsletters, following relevant companies and organizations, or regularly checking reputable industry news sources and publications.
Methodology
Step 1 - Identification of Relevant Samples Size from Population Database


Step 2 - Approaches for Defining Global Market Size (Value, Volume* & Price*)

Note*: In applicable scenarios
Step 3 - Data Sources
Primary Research
- Web Analytics
- Survey Reports
- Research Institute
- Latest Research Reports
- Opinion Leaders
Secondary Research
- Annual Reports
- White Paper
- Latest Press Release
- Industry Association
- Paid Database
- Investor Presentations

Step 4 - Data Triangulation
Involves using different sources of information in order to increase the validity of a study
These sources are likely to be stakeholders in a program - participants, other researchers, program staff, other community members, and so on.
Then we put all data in single framework & apply various statistical tools to find out the dynamic on the market.
During the analysis stage, feedback from the stakeholder groups would be compared to determine areas of agreement as well as areas of divergence