

Key Insights
The Air Pollution Control System (APCS) market is poised for significant expansion, propelled by stringent global environmental mandates and escalating industrialization, especially in emerging economies. With a projected market size of $103.66 billion in the base year of 2025, the market is anticipated to achieve a Compound Annual Growth Rate (CAGR) of 6.3% from 2025 to 2033. Key growth catalysts include the increasing demand for air quality improvement, supportive government policies promoting sustainable industrial practices, and the expanding operational capacities within the power generation, cement, iron & steel, and chemical sectors. Innovations in APCS technologies, such as electrostatic precipitators (ESPs), flue gas desulfurization (FGD) systems, and selective catalytic reduction (SCR), are further accelerating market penetration. The power generation sector leads APCS adoption, while the cement, iron & steel, and chemical industries are emerging as substantial contributors, diversifying market applications. Geographically, the Asia Pacific region is expected to lead growth due to rapid industrial development and heightened environmental consciousness. Mature markets in North America and Europe will continue to represent significant demand driven by rigorous regulations and infrastructure modernization efforts.
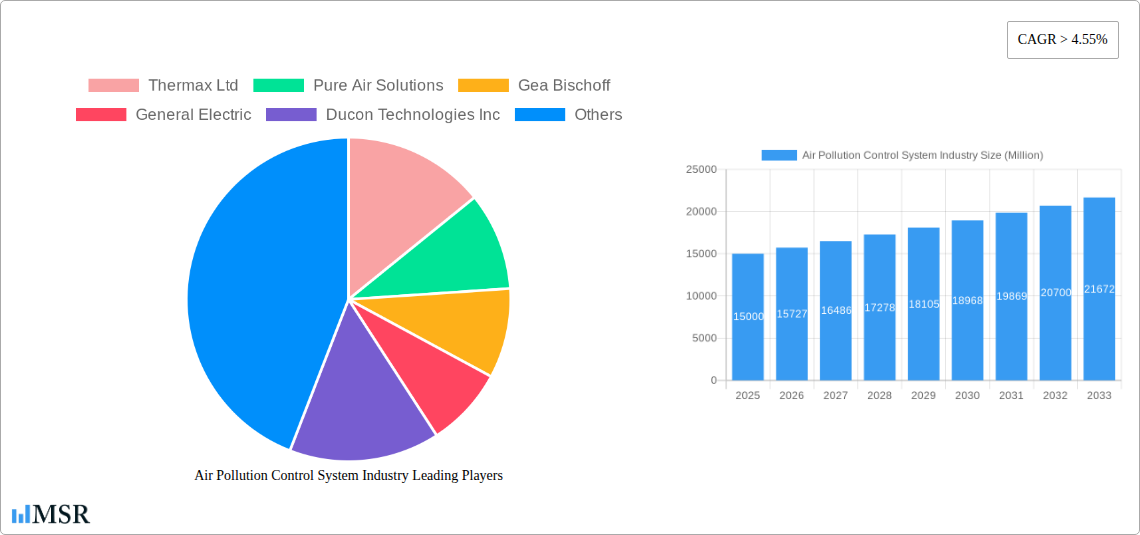
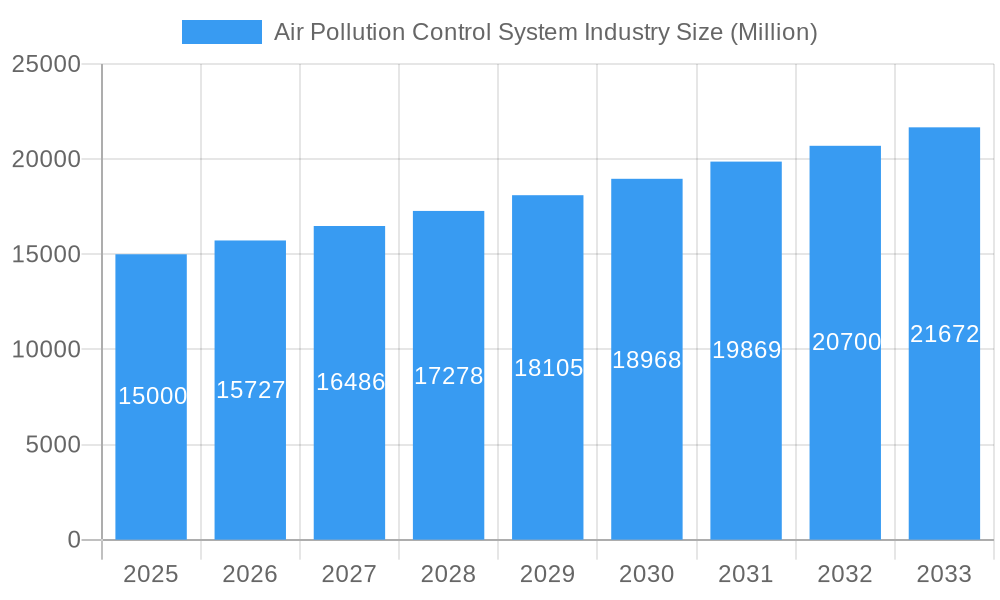
Air Pollution Control System Industry Market Size (In Billion)
While the APCS market demonstrates a robust growth outlook, certain obstacles persist. High upfront capital investment for system implementation can pose a barrier, particularly for small and medium-sized enterprises (SMEs) in developing regions. Additionally, ongoing operational and maintenance expenditures represent a considerable factor. Nevertheless, technological advancements focused on enhancing energy efficiency and reducing maintenance needs are expected to alleviate these concerns. The competitive environment is dynamic, featuring established multinational corporations alongside agile regional providers, fostering innovation and increasing market accessibility. Future market dynamics will be shaped by the continuous evolution of environmental regulations, pioneering technological advancements, and the sustained growth of pivotal industrial sectors.
Air Pollution Control System Industry Company Market Share
Air Pollution Control System Industry Market Report: 2019-2033
This comprehensive report provides an in-depth analysis of the Air Pollution Control System (APCS) industry, offering invaluable insights for stakeholders, investors, and industry professionals. With a study period spanning 2019-2033, a base year of 2025, and a forecast period of 2025-2033, this report delivers actionable intelligence on market dynamics, key segments, leading players, and future growth potential. The global market size is projected to reach xx Million by 2033, exhibiting a CAGR of xx% during the forecast period.
Air Pollution Control System Industry Market Concentration & Dynamics
The Air Pollution Control System (APCS) industry exhibits a moderately concentrated market structure, with several multinational corporations holding significant market share. Key players such as Thermax Ltd, General Electric, and Siemens AG compete intensely, driving innovation and shaping market dynamics. The market share of the top 5 players is estimated at xx%, indicating room for smaller players to gain traction. Innovation is fueled by stringent environmental regulations, particularly in developed economies, and technological advancements like AI-powered monitoring and predictive maintenance.
The regulatory landscape significantly influences industry growth, with ever-tightening emission standards pushing demand for advanced APCS technologies. Substitute products, while limited, include natural gas-based power generation, however the efficiency and economic viability of these options are often outweighed by APCS solutions. End-user trends reflect increasing adoption of sustainable practices and heightened environmental awareness. Mergers and acquisitions (M&A) activity in the APCS sector has been relatively stable in recent years, with approximately xx M&A deals recorded between 2019 and 2024. This activity is driven by strategic expansion plans, technological integration, and access to new markets.
- Market Share (Top 5 Players): xx% (2025)
- M&A Deal Count (2019-2024): xx
- Key Regulatory Drivers: Stringent emission standards in North America, Europe, and Asia.
Air Pollution Control System Industry Insights & Trends
The global Air Pollution Control Systems market is experiencing robust growth, driven by burgeoning industrialization, stricter environmental regulations globally, and a growing awareness of the detrimental effects of air pollution on public health. The market size was valued at approximately xx Million in 2025 and is projected to reach xx Million by 2033, exhibiting a significant Compound Annual Growth Rate (CAGR). Technological disruptions, such as the incorporation of Artificial Intelligence (AI) and the Internet of Things (IoT) in APCS systems for enhanced monitoring and predictive maintenance, are further boosting market growth. Evolving consumer behaviors, marked by increasing demand for eco-friendly solutions and transparency in industrial practices, are placing immense pressure on industries to adopt advanced APCS technologies. Furthermore, government incentives and subsidies to promote sustainable industrial practices are playing a key role in expanding market growth. The market’s expansion is largely fueled by the power generation, cement, and iron & steel industries, which are being compelled to upgrade their pollution control facilities to comply with environmental guidelines.
Key Markets & Segments Leading Air Pollution Control System Industry
The Asia-Pacific region is currently the dominant market for APCS, driven by rapid industrialization and expanding infrastructure development in countries like China and India. Within the APCS sector, Electrostatic Precipitators (ESP) and Fabric Filters currently hold the largest market share, driven by their wide applicability across various industries and relatively cost-effectiveness. However, the demand for Selective Catalytic Reduction (SCR) systems is growing rapidly, primarily due to their efficacy in removing nitrogen oxides (NOx) emissions.
- Dominant Region: Asia-Pacific
- Dominant Type Segment: Electrostatic Precipitators (ESP), Fabric Filters
- Fastest-Growing Type Segment: Selective Catalytic Reduction (SCR)
- Key Application Drivers:
- Power Generation: Stringent emission norms and aging power plants requiring upgrades.
- Cement Industry: Growing cement production and emphasis on environmental compliance.
- Iron & Steel Industry: High emission levels and increasing environmental consciousness.
- Chemical Industry: Stringent regulatory frameworks and diverse emission types.
Air Pollution Control System Industry Product Developments
Recent product innovations in the APCS industry include the development of more efficient and compact systems, integrating advanced monitoring technologies, incorporating AI and machine learning for predictive maintenance, and the development of hybrid systems combining different technologies for enhanced performance. These advancements improve the efficacy, reliability, and cost-effectiveness of APCS solutions, enhancing their market relevance and driving adoption among industries. Companies are also focusing on developing specialized solutions tailored to specific industry needs, adding a competitive edge in the market.
Challenges in the Air Pollution Control System Industry Market
The APCS industry faces challenges such as high initial investment costs, stringent regulatory hurdles varying across geographies, and supply chain disruptions impacting the availability of raw materials and components. These factors, coupled with intense competition and the need for specialized expertise in operation and maintenance, can constrain market growth. Specifically, fluctuating raw material prices and potential trade restrictions pose significant uncertainties in manufacturing costs. The cumulative effect of these factors could result in an estimated xx% reduction in market growth over the next five years.
Forces Driving Air Pollution Control System Industry Growth
Key growth drivers for the APCS industry include:
- Stringent Environmental Regulations: Globally increasing emphasis on reducing air pollution leads to stricter emission standards.
- Technological Advancements: The development of more efficient and cost-effective technologies increases adoption rates.
- Industrial Growth: Expansion of industries such as power generation, cement, and steel drives demand for APCS solutions.
- Government Incentives: Policies supporting clean technologies and renewable energy sources fuel market expansion.
Long-Term Growth Catalysts in the Air Pollution Control System Industry
Long-term growth is fueled by continuous innovation in system design and functionality, strategic partnerships between technology providers and end-users, and expansions into emerging markets with lax environmental regulations that are gradually being tightened. This includes collaborations focused on developing customized, integrated solutions that address the unique challenges of various industries. Furthermore, the growing adoption of circular economy principles is also opening up new opportunities for waste-to-energy technologies, contributing to the long-term growth of the APCS market.
Emerging Opportunities in Air Pollution Control System Industry
Emerging opportunities include the development of smart APCS solutions integrating AI and IoT for predictive maintenance and real-time monitoring. This also encompasses the growth of the bio-energy market, increasing the demand for advanced APCS solutions designed to handle the unique emission profiles of biomass-based power plants. Furthermore, the expansion into emerging markets in developing economies, which are undergoing rapid industrialization but lack robust air quality monitoring infrastructure, presents significant potential for growth.
Leading Players in the Air Pollution Control System Industry Sector
- Thermax Ltd
- Pure Air Solutions
- Gea Bischoff
- General Electric
- Ducon Technologies Inc
- Horiba Ltd
- Hamon Corporation
- Andritz Ag
- Siemens AG
- Mitsubishi Hitachi Power Systems Ltd
- Calgon Carbon Corporation
- Fujian Longking Co Ltd
- Babcock & Wilcox Enterprises Inc
- Tri-mer
- Amec Foster Wheeler
- Esco International
Key Milestones in Air Pollution Control System Industry Industry
- 2020: Introduction of stricter emission standards in several key regions.
- 2021: Launch of several AI-powered APCS monitoring systems.
- 2022: Major M&A activity consolidating the industry landscape.
- 2023: Increased adoption of SCR technologies in power generation sector.
- 2024: Development of advanced hybrid APCS systems.
Strategic Outlook for Air Pollution Control System Industry Market
The future of the APCS industry appears promising, driven by a convergence of technological advancements, regulatory pressures, and growing environmental awareness. Companies focusing on innovation, strategic partnerships, and expansion into emerging markets will be well-positioned to capitalize on the long-term growth potential. A focus on providing integrated solutions encompassing system design, installation, operation, and maintenance will further enhance market leadership. The increasing demand for sustainable industrial practices offers long-term growth prospects for companies that adapt swiftly and provide integrated solutions tailored to the specific needs of various industries.
Air Pollution Control System Industry Segmentation
-
1. Application
- 1.1. Power Generation
- 1.2. Cement Industry
- 1.3. Iron & Steel Industry
- 1.4. Chemical Industry
- 1.5. Others
-
2. Type
- 2.1. Electrostatic Precipitators (ESP)
- 2.2. Flue Gas Desulfurization (FGD)
- 2.3. Scrubbers
- 2.4. Selective Catalytic Reduction (SCR)
- 2.5. Fabric Filters
Air Pollution Control System Industry Segmentation By Geography
-
1. North America
- 1.1. United States
- 1.2. Canada
- 1.3. Rest of North America
-
2. Asia Pacific
- 2.1. India
- 2.2. China
- 2.3. Japan
- 2.4. Australia
- 2.5. Rest of Asia Pacific
-
3. Europe
- 3.1. Germany
- 3.2. France
- 3.3. United Kingdom
- 3.4. Italy
- 3.5. Rest of Europe
-
4. South America
- 4.1. Brazil
- 4.2. Argentina
- 4.3. Chile
- 4.4. Rest of South America
-
5. Middle East and Africa
- 5.1. Saudi Arabia
- 5.2. South Africa
- 5.3. Algeria
- 5.4. Rest of Middle East and Africa
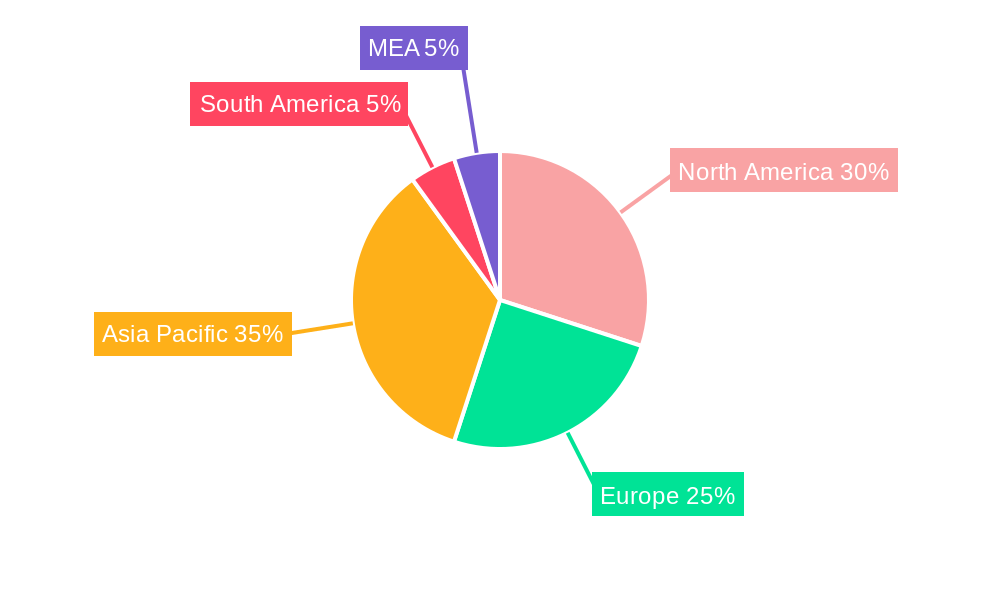
Air Pollution Control System Industry Regional Market Share
Geographic Coverage of Air Pollution Control System Industry
Air Pollution Control System Industry REPORT HIGHLIGHTS
| Aspects | Details |
|---|---|
| Study Period | 2020-2034 |
| Base Year | 2025 |
| Estimated Year | 2026 |
| Forecast Period | 2026-2034 |
| Historical Period | 2020-2025 |
| Growth Rate | CAGR of 6.3% from 2020-2034 |
| Segmentation |
|
Table of Contents
- 1. Introduction
- 1.1. Research Scope
- 1.2. Market Segmentation
- 1.3. Research Objective
- 1.4. Definitions and Assumptions
- 2. Executive Summary
- 2.1. Market Snapshot
- 3. Market Dynamics
- 3.1. Market Drivers
- 3.2. Market Restrains
- 3.3. Market Trends
- 3.4. Market Opportunities
- 4. Market Factor Analysis
- 4.1. Porters Five Forces
- 4.1.1. Bargaining Power of Suppliers
- 4.1.2. Bargaining Power of Buyers
- 4.1.3. Threat of New Entrants
- 4.1.4. Threat of Substitutes
- 4.1.5. Competitive Rivalry
- 4.2. PESTEL analysis
- 4.3. BCG Analysis
- 4.3.1. Stars (High Growth, High Market Share)
- 4.3.2. Cash Cows (Low Growth, High Market Share)
- 4.3.3. Question Mark (High Growth, Low Market Share)
- 4.3.4. Dogs (Low Growth, Low Market Share)
- 4.4. Ansoff Matrix Analysis
- 4.5. Supply Chain Analysis
- 4.6. Regulatory Landscape
- 4.7. Current Market Potential and Opportunity Assessment (TAM–SAM–SOM Framework)
- 4.8. MSR Analyst Note
- 4.1. Porters Five Forces
- 5. Market Analysis, Insights and Forecast 2021-2033
- 5.1. Market Analysis, Insights and Forecast - by Application
- 5.1.1. Power Generation
- 5.1.2. Cement Industry
- 5.1.3. Iron & Steel Industry
- 5.1.4. Chemical Industry
- 5.1.5. Others
- 5.2. Market Analysis, Insights and Forecast - by Type
- 5.2.1. Electrostatic Precipitators (ESP)
- 5.2.2. Flue Gas Desulfurization (FGD)
- 5.2.3. Scrubbers
- 5.2.4. Selective Catalytic Reduction (SCR)
- 5.2.5. Fabric Filters
- 5.3. Market Analysis, Insights and Forecast - by Region
- 5.3.1. North America
- 5.3.2. Asia Pacific
- 5.3.3. Europe
- 5.3.4. South America
- 5.3.5. Middle East and Africa
- 5.1. Market Analysis, Insights and Forecast - by Application
- 6. Global Air Pollution Control System Industry Analysis, Insights and Forecast, 2021-2033
- 6.1. Market Analysis, Insights and Forecast - by Application
- 6.1.1. Power Generation
- 6.1.2. Cement Industry
- 6.1.3. Iron & Steel Industry
- 6.1.4. Chemical Industry
- 6.1.5. Others
- 6.2. Market Analysis, Insights and Forecast - by Type
- 6.2.1. Electrostatic Precipitators (ESP)
- 6.2.2. Flue Gas Desulfurization (FGD)
- 6.2.3. Scrubbers
- 6.2.4. Selective Catalytic Reduction (SCR)
- 6.2.5. Fabric Filters
- 6.1. Market Analysis, Insights and Forecast - by Application
- 7. North America Air Pollution Control System Industry Analysis, Insights and Forecast, 2020-2032
- 7.1. Market Analysis, Insights and Forecast - by Application
- 7.1.1. Power Generation
- 7.1.2. Cement Industry
- 7.1.3. Iron & Steel Industry
- 7.1.4. Chemical Industry
- 7.1.5. Others
- 7.2. Market Analysis, Insights and Forecast - by Type
- 7.2.1. Electrostatic Precipitators (ESP)
- 7.2.2. Flue Gas Desulfurization (FGD)
- 7.2.3. Scrubbers
- 7.2.4. Selective Catalytic Reduction (SCR)
- 7.2.5. Fabric Filters
- 7.1. Market Analysis, Insights and Forecast - by Application
- 8. Asia Pacific Air Pollution Control System Industry Analysis, Insights and Forecast, 2020-2032
- 8.1. Market Analysis, Insights and Forecast - by Application
- 8.1.1. Power Generation
- 8.1.2. Cement Industry
- 8.1.3. Iron & Steel Industry
- 8.1.4. Chemical Industry
- 8.1.5. Others
- 8.2. Market Analysis, Insights and Forecast - by Type
- 8.2.1. Electrostatic Precipitators (ESP)
- 8.2.2. Flue Gas Desulfurization (FGD)
- 8.2.3. Scrubbers
- 8.2.4. Selective Catalytic Reduction (SCR)
- 8.2.5. Fabric Filters
- 8.1. Market Analysis, Insights and Forecast - by Application
- 9. Europe Air Pollution Control System Industry Analysis, Insights and Forecast, 2020-2032
- 9.1. Market Analysis, Insights and Forecast - by Application
- 9.1.1. Power Generation
- 9.1.2. Cement Industry
- 9.1.3. Iron & Steel Industry
- 9.1.4. Chemical Industry
- 9.1.5. Others
- 9.2. Market Analysis, Insights and Forecast - by Type
- 9.2.1. Electrostatic Precipitators (ESP)
- 9.2.2. Flue Gas Desulfurization (FGD)
- 9.2.3. Scrubbers
- 9.2.4. Selective Catalytic Reduction (SCR)
- 9.2.5. Fabric Filters
- 9.1. Market Analysis, Insights and Forecast - by Application
- 10. South America Air Pollution Control System Industry Analysis, Insights and Forecast, 2020-2032
- 10.1. Market Analysis, Insights and Forecast - by Application
- 10.1.1. Power Generation
- 10.1.2. Cement Industry
- 10.1.3. Iron & Steel Industry
- 10.1.4. Chemical Industry
- 10.1.5. Others
- 10.2. Market Analysis, Insights and Forecast - by Type
- 10.2.1. Electrostatic Precipitators (ESP)
- 10.2.2. Flue Gas Desulfurization (FGD)
- 10.2.3. Scrubbers
- 10.2.4. Selective Catalytic Reduction (SCR)
- 10.2.5. Fabric Filters
- 10.1. Market Analysis, Insights and Forecast - by Application
- 11. Middle East and Africa Air Pollution Control System Industry Analysis, Insights and Forecast, 2020-2032
- 11.1. Market Analysis, Insights and Forecast - by Application
- 11.1.1. Power Generation
- 11.1.2. Cement Industry
- 11.1.3. Iron & Steel Industry
- 11.1.4. Chemical Industry
- 11.1.5. Others
- 11.2. Market Analysis, Insights and Forecast - by Type
- 11.2.1. Electrostatic Precipitators (ESP)
- 11.2.2. Flue Gas Desulfurization (FGD)
- 11.2.3. Scrubbers
- 11.2.4. Selective Catalytic Reduction (SCR)
- 11.2.5. Fabric Filters
- 11.1. Market Analysis, Insights and Forecast - by Application
- 12. Competitive Analysis
- 12.1. Company Profiles
- 12.1.1 Thermax Ltd
- 12.1.1.1. Company Overview
- 12.1.1.2. Products
- 12.1.1.3. Company Financials
- 12.1.1.4. SWOT Analysis
- 12.1.2 Pure Air Solutions
- 12.1.2.1. Company Overview
- 12.1.2.2. Products
- 12.1.2.3. Company Financials
- 12.1.2.4. SWOT Analysis
- 12.1.3 Gea Bischoff
- 12.1.3.1. Company Overview
- 12.1.3.2. Products
- 12.1.3.3. Company Financials
- 12.1.3.4. SWOT Analysis
- 12.1.4 General Electric
- 12.1.4.1. Company Overview
- 12.1.4.2. Products
- 12.1.4.3. Company Financials
- 12.1.4.4. SWOT Analysis
- 12.1.5 Ducon Technologies Inc
- 12.1.5.1. Company Overview
- 12.1.5.2. Products
- 12.1.5.3. Company Financials
- 12.1.5.4. SWOT Analysis
- 12.1.6 Horiba Ltd
- 12.1.6.1. Company Overview
- 12.1.6.2. Products
- 12.1.6.3. Company Financials
- 12.1.6.4. SWOT Analysis
- 12.1.7 Hamon Corporation
- 12.1.7.1. Company Overview
- 12.1.7.2. Products
- 12.1.7.3. Company Financials
- 12.1.7.4. SWOT Analysis
- 12.1.8 Andritz Ag
- 12.1.8.1. Company Overview
- 12.1.8.2. Products
- 12.1.8.3. Company Financials
- 12.1.8.4. SWOT Analysis
- 12.1.9 Siemens AG
- 12.1.9.1. Company Overview
- 12.1.9.2. Products
- 12.1.9.3. Company Financials
- 12.1.9.4. SWOT Analysis
- 12.1.10 Mitsubishi Hitachi Power Systems Ltd
- 12.1.10.1. Company Overview
- 12.1.10.2. Products
- 12.1.10.3. Company Financials
- 12.1.10.4. SWOT Analysis
- 12.1.11 Calgon Carbon Corporation
- 12.1.11.1. Company Overview
- 12.1.11.2. Products
- 12.1.11.3. Company Financials
- 12.1.11.4. SWOT Analysis
- 12.1.12 Fujian Longking Co Ltd
- 12.1.12.1. Company Overview
- 12.1.12.2. Products
- 12.1.12.3. Company Financials
- 12.1.12.4. SWOT Analysis
- 12.1.13 Babcock & Wilcox Enterprises Inc
- 12.1.13.1. Company Overview
- 12.1.13.2. Products
- 12.1.13.3. Company Financials
- 12.1.13.4. SWOT Analysis
- 12.1.14 Tri-mer
- 12.1.14.1. Company Overview
- 12.1.14.2. Products
- 12.1.14.3. Company Financials
- 12.1.14.4. SWOT Analysis
- 12.1.15 Amec Foster Wheeler
- 12.1.15.1. Company Overview
- 12.1.15.2. Products
- 12.1.15.3. Company Financials
- 12.1.15.4. SWOT Analysis
- 12.1.16 Esco International
- 12.1.16.1. Company Overview
- 12.1.16.2. Products
- 12.1.16.3. Company Financials
- 12.1.16.4. SWOT Analysis
- 12.1.1 Thermax Ltd
- 12.2. Market Entropy
- 12.2.1 Company's Key Areas Served
- 12.2.2 Recent Developments
- 12.3. Company Market Share Analysis 2025
- 12.3.1 Top 5 Companies Market Share Analysis
- 12.3.2 Top 3 Companies Market Share Analysis
- 12.4. List of Potential Customers
- 13. Research Methodology
List of Figures
- Figure 1: Global Air Pollution Control System Industry Revenue Breakdown (billion, %) by Region 2025 & 2033
- Figure 2: North America Air Pollution Control System Industry Revenue (billion), by Application 2025 & 2033
- Figure 3: North America Air Pollution Control System Industry Revenue Share (%), by Application 2025 & 2033
- Figure 4: North America Air Pollution Control System Industry Revenue (billion), by Type 2025 & 2033
- Figure 5: North America Air Pollution Control System Industry Revenue Share (%), by Type 2025 & 2033
- Figure 6: North America Air Pollution Control System Industry Revenue (billion), by Country 2025 & 2033
- Figure 7: North America Air Pollution Control System Industry Revenue Share (%), by Country 2025 & 2033
- Figure 8: Asia Pacific Air Pollution Control System Industry Revenue (billion), by Application 2025 & 2033
- Figure 9: Asia Pacific Air Pollution Control System Industry Revenue Share (%), by Application 2025 & 2033
- Figure 10: Asia Pacific Air Pollution Control System Industry Revenue (billion), by Type 2025 & 2033
- Figure 11: Asia Pacific Air Pollution Control System Industry Revenue Share (%), by Type 2025 & 2033
- Figure 12: Asia Pacific Air Pollution Control System Industry Revenue (billion), by Country 2025 & 2033
- Figure 13: Asia Pacific Air Pollution Control System Industry Revenue Share (%), by Country 2025 & 2033
- Figure 14: Europe Air Pollution Control System Industry Revenue (billion), by Application 2025 & 2033
- Figure 15: Europe Air Pollution Control System Industry Revenue Share (%), by Application 2025 & 2033
- Figure 16: Europe Air Pollution Control System Industry Revenue (billion), by Type 2025 & 2033
- Figure 17: Europe Air Pollution Control System Industry Revenue Share (%), by Type 2025 & 2033
- Figure 18: Europe Air Pollution Control System Industry Revenue (billion), by Country 2025 & 2033
- Figure 19: Europe Air Pollution Control System Industry Revenue Share (%), by Country 2025 & 2033
- Figure 20: South America Air Pollution Control System Industry Revenue (billion), by Application 2025 & 2033
- Figure 21: South America Air Pollution Control System Industry Revenue Share (%), by Application 2025 & 2033
- Figure 22: South America Air Pollution Control System Industry Revenue (billion), by Type 2025 & 2033
- Figure 23: South America Air Pollution Control System Industry Revenue Share (%), by Type 2025 & 2033
- Figure 24: South America Air Pollution Control System Industry Revenue (billion), by Country 2025 & 2033
- Figure 25: South America Air Pollution Control System Industry Revenue Share (%), by Country 2025 & 2033
- Figure 26: Middle East and Africa Air Pollution Control System Industry Revenue (billion), by Application 2025 & 2033
- Figure 27: Middle East and Africa Air Pollution Control System Industry Revenue Share (%), by Application 2025 & 2033
- Figure 28: Middle East and Africa Air Pollution Control System Industry Revenue (billion), by Type 2025 & 2033
- Figure 29: Middle East and Africa Air Pollution Control System Industry Revenue Share (%), by Type 2025 & 2033
- Figure 30: Middle East and Africa Air Pollution Control System Industry Revenue (billion), by Country 2025 & 2033
- Figure 31: Middle East and Africa Air Pollution Control System Industry Revenue Share (%), by Country 2025 & 2033
List of Tables
- Table 1: Global Air Pollution Control System Industry Revenue billion Forecast, by Application 2020 & 2033
- Table 2: Global Air Pollution Control System Industry Revenue billion Forecast, by Type 2020 & 2033
- Table 3: Global Air Pollution Control System Industry Revenue billion Forecast, by Region 2020 & 2033
- Table 4: Global Air Pollution Control System Industry Revenue billion Forecast, by Application 2020 & 2033
- Table 5: Global Air Pollution Control System Industry Revenue billion Forecast, by Type 2020 & 2033
- Table 6: Global Air Pollution Control System Industry Revenue billion Forecast, by Country 2020 & 2033
- Table 7: United States Air Pollution Control System Industry Revenue (billion) Forecast, by Application 2020 & 2033
- Table 8: Canada Air Pollution Control System Industry Revenue (billion) Forecast, by Application 2020 & 2033
- Table 9: Rest of North America Air Pollution Control System Industry Revenue (billion) Forecast, by Application 2020 & 2033
- Table 10: Global Air Pollution Control System Industry Revenue billion Forecast, by Application 2020 & 2033
- Table 11: Global Air Pollution Control System Industry Revenue billion Forecast, by Type 2020 & 2033
- Table 12: Global Air Pollution Control System Industry Revenue billion Forecast, by Country 2020 & 2033
- Table 13: India Air Pollution Control System Industry Revenue (billion) Forecast, by Application 2020 & 2033
- Table 14: China Air Pollution Control System Industry Revenue (billion) Forecast, by Application 2020 & 2033
- Table 15: Japan Air Pollution Control System Industry Revenue (billion) Forecast, by Application 2020 & 2033
- Table 16: Australia Air Pollution Control System Industry Revenue (billion) Forecast, by Application 2020 & 2033
- Table 17: Rest of Asia Pacific Air Pollution Control System Industry Revenue (billion) Forecast, by Application 2020 & 2033
- Table 18: Global Air Pollution Control System Industry Revenue billion Forecast, by Application 2020 & 2033
- Table 19: Global Air Pollution Control System Industry Revenue billion Forecast, by Type 2020 & 2033
- Table 20: Global Air Pollution Control System Industry Revenue billion Forecast, by Country 2020 & 2033
- Table 21: Germany Air Pollution Control System Industry Revenue (billion) Forecast, by Application 2020 & 2033
- Table 22: France Air Pollution Control System Industry Revenue (billion) Forecast, by Application 2020 & 2033
- Table 23: United Kingdom Air Pollution Control System Industry Revenue (billion) Forecast, by Application 2020 & 2033
- Table 24: Italy Air Pollution Control System Industry Revenue (billion) Forecast, by Application 2020 & 2033
- Table 25: Rest of Europe Air Pollution Control System Industry Revenue (billion) Forecast, by Application 2020 & 2033
- Table 26: Global Air Pollution Control System Industry Revenue billion Forecast, by Application 2020 & 2033
- Table 27: Global Air Pollution Control System Industry Revenue billion Forecast, by Type 2020 & 2033
- Table 28: Global Air Pollution Control System Industry Revenue billion Forecast, by Country 2020 & 2033
- Table 29: Brazil Air Pollution Control System Industry Revenue (billion) Forecast, by Application 2020 & 2033
- Table 30: Argentina Air Pollution Control System Industry Revenue (billion) Forecast, by Application 2020 & 2033
- Table 31: Chile Air Pollution Control System Industry Revenue (billion) Forecast, by Application 2020 & 2033
- Table 32: Rest of South America Air Pollution Control System Industry Revenue (billion) Forecast, by Application 2020 & 2033
- Table 33: Global Air Pollution Control System Industry Revenue billion Forecast, by Application 2020 & 2033
- Table 34: Global Air Pollution Control System Industry Revenue billion Forecast, by Type 2020 & 2033
- Table 35: Global Air Pollution Control System Industry Revenue billion Forecast, by Country 2020 & 2033
- Table 36: Saudi Arabia Air Pollution Control System Industry Revenue (billion) Forecast, by Application 2020 & 2033
- Table 37: South Africa Air Pollution Control System Industry Revenue (billion) Forecast, by Application 2020 & 2033
- Table 38: Algeria Air Pollution Control System Industry Revenue (billion) Forecast, by Application 2020 & 2033
- Table 39: Rest of Middle East and Africa Air Pollution Control System Industry Revenue (billion) Forecast, by Application 2020 & 2033
Frequently Asked Questions
1. What is the projected Compound Annual Growth Rate (CAGR) of the Air Pollution Control System Industry?
The projected CAGR is approximately 6.3%.
2. Which companies are prominent players in the Air Pollution Control System Industry?
Key companies in the market include Thermax Ltd, Pure Air Solutions, Gea Bischoff, General Electric, Ducon Technologies Inc, Horiba Ltd, Hamon Corporation, Andritz Ag, Siemens AG, Mitsubishi Hitachi Power Systems Ltd, Calgon Carbon Corporation, Fujian Longking Co Ltd, Babcock & Wilcox Enterprises Inc, Tri-mer, Amec Foster Wheeler, Esco International.
3. What are the main segments of the Air Pollution Control System Industry?
The market segments include Application, Type.
4. Can you provide details about the market size?
The market size is estimated to be USD 103.66 billion as of 2022.
5. What are some drivers contributing to market growth?
4.; Increasing Amount of Waste Generation. Growing Concern for Waste Management to Meet the Needs for Sustainable Urban Living4.; Increasing Focus on Non-fossil Fuel Sources of Energy.
6. What are the notable trends driving market growth?
Increasing Demand from Power Generation Industry.
7. Are there any restraints impacting market growth?
4.; Expensive Nature of Incinerators.
8. Can you provide examples of recent developments in the market?
N/A
9. What pricing options are available for accessing the report?
Pricing options include single-user, multi-user, and enterprise licenses priced at USD 4750, USD 5250, and USD 8750 respectively.
10. Is the market size provided in terms of value or volume?
The market size is provided in terms of value, measured in billion.
11. Are there any specific market keywords associated with the report?
Yes, the market keyword associated with the report is "Air Pollution Control System Industry," which aids in identifying and referencing the specific market segment covered.
12. How do I determine which pricing option suits my needs best?
The pricing options vary based on user requirements and access needs. Individual users may opt for single-user licenses, while businesses requiring broader access may choose multi-user or enterprise licenses for cost-effective access to the report.
13. Are there any additional resources or data provided in the Air Pollution Control System Industry report?
While the report offers comprehensive insights, it's advisable to review the specific contents or supplementary materials provided to ascertain if additional resources or data are available.
14. How can I stay updated on further developments or reports in the Air Pollution Control System Industry?
To stay informed about further developments, trends, and reports in the Air Pollution Control System Industry, consider subscribing to industry newsletters, following relevant companies and organizations, or regularly checking reputable industry news sources and publications.
Methodology
Step 1 - Identification of Relevant Samples Size from Population Database


Step 2 - Approaches for Defining Global Market Size (Value, Volume* & Price*)

Note*: In applicable scenarios
Step 3 - Data Sources
Primary Research
- Web Analytics
- Survey Reports
- Research Institute
- Latest Research Reports
- Opinion Leaders
Secondary Research
- Annual Reports
- White Paper
- Latest Press Release
- Industry Association
- Paid Database
- Investor Presentations

Step 4 - Data Triangulation
Involves using different sources of information in order to increase the validity of a study
These sources are likely to be stakeholders in a program - participants, other researchers, program staff, other community members, and so on.
Then we put all data in single framework & apply various statistical tools to find out the dynamic on the market.
During the analysis stage, feedback from the stakeholder groups would be compared to determine areas of agreement as well as areas of divergence