

Key Insights
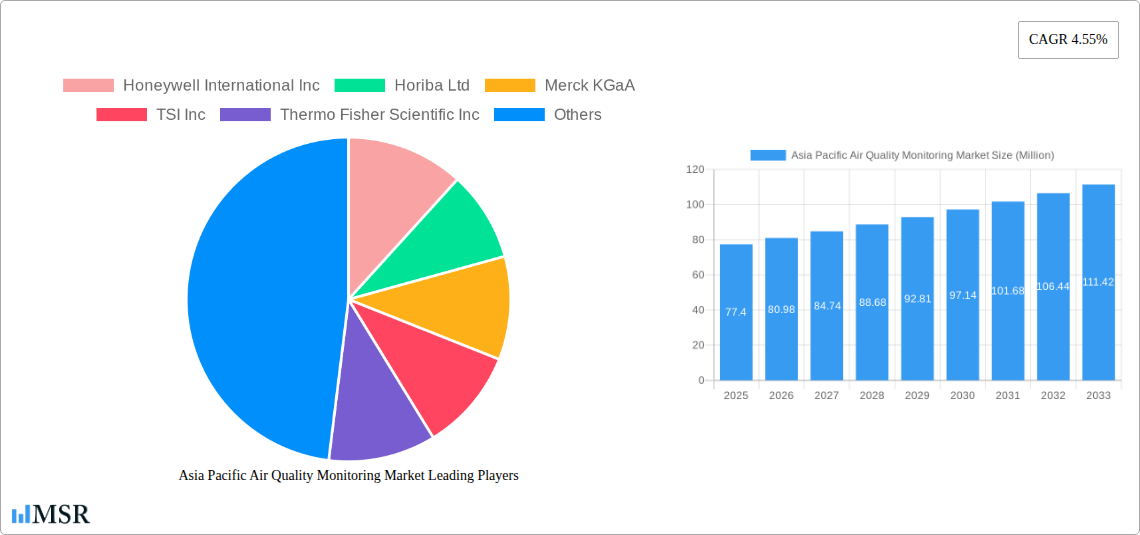
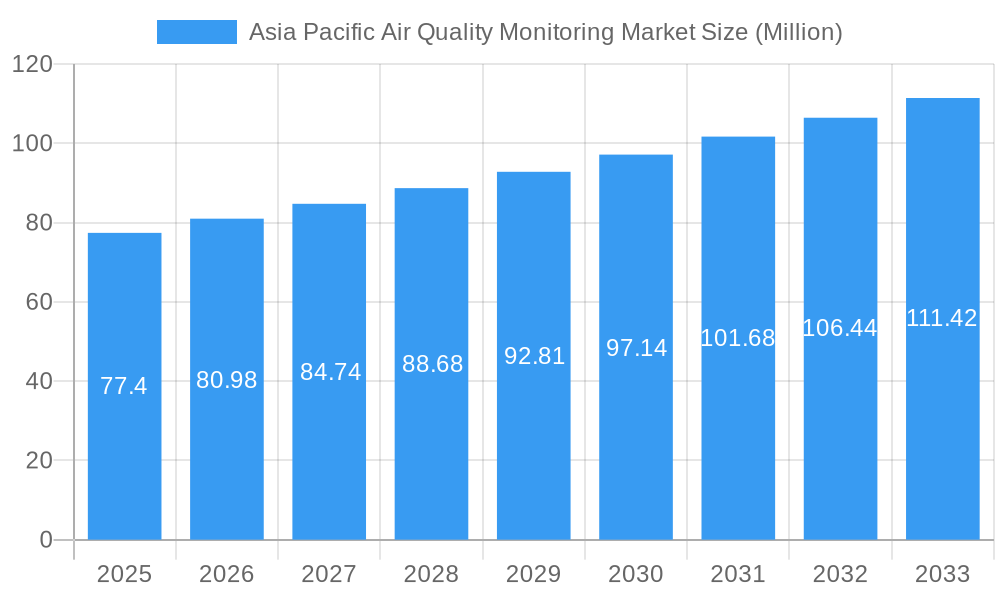
The Asia Pacific air quality monitoring market, valued at $77.40 million in 2025, is projected to experience robust growth, driven by increasing environmental concerns, stringent government regulations, and rapid urbanization across the region. The compound annual growth rate (CAGR) of 4.55% from 2025 to 2033 signifies a significant expansion, with the market expected to surpass $115 million by 2033. Key growth drivers include rising air pollution levels in major cities like Delhi, Shanghai, and Tokyo, necessitating advanced monitoring systems. Furthermore, the increasing adoption of continuous monitoring methods, coupled with the growing demand for both indoor and outdoor air quality monitoring solutions across residential, commercial, power generation, and petrochemical sectors, fuels market expansion. Technological advancements leading to more precise and efficient monitoring devices, along with the rising awareness among consumers regarding air quality and its health impacts, are also contributing factors. While the market faces restraints such as high initial investment costs for sophisticated monitoring equipment and a lack of awareness in certain regions, the overall growth trajectory remains positive. China, India, and Japan are expected to dominate the regional market due to their high population density, industrial activities, and government initiatives promoting environmental protection.
Asia Pacific Air Quality Monitoring Market Market Size (In Million)
The market segmentation reveals a diverse landscape. Continuous monitoring methods are gaining traction due to their real-time data capabilities, while the demand for chemical pollutant monitoring is higher compared to physical and biological pollutant monitoring, given the prevalent presence of industrial emissions and vehicular exhaust. Within the end-user segment, the power generation and petrochemical sectors are prominent due to their stringent emission regulations. Leading companies such as Honeywell, Horiba, and Thermo Fisher Scientific are actively involved in developing and supplying advanced air quality monitoring solutions, fostering competition and innovation. The substantial investments in research and development for more sophisticated and cost-effective monitoring technologies are anticipated to further shape the market's future growth.
Asia Pacific Air Quality Monitoring Market Company Market Share
Asia Pacific Air Quality Monitoring Market: A Comprehensive Report (2019-2033)
This comprehensive report provides an in-depth analysis of the Asia Pacific Air Quality Monitoring Market, offering invaluable insights for industry stakeholders, investors, and researchers. Covering the period from 2019 to 2033, with a focus on 2025, this report meticulously examines market dynamics, key segments, leading players, and emerging opportunities. The market is projected to reach xx Million by 2033, exhibiting a CAGR of xx% during the forecast period (2025-2033).
Asia Pacific Air Quality Monitoring Market Market Concentration & Dynamics
The Asia Pacific air quality monitoring market exhibits a moderately consolidated structure, with several key players holding significant market share. However, the presence of numerous smaller, specialized companies fosters a dynamic competitive landscape. Market concentration is further influenced by ongoing mergers and acquisitions (M&A) activity, with xx M&A deals recorded between 2019 and 2024. Key players like Honeywell International Inc, Horiba Ltd, and Thermo Fisher Scientific Inc, hold a significant portion of the market, estimated at xx%, while smaller players focus on niche segments or regional markets. Innovation is driven by government regulations promoting cleaner air, technological advancements in sensor technology, and growing demand for real-time monitoring. The market also faces pressure from substitute products, such as less expensive, less sophisticated monitoring devices, but the overall trend points towards sophisticated, integrated systems for comprehensive analysis. End-user trends show a shift towards continuous monitoring solutions, particularly in sectors like power generation and petrochemicals.
- Market Share: Top 5 players hold approximately xx% of the market share.
- M&A Activity: xx deals concluded between 2019 and 2024, indicating consolidation trends.
- Innovation: Focus on IoT integration, AI-powered analytics, and miniaturization of sensors.
- Regulatory Landscape: Stringent emission standards and government initiatives drive market growth.
Asia Pacific Air Quality Monitoring Market Industry Insights & Trends
The Asia Pacific air quality monitoring market is experiencing robust growth, driven by escalating environmental concerns, increasingly stringent government regulations, and rapid industrialization. The market size was valued at USD XXX Million in 2024 and is projected to reach USD YYY Million by 2033, demonstrating a significant Compound Annual Growth Rate (CAGR) of ZZ.Z%. Several factors contribute to this expansion. Rising air pollution levels in major urban centers across the region necessitate advanced monitoring solutions. Government initiatives, such as India's launch of AI-AQMS v1.0 and the ADB's Asia Clean Blue Skies Program, are significantly boosting investments in air quality monitoring infrastructure. Furthermore, technological advancements, including the development of more accurate, reliable, and cost-effective sensors, coupled with the increasing adoption of IoT and AI in monitoring systems, are widening the accessibility and applications of air quality monitoring. Evolving consumer behavior showcases increased awareness of air quality and a growing demand for real-time, hyperlocal information about pollution levels. These factors collectively paint a highly positive outlook for the market, suggesting continuous and substantial expansion in the coming years.
Key Markets & Segments Leading Asia Pacific Air Quality Monitoring Market
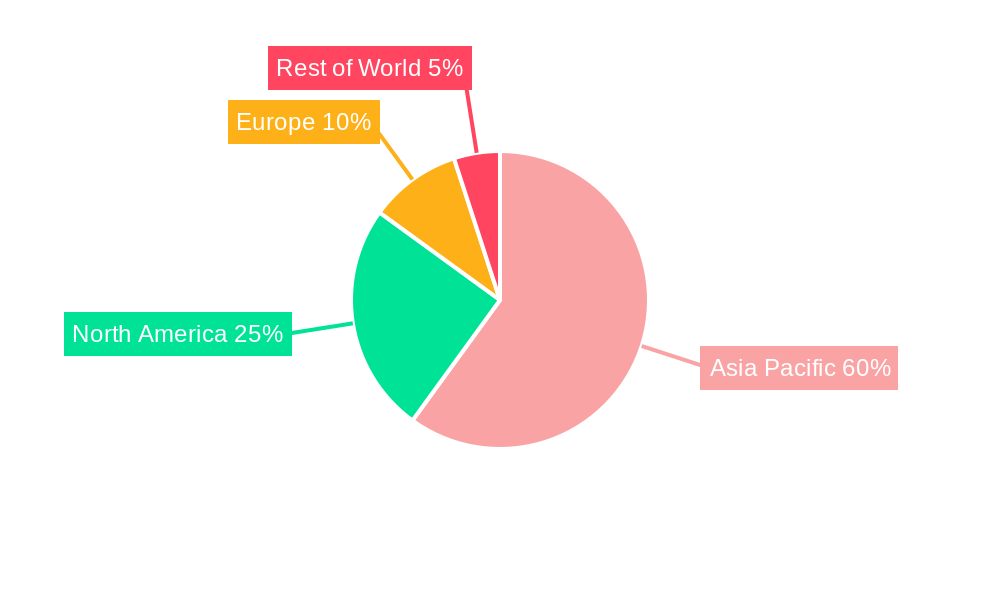
The continuous monitoring segment dominates the sampling method category, driven by the increasing need for real-time data and early warning systems. Chemical pollutants constitute the largest share of the pollutant type segment, mirroring the prevalent sources of pollution in the region. The power generation and petrochemicals end-users show the highest demand due to stringent environmental regulations in these industries. China and India are leading regional markets, fuelled by rapid urbanization, industrial growth, and dedicated governmental initiatives. Outdoor monitors are presently more prevalent than indoor monitors due to the larger-scale monitoring needs.
- Dominant Region: China and India represent the largest markets due to high pollution levels and government initiatives.
- Dominant Segment (Sampling Method): Continuous monitoring due to the need for real-time data.
- Dominant Segment (Pollutant Type): Chemical pollutants due to industrial emissions.
- Dominant Segment (End User): Power generation and petrochemicals due to stringent regulations.
- Dominant Segment (Product Type): Outdoor monitors due to broader applications.
- Growth Drivers: Rapid urbanization, industrialization, stringent environmental regulations, government investments, and technological advancements.
Asia Pacific Air Quality Monitoring Market Product Developments
Recent years have witnessed significant advancements in air quality monitoring technology. Miniaturization of sensors, incorporation of IoT capabilities for remote monitoring, and the integration of AI-powered analytics for predictive modeling have revolutionized the market. This has led to the development of more accurate, reliable, portable and cost-effective monitoring solutions, broadening market reach and enhancing data analysis capabilities. The integration of these technologies provides a competitive edge for manufacturers.
Challenges in the Asia Pacific Air Quality Monitoring Market Market
The Asia Pacific air quality monitoring market faces several challenges, including high initial investment costs for advanced systems, the need for skilled personnel for operation and maintenance, and the complexities of integrating diverse data sources. Supply chain disruptions caused by geopolitical instability may also impact availability and pricing. Furthermore, inconsistencies in regulatory frameworks across different countries in the region create obstacles for market standardization and expansion. The highly competitive market also puts pressure on profit margins.
Forces Driving Asia Pacific Air Quality Monitoring Market Growth
Several powerful forces are propelling the growth of the Asia Pacific air quality monitoring market. Increasingly stringent government regulations and ambitious pollution reduction targets are compelling industries and municipalities to invest in robust monitoring solutions. Growing public awareness and concern among citizens regarding the detrimental health and environmental impacts of poor air quality are creating significant demand for transparent and accessible air quality data. Substantial investments in infrastructure development, including smart cities and industrial zones, are creating new opportunities for deploying advanced monitoring networks. Technological advancements, such as the development of miniaturized, low-cost, and highly sensitive sensors, alongside the integration of Artificial Intelligence (AI) and the Internet of Things (IoT), are making monitoring more accessible, efficient, and data-rich. Furthermore, the rising demand for real-time, granular air quality data from diverse sectors—including public health, urban planning, and industrial safety—along with the increasing adoption of smart city initiatives, are major growth catalysts.
Long-Term Growth Catalysts in the Asia Pacific Air Quality Monitoring Market
Long-term growth hinges on continued technological innovation, strategic partnerships between technology providers and government agencies, and the expansion of air quality monitoring networks into underserved areas. The development of more sophisticated and integrated monitoring systems capable of analyzing a broader range of pollutants will significantly influence market growth. Public-private partnerships and increased investments in research and development will be essential for achieving sustainable growth.
Emerging Opportunities in Asia Pacific Air Quality Monitoring Market
The market offers substantial opportunities in the development and deployment of low-cost, portable, and user-friendly monitoring devices tailored for residential use. The integration of air quality data into smart city platforms and the expansion into emerging markets within the Asia Pacific region hold immense potential. Furthermore, the development of advanced analytics and predictive modeling capabilities will further enhance the value proposition of air quality monitoring solutions.
Leading Players in the Asia Pacific Air Quality Monitoring Market Sector
- Honeywell International Inc
- Horiba Ltd
- Merck KGaA
- TSI Inc
- Thermo Fisher Scientific Inc
- Aeroqual Limited
- Emerson Electric Co
- Siemens AG
- Agilent Technologies Inc
- 3M Co
- Teledyne Technologies Inc
Key Milestones in Asia Pacific Air Quality Monitoring Market Industry
- January 2023: India launched the Technology for Air Quality Monitoring System (AI-AQMS v1.0), a significant step that boosts domestic technological capabilities and creates a strong demand for related hardware, software, and data analytics solutions.
- September 2022: The Asian Development Bank (ADB) launched the Asia Clean Blue Skies Program (ACBSP), an initiative designed to stimulate substantial investments and foster policy development across the region. This program significantly impacts market growth by providing crucial funding, technical assistance, and support for air quality improvement projects, thereby accelerating the adoption of monitoring technologies.
Strategic Outlook for Asia Pacific Air Quality Monitoring Market Market
The Asia Pacific air quality monitoring market holds significant growth potential driven by continuous technological innovations, expanding regulatory frameworks, and increasing environmental awareness. Strategic partnerships, investments in R&D, and the focus on developing user-friendly, cost-effective solutions will be crucial for capturing market share and driving long-term growth. The market is poised for expansion, particularly in emerging economies with rapidly growing urbanization and industrialization.
Asia Pacific Air Quality Monitoring Market Segmentation
-
1. Product Type
- 1.1. Indoor Monitor
- 1.2. Outdoor Monitor
-
2. Sampling Method
- 2.1. Continuous
- 2.2. Manual
- 2.3. Intermittent
-
3. Pollutant Type
- 3.1. Chemical Pollutants
- 3.2. Physical Pollutants
- 3.3. Biological Pollutants
-
4. End User
- 4.1. Residential and Commercial
- 4.2. Power Generation
- 4.3. Petrochemicals
- 4.4. Other End Users
-
5. Geography
- 5.1. China
- 5.2. India
- 5.3. Japan
- 5.4. Singapore
- 5.5. Rest of Asia-Pacific
Asia Pacific Air Quality Monitoring Market Segmentation By Geography
- 1. China
- 2. India
- 3. Japan
- 4. Singapore
- 5. Rest of Asia Pacific
Asia Pacific Air Quality Monitoring Market Regional Market Share
Geographic Coverage of Asia Pacific Air Quality Monitoring Market
Asia Pacific Air Quality Monitoring Market REPORT HIGHLIGHTS
| Aspects | Details |
|---|---|
| Study Period | 2020-2034 |
| Base Year | 2025 |
| Estimated Year | 2026 |
| Forecast Period | 2026-2034 |
| Historical Period | 2020-2025 |
| Growth Rate | CAGR of 4.55% from 2020-2034 |
| Segmentation |
|
Table of Contents
- 1. Introduction
- 1.1. Research Scope
- 1.2. Market Segmentation
- 1.3. Research Objective
- 1.4. Definitions and Assumptions
- 2. Executive Summary
- 2.1. Market Snapshot
- 3. Market Dynamics
- 3.1. Market Drivers
- 3.2. Market Restrains
- 3.3. Market Trends
- 3.4. Market Opportunities
- 4. Market Factor Analysis
- 4.1. Porters Five Forces
- 4.1.1. Bargaining Power of Suppliers
- 4.1.2. Bargaining Power of Buyers
- 4.1.3. Threat of New Entrants
- 4.1.4. Threat of Substitutes
- 4.1.5. Competitive Rivalry
- 4.2. PESTEL analysis
- 4.3. BCG Analysis
- 4.3.1. Stars (High Growth, High Market Share)
- 4.3.2. Cash Cows (Low Growth, High Market Share)
- 4.3.3. Question Mark (High Growth, Low Market Share)
- 4.3.4. Dogs (Low Growth, Low Market Share)
- 4.4. Ansoff Matrix Analysis
- 4.5. Supply Chain Analysis
- 4.6. Regulatory Landscape
- 4.7. Current Market Potential and Opportunity Assessment (TAM–SAM–SOM Framework)
- 4.8. MSR Analyst Note
- 4.1. Porters Five Forces
- 5. Market Analysis, Insights and Forecast 2021-2033
- 5.1. Market Analysis, Insights and Forecast - by Product Type
- 5.1.1. Indoor Monitor
- 5.1.2. Outdoor Monitor
- 5.2. Market Analysis, Insights and Forecast - by Sampling Method
- 5.2.1. Continuous
- 5.2.2. Manual
- 5.2.3. Intermittent
- 5.3. Market Analysis, Insights and Forecast - by Pollutant Type
- 5.3.1. Chemical Pollutants
- 5.3.2. Physical Pollutants
- 5.3.3. Biological Pollutants
- 5.4. Market Analysis, Insights and Forecast - by End User
- 5.4.1. Residential and Commercial
- 5.4.2. Power Generation
- 5.4.3. Petrochemicals
- 5.4.4. Other End Users
- 5.5. Market Analysis, Insights and Forecast - by Geography
- 5.5.1. China
- 5.5.2. India
- 5.5.3. Japan
- 5.5.4. Singapore
- 5.5.5. Rest of Asia-Pacific
- 5.6. Market Analysis, Insights and Forecast - by Region
- 5.6.1. China
- 5.6.2. India
- 5.6.3. Japan
- 5.6.4. Singapore
- 5.6.5. Rest of Asia Pacific
- 5.1. Market Analysis, Insights and Forecast - by Product Type
- 6. Asia Pacific Air Quality Monitoring Market Analysis, Insights and Forecast, 2021-2033
- 6.1. Market Analysis, Insights and Forecast - by Product Type
- 6.1.1. Indoor Monitor
- 6.1.2. Outdoor Monitor
- 6.2. Market Analysis, Insights and Forecast - by Sampling Method
- 6.2.1. Continuous
- 6.2.2. Manual
- 6.2.3. Intermittent
- 6.3. Market Analysis, Insights and Forecast - by Pollutant Type
- 6.3.1. Chemical Pollutants
- 6.3.2. Physical Pollutants
- 6.3.3. Biological Pollutants
- 6.4. Market Analysis, Insights and Forecast - by End User
- 6.4.1. Residential and Commercial
- 6.4.2. Power Generation
- 6.4.3. Petrochemicals
- 6.4.4. Other End Users
- 6.5. Market Analysis, Insights and Forecast - by Geography
- 6.5.1. China
- 6.5.2. India
- 6.5.3. Japan
- 6.5.4. Singapore
- 6.5.5. Rest of Asia-Pacific
- 6.1. Market Analysis, Insights and Forecast - by Product Type
- 7. China Asia Pacific Air Quality Monitoring Market Analysis, Insights and Forecast, 2020-2032
- 7.1. Market Analysis, Insights and Forecast - by Product Type
- 7.1.1. Indoor Monitor
- 7.1.2. Outdoor Monitor
- 7.2. Market Analysis, Insights and Forecast - by Sampling Method
- 7.2.1. Continuous
- 7.2.2. Manual
- 7.2.3. Intermittent
- 7.3. Market Analysis, Insights and Forecast - by Pollutant Type
- 7.3.1. Chemical Pollutants
- 7.3.2. Physical Pollutants
- 7.3.3. Biological Pollutants
- 7.4. Market Analysis, Insights and Forecast - by End User
- 7.4.1. Residential and Commercial
- 7.4.2. Power Generation
- 7.4.3. Petrochemicals
- 7.4.4. Other End Users
- 7.5. Market Analysis, Insights and Forecast - by Geography
- 7.5.1. China
- 7.5.2. India
- 7.5.3. Japan
- 7.5.4. Singapore
- 7.5.5. Rest of Asia-Pacific
- 7.1. Market Analysis, Insights and Forecast - by Product Type
- 8. India Asia Pacific Air Quality Monitoring Market Analysis, Insights and Forecast, 2020-2032
- 8.1. Market Analysis, Insights and Forecast - by Product Type
- 8.1.1. Indoor Monitor
- 8.1.2. Outdoor Monitor
- 8.2. Market Analysis, Insights and Forecast - by Sampling Method
- 8.2.1. Continuous
- 8.2.2. Manual
- 8.2.3. Intermittent
- 8.3. Market Analysis, Insights and Forecast - by Pollutant Type
- 8.3.1. Chemical Pollutants
- 8.3.2. Physical Pollutants
- 8.3.3. Biological Pollutants
- 8.4. Market Analysis, Insights and Forecast - by End User
- 8.4.1. Residential and Commercial
- 8.4.2. Power Generation
- 8.4.3. Petrochemicals
- 8.4.4. Other End Users
- 8.5. Market Analysis, Insights and Forecast - by Geography
- 8.5.1. China
- 8.5.2. India
- 8.5.3. Japan
- 8.5.4. Singapore
- 8.5.5. Rest of Asia-Pacific
- 8.1. Market Analysis, Insights and Forecast - by Product Type
- 9. Japan Asia Pacific Air Quality Monitoring Market Analysis, Insights and Forecast, 2020-2032
- 9.1. Market Analysis, Insights and Forecast - by Product Type
- 9.1.1. Indoor Monitor
- 9.1.2. Outdoor Monitor
- 9.2. Market Analysis, Insights and Forecast - by Sampling Method
- 9.2.1. Continuous
- 9.2.2. Manual
- 9.2.3. Intermittent
- 9.3. Market Analysis, Insights and Forecast - by Pollutant Type
- 9.3.1. Chemical Pollutants
- 9.3.2. Physical Pollutants
- 9.3.3. Biological Pollutants
- 9.4. Market Analysis, Insights and Forecast - by End User
- 9.4.1. Residential and Commercial
- 9.4.2. Power Generation
- 9.4.3. Petrochemicals
- 9.4.4. Other End Users
- 9.5. Market Analysis, Insights and Forecast - by Geography
- 9.5.1. China
- 9.5.2. India
- 9.5.3. Japan
- 9.5.4. Singapore
- 9.5.5. Rest of Asia-Pacific
- 9.1. Market Analysis, Insights and Forecast - by Product Type
- 10. Singapore Asia Pacific Air Quality Monitoring Market Analysis, Insights and Forecast, 2020-2032
- 10.1. Market Analysis, Insights and Forecast - by Product Type
- 10.1.1. Indoor Monitor
- 10.1.2. Outdoor Monitor
- 10.2. Market Analysis, Insights and Forecast - by Sampling Method
- 10.2.1. Continuous
- 10.2.2. Manual
- 10.2.3. Intermittent
- 10.3. Market Analysis, Insights and Forecast - by Pollutant Type
- 10.3.1. Chemical Pollutants
- 10.3.2. Physical Pollutants
- 10.3.3. Biological Pollutants
- 10.4. Market Analysis, Insights and Forecast - by End User
- 10.4.1. Residential and Commercial
- 10.4.2. Power Generation
- 10.4.3. Petrochemicals
- 10.4.4. Other End Users
- 10.5. Market Analysis, Insights and Forecast - by Geography
- 10.5.1. China
- 10.5.2. India
- 10.5.3. Japan
- 10.5.4. Singapore
- 10.5.5. Rest of Asia-Pacific
- 10.1. Market Analysis, Insights and Forecast - by Product Type
- 11. Rest of Asia Pacific Asia Pacific Air Quality Monitoring Market Analysis, Insights and Forecast, 2020-2032
- 11.1. Market Analysis, Insights and Forecast - by Product Type
- 11.1.1. Indoor Monitor
- 11.1.2. Outdoor Monitor
- 11.2. Market Analysis, Insights and Forecast - by Sampling Method
- 11.2.1. Continuous
- 11.2.2. Manual
- 11.2.3. Intermittent
- 11.3. Market Analysis, Insights and Forecast - by Pollutant Type
- 11.3.1. Chemical Pollutants
- 11.3.2. Physical Pollutants
- 11.3.3. Biological Pollutants
- 11.4. Market Analysis, Insights and Forecast - by End User
- 11.4.1. Residential and Commercial
- 11.4.2. Power Generation
- 11.4.3. Petrochemicals
- 11.4.4. Other End Users
- 11.5. Market Analysis, Insights and Forecast - by Geography
- 11.5.1. China
- 11.5.2. India
- 11.5.3. Japan
- 11.5.4. Singapore
- 11.5.5. Rest of Asia-Pacific
- 11.1. Market Analysis, Insights and Forecast - by Product Type
- 12. Competitive Analysis
- 12.1. Company Profiles
- 12.1.1 Honeywell International Inc
- 12.1.1.1. Company Overview
- 12.1.1.2. Products
- 12.1.1.3. Company Financials
- 12.1.1.4. SWOT Analysis
- 12.1.2 Horiba Ltd
- 12.1.2.1. Company Overview
- 12.1.2.2. Products
- 12.1.2.3. Company Financials
- 12.1.2.4. SWOT Analysis
- 12.1.3 Merck KGaA
- 12.1.3.1. Company Overview
- 12.1.3.2. Products
- 12.1.3.3. Company Financials
- 12.1.3.4. SWOT Analysis
- 12.1.4 TSI Inc
- 12.1.4.1. Company Overview
- 12.1.4.2. Products
- 12.1.4.3. Company Financials
- 12.1.4.4. SWOT Analysis
- 12.1.5 Thermo Fisher Scientific Inc
- 12.1.5.1. Company Overview
- 12.1.5.2. Products
- 12.1.5.3. Company Financials
- 12.1.5.4. SWOT Analysis
- 12.1.6 Aeroqual Limited*List Not Exhaustive
- 12.1.6.1. Company Overview
- 12.1.6.2. Products
- 12.1.6.3. Company Financials
- 12.1.6.4. SWOT Analysis
- 12.1.7 Emerson Electric Co
- 12.1.7.1. Company Overview
- 12.1.7.2. Products
- 12.1.7.3. Company Financials
- 12.1.7.4. SWOT Analysis
- 12.1.8 Siemens AG
- 12.1.8.1. Company Overview
- 12.1.8.2. Products
- 12.1.8.3. Company Financials
- 12.1.8.4. SWOT Analysis
- 12.1.9 Agilent Technologies Inc
- 12.1.9.1. Company Overview
- 12.1.9.2. Products
- 12.1.9.3. Company Financials
- 12.1.9.4. SWOT Analysis
- 12.1.10 3M Co
- 12.1.10.1. Company Overview
- 12.1.10.2. Products
- 12.1.10.3. Company Financials
- 12.1.10.4. SWOT Analysis
- 12.1.11 Teledyne Technologies Inc
- 12.1.11.1. Company Overview
- 12.1.11.2. Products
- 12.1.11.3. Company Financials
- 12.1.11.4. SWOT Analysis
- 12.1.1 Honeywell International Inc
- 12.2. Market Entropy
- 12.2.1 Company's Key Areas Served
- 12.2.2 Recent Developments
- 12.3. Company Market Share Analysis 2025
- 12.3.1 Top 5 Companies Market Share Analysis
- 12.3.2 Top 3 Companies Market Share Analysis
- 12.4. List of Potential Customers
- 13. Research Methodology
List of Figures
- Figure 1: Asia Pacific Air Quality Monitoring Market Revenue Breakdown (Million, %) by Product 2025 & 2033
- Figure 2: Asia Pacific Air Quality Monitoring Market Share (%) by Company 2025
List of Tables
- Table 1: Asia Pacific Air Quality Monitoring Market Revenue Million Forecast, by Product Type 2020 & 2033
- Table 2: Asia Pacific Air Quality Monitoring Market Revenue Million Forecast, by Sampling Method 2020 & 2033
- Table 3: Asia Pacific Air Quality Monitoring Market Revenue Million Forecast, by Pollutant Type 2020 & 2033
- Table 4: Asia Pacific Air Quality Monitoring Market Revenue Million Forecast, by End User 2020 & 2033
- Table 5: Asia Pacific Air Quality Monitoring Market Revenue Million Forecast, by Geography 2020 & 2033
- Table 6: Asia Pacific Air Quality Monitoring Market Revenue Million Forecast, by Region 2020 & 2033
- Table 7: Asia Pacific Air Quality Monitoring Market Revenue Million Forecast, by Product Type 2020 & 2033
- Table 8: Asia Pacific Air Quality Monitoring Market Revenue Million Forecast, by Sampling Method 2020 & 2033
- Table 9: Asia Pacific Air Quality Monitoring Market Revenue Million Forecast, by Pollutant Type 2020 & 2033
- Table 10: Asia Pacific Air Quality Monitoring Market Revenue Million Forecast, by End User 2020 & 2033
- Table 11: Asia Pacific Air Quality Monitoring Market Revenue Million Forecast, by Geography 2020 & 2033
- Table 12: Asia Pacific Air Quality Monitoring Market Revenue Million Forecast, by Country 2020 & 2033
- Table 13: Asia Pacific Air Quality Monitoring Market Revenue Million Forecast, by Product Type 2020 & 2033
- Table 14: Asia Pacific Air Quality Monitoring Market Revenue Million Forecast, by Sampling Method 2020 & 2033
- Table 15: Asia Pacific Air Quality Monitoring Market Revenue Million Forecast, by Pollutant Type 2020 & 2033
- Table 16: Asia Pacific Air Quality Monitoring Market Revenue Million Forecast, by End User 2020 & 2033
- Table 17: Asia Pacific Air Quality Monitoring Market Revenue Million Forecast, by Geography 2020 & 2033
- Table 18: Asia Pacific Air Quality Monitoring Market Revenue Million Forecast, by Country 2020 & 2033
- Table 19: Asia Pacific Air Quality Monitoring Market Revenue Million Forecast, by Product Type 2020 & 2033
- Table 20: Asia Pacific Air Quality Monitoring Market Revenue Million Forecast, by Sampling Method 2020 & 2033
- Table 21: Asia Pacific Air Quality Monitoring Market Revenue Million Forecast, by Pollutant Type 2020 & 2033
- Table 22: Asia Pacific Air Quality Monitoring Market Revenue Million Forecast, by End User 2020 & 2033
- Table 23: Asia Pacific Air Quality Monitoring Market Revenue Million Forecast, by Geography 2020 & 2033
- Table 24: Asia Pacific Air Quality Monitoring Market Revenue Million Forecast, by Country 2020 & 2033
- Table 25: Asia Pacific Air Quality Monitoring Market Revenue Million Forecast, by Product Type 2020 & 2033
- Table 26: Asia Pacific Air Quality Monitoring Market Revenue Million Forecast, by Sampling Method 2020 & 2033
- Table 27: Asia Pacific Air Quality Monitoring Market Revenue Million Forecast, by Pollutant Type 2020 & 2033
- Table 28: Asia Pacific Air Quality Monitoring Market Revenue Million Forecast, by End User 2020 & 2033
- Table 29: Asia Pacific Air Quality Monitoring Market Revenue Million Forecast, by Geography 2020 & 2033
- Table 30: Asia Pacific Air Quality Monitoring Market Revenue Million Forecast, by Country 2020 & 2033
- Table 31: Asia Pacific Air Quality Monitoring Market Revenue Million Forecast, by Product Type 2020 & 2033
- Table 32: Asia Pacific Air Quality Monitoring Market Revenue Million Forecast, by Sampling Method 2020 & 2033
- Table 33: Asia Pacific Air Quality Monitoring Market Revenue Million Forecast, by Pollutant Type 2020 & 2033
- Table 34: Asia Pacific Air Quality Monitoring Market Revenue Million Forecast, by End User 2020 & 2033
- Table 35: Asia Pacific Air Quality Monitoring Market Revenue Million Forecast, by Geography 2020 & 2033
- Table 36: Asia Pacific Air Quality Monitoring Market Revenue Million Forecast, by Country 2020 & 2033
Frequently Asked Questions
1. What is the projected Compound Annual Growth Rate (CAGR) of the Asia Pacific Air Quality Monitoring Market?
The projected CAGR is approximately 4.55%.
2. Which companies are prominent players in the Asia Pacific Air Quality Monitoring Market?
Key companies in the market include Honeywell International Inc, Horiba Ltd, Merck KGaA, TSI Inc, Thermo Fisher Scientific Inc, Aeroqual Limited*List Not Exhaustive, Emerson Electric Co, Siemens AG, Agilent Technologies Inc, 3M Co, Teledyne Technologies Inc.
3. What are the main segments of the Asia Pacific Air Quality Monitoring Market?
The market segments include Product Type, Sampling Method, Pollutant Type, End User, Geography.
4. Can you provide details about the market size?
The market size is estimated to be USD 77.40 Million as of 2022.
5. What are some drivers contributing to market growth?
4.; Increasing Awareness and Favorable Government Policies and Non-government Initiatives for Curbing Air Pollution.
6. What are the notable trends driving market growth?
Outdoor Segment to Witness Significant Growth.
7. Are there any restraints impacting market growth?
4.; High Costs of Air Quality Monitoring Systems.
8. Can you provide examples of recent developments in the market?
Januaru 2023: The government of India launched the Technology for Air Quality Monitoring System (AI-AQMS v1.0) developed under MeitY-supported projects. The Centre for Development of Advanced Computing (C-DAC), Kolkata, in partnership with TeXMIN, ISM, Dhanbad under the ‘National program on Electronics and ICT applications in Agriculture and Environment (AgriEnIcs)’ has developed an outdoor air quality monitoring station to monitor environmental pollutants which includes parameters like PM 1.0, PM 2.5, PM 10.0, SO2, NO2, CO, O2, ambient temperature, relative humidity etc., for continuous air quality analysis of the environment.
9. What pricing options are available for accessing the report?
Pricing options include single-user, multi-user, and enterprise licenses priced at USD 4750, USD 5250, and USD 8750 respectively.
10. Is the market size provided in terms of value or volume?
The market size is provided in terms of value, measured in Million.
11. Are there any specific market keywords associated with the report?
Yes, the market keyword associated with the report is "Asia Pacific Air Quality Monitoring Market," which aids in identifying and referencing the specific market segment covered.
12. How do I determine which pricing option suits my needs best?
The pricing options vary based on user requirements and access needs. Individual users may opt for single-user licenses, while businesses requiring broader access may choose multi-user or enterprise licenses for cost-effective access to the report.
13. Are there any additional resources or data provided in the Asia Pacific Air Quality Monitoring Market report?
While the report offers comprehensive insights, it's advisable to review the specific contents or supplementary materials provided to ascertain if additional resources or data are available.
14. How can I stay updated on further developments or reports in the Asia Pacific Air Quality Monitoring Market?
To stay informed about further developments, trends, and reports in the Asia Pacific Air Quality Monitoring Market, consider subscribing to industry newsletters, following relevant companies and organizations, or regularly checking reputable industry news sources and publications.
Methodology
Step 1 - Identification of Relevant Samples Size from Population Database


Step 2 - Approaches for Defining Global Market Size (Value, Volume* & Price*)

Note*: In applicable scenarios
Step 3 - Data Sources
Primary Research
- Web Analytics
- Survey Reports
- Research Institute
- Latest Research Reports
- Opinion Leaders
Secondary Research
- Annual Reports
- White Paper
- Latest Press Release
- Industry Association
- Paid Database
- Investor Presentations

Step 4 - Data Triangulation
Involves using different sources of information in order to increase the validity of a study
These sources are likely to be stakeholders in a program - participants, other researchers, program staff, other community members, and so on.
Then we put all data in single framework & apply various statistical tools to find out the dynamic on the market.
During the analysis stage, feedback from the stakeholder groups would be compared to determine areas of agreement as well as areas of divergence