

Key Insights
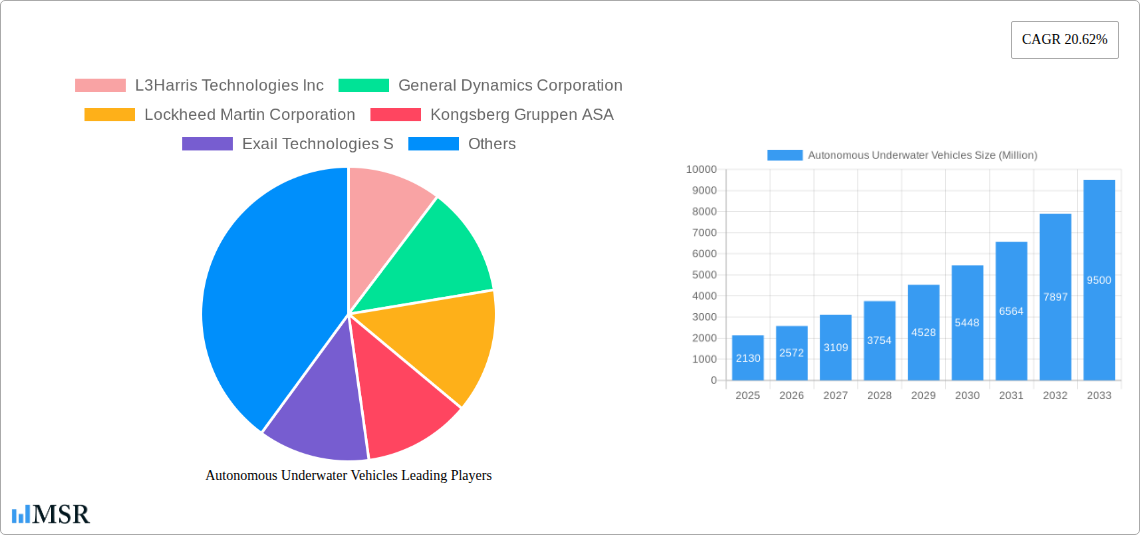
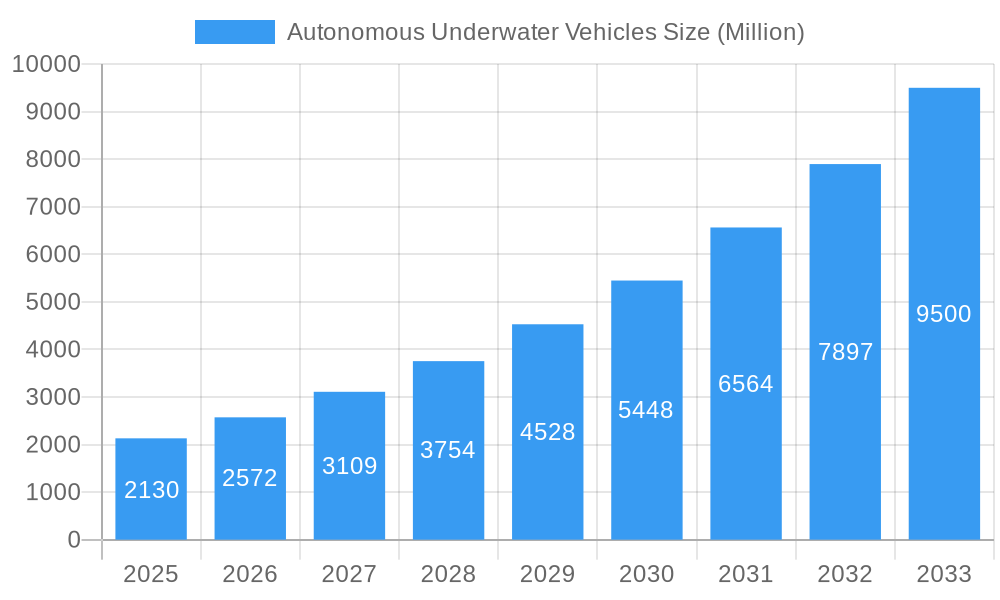
The Autonomous Underwater Vehicle (AUV) market is experiencing robust growth, projected to reach \$2.13 billion in 2025 and exhibiting a Compound Annual Growth Rate (CAGR) of 20.62% from 2025 to 2033. This expansion is driven by several key factors. Firstly, increasing demand for AUVs in military and defense applications, including mine countermeasures, surveillance, and anti-submarine warfare, significantly fuels market growth. Secondly, the burgeoning oil and gas industry relies heavily on AUVs for underwater infrastructure inspection, pipeline surveys, and subsea exploration, contributing substantially to market demand. Furthermore, growing environmental concerns are prompting increased use of AUVs for oceanographic research, environmental monitoring, and pollution detection. The advancements in sensor technology, improved navigation systems, and miniaturization of AUVs are also contributing factors. The market is segmented by application (military & defense, oil & gas, environmental protection, oceanography, archaeology, search & salvage) and by type (small, medium, large), each segment exhibiting unique growth trajectories influenced by specific technological advancements and application needs. The competitive landscape features established players like L3Harris Technologies, General Dynamics, Lockheed Martin, and Kongsberg Gruppen, among others, constantly innovating to capture market share.
Autonomous Underwater Vehicles Market Size (In Billion)
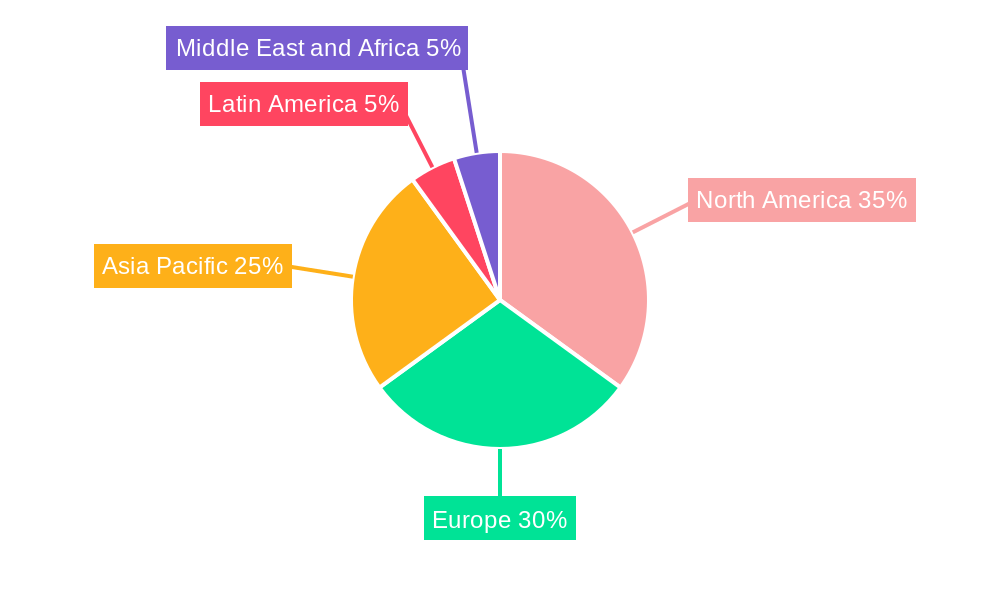
The geographical distribution of the AUV market is diverse, with North America and Europe currently holding significant market share. However, the Asia-Pacific region is anticipated to witness substantial growth driven by increasing investments in marine infrastructure, research activities, and a rising demand for advanced underwater technologies. While the market faces certain restraints, such as the high initial investment cost associated with AUV deployment and maintenance and the need for skilled personnel, the overall growth trajectory remains optimistic. Continuous technological advancements, coupled with the expanding applications across various sectors, are expected to overcome these challenges, ensuring the continued expansion of the AUV market throughout the forecast period.
Autonomous Underwater Vehicles Company Market Share
Autonomous Underwater Vehicles (AUV) Market Report: 2019-2033
This comprehensive report provides a detailed analysis of the Autonomous Underwater Vehicles (AUV) market, offering invaluable insights for industry stakeholders, investors, and researchers. The study covers the period 2019-2033, with a focus on the forecast period 2025-2033 and a base year of 2025. The report projects a market valued at $XX Million by 2033, exhibiting a Compound Annual Growth Rate (CAGR) of XX%. This in-depth analysis explores key market segments, leading players, and emerging trends shaping the future of AUV technology.
Autonomous Underwater Vehicles Market Concentration & Dynamics
The global AUV market exhibits a moderately concentrated structure, with key players like L3Harris Technologies Inc, General Dynamics Corporation, Lockheed Martin Corporation, Kongsberg Gruppen ASA, Exail Technologies S, SAAB AB, BAE Systems plc, Teledyne Technologies Inc, and The Boeing Company holding significant market share. The market share of the top 5 companies is estimated at XX% in 2025. Innovation is driven by ongoing R&D efforts focusing on enhanced autonomy, improved sensor technologies, and increased operational range. Regulatory frameworks vary by region, impacting operational permits and data collection standards. Substitute products are limited, with remotely operated vehicles (ROVs) representing the primary alternative. End-user trends indicate a growing demand for AUVs across various sectors, fueled by the increasing need for efficient and cost-effective solutions for underwater operations. M&A activity in the sector remains moderate, with an estimated XX merger and acquisition deals occurring between 2019 and 2024. This reflects a strategic push by established players to expand their technological capabilities and market reach.
Autonomous Underwater Vehicles Industry Insights & Trends
The AUV market is experiencing robust growth, driven by several factors. The global market size was valued at $XX Million in 2024 and is projected to reach $XX Million by 2033. This growth is fueled by increasing demand from the military & defense sector, the expanding oil & gas exploration activities, and the rising need for environmental monitoring and oceanographic research. Technological advancements, such as the development of advanced sensors, improved navigation systems, and enhanced AI capabilities, are further propelling market expansion. Consumer behavior reflects a growing preference for autonomous solutions that offer higher efficiency, reduced operational costs, and improved safety compared to traditional methods. The integration of AUVs with other technologies, such as unmanned surface vessels (USVs) and underwater communication networks, is also creating new opportunities and accelerating market growth.
Key Markets & Segments Leading Autonomous Underwater Vehicles
Dominant Regions/Segments: The North American region is currently the leading market for AUVs, driven by strong government investment in defense and security applications as well as a robust oil and gas sector. However, the Asia-Pacific region is expected to witness the fastest growth in the forecast period due to increasing investments in infrastructure development and marine resource exploration.
By Application:
- Military & Defense: High demand for AUV for surveillance, mine countermeasures, and anti-submarine warfare.
- Oil & Gas: Growing adoption for pipeline inspection, subsea infrastructure surveys, and exploration activities.
- Environment Protection & Monitoring: Use in oceanographic research, pollution monitoring, and biodiversity assessment.
- Oceanography: Essential for deep-sea exploration, oceanographic mapping, and climate change research.
- Archaeology & Exploration: Utilizing AUVs for wreck discovery, underwater site surveys, and historical artifact recovery.
- Search & Salvage Operations: Increasingly used for locating and recovering lost objects or vessels.
By Type:
- Medium-sized AUVs dominate the market due to their versatility, balancing capability and cost-effectiveness.
- Small AUVs are gaining traction due to their ease of deployment and use in shallow water applications.
- Large AUVs are used for specific high-demand operations, but the market is relatively smaller due to high costs and operation limitations.
Drivers: Strong economic growth in key regions, substantial investment in marine infrastructure projects, and increasing government funding for research and development activities are driving the adoption of AUVs across these segments.
Autonomous Underwater Vehicles Product Developments
Recent innovations in AUV technology include advancements in battery technology enabling longer operational endurance, development of more sophisticated sensor packages for improved data acquisition, and the integration of AI and machine learning algorithms for enhanced autonomy and decision-making. These improvements are leading to increased operational efficiency, improved data quality, and the expansion of AUV applications across various sectors. The competitive edge lies in offering superior autonomy, extended operational range, advanced sensor capabilities, and robust data processing and analysis tools.
Challenges in the Autonomous Underwater Vehicles Market
Significant challenges include stringent regulatory frameworks governing underwater operations in different regions, potential supply chain disruptions affecting the availability of critical components, and the intensifying competition among established players and emerging startups. These factors can impact market growth and profitability. Estimates suggest that regulatory hurdles alone delay project timelines by an average of XX months, resulting in a $XX Million loss in projected revenue annually.
Forces Driving Autonomous Underwater Vehicles Growth
Technological advancements, increasing government funding for defense and scientific research, rising demand for efficient underwater operations in the oil & gas sector and environmental monitoring, growing focus on underwater infrastructure development, and the potential for AUVs in new applications (e.g., aquaculture, underwater construction) drive market growth.
Long-Term Growth Catalysts in Autonomous Underwater Vehicles
Long-term growth hinges on continued technological innovation, strategic partnerships between technology developers and end-users, and the expansion of AUV applications into new sectors. The development of more energy-efficient systems and the integration of AUVs into broader underwater robotic systems promise continued market expansion.
Emerging Opportunities in Autonomous Underwater Vehicles
Emerging opportunities include the development of specialized AUVs for specific applications (e.g., AUVs for deep-sea mining, AUVs with advanced underwater communication capabilities), the expansion of the AUV market in developing countries, and increased demand for AUV services in the renewable energy sector (e.g., offshore wind farm inspection).
Leading Players in the Autonomous Underwater Vehicles Sector
Key Milestones in Autonomous Underwater Vehicles Industry
- July 2023: L3Harris Technologies Inc. successfully completed the first fully autonomous launch and recovery of an AUV from an underway submarine using its Iver4 AUV technology, demonstrating significant advancements in AUV operational capabilities.
- February 2024: Kongsberg Gruppen ASA secured a contract with the Defense Innovation Unit (DIU) to provide HUGIN AUV capabilities to the US military, highlighting the growing demand for AUVs in defense applications.
Strategic Outlook for Autonomous Underwater Vehicles Market
The AUV market is poised for substantial growth, driven by continuous technological advancements, expanding applications across various sectors, and increasing government and private investment. Strategic opportunities exist for companies focusing on innovation, developing specialized AUV solutions, and forging strategic partnerships to capture market share in this dynamic and expanding market. The long-term outlook remains positive, with projections indicating significant market expansion throughout the forecast period.
Autonomous Underwater Vehicles Segmentation
- 1. Production Analysis
- 2. Consumption Analysis
- 3. Import Market Analysis (Value & Volume)
- 4. Export Market Analysis (Value & Volume)
- 5. Price Trend Analysis
Autonomous Underwater Vehicles Segmentation By Geography
-
1. North America
- 1.1. United States
- 1.2. Canada
- 1.3. Mexico
-
2. South America
- 2.1. Brazil
- 2.2. Argentina
- 2.3. Rest of South America
-
3. Europe
- 3.1. United Kingdom
- 3.2. Germany
- 3.3. France
- 3.4. Italy
- 3.5. Spain
- 3.6. Russia
- 3.7. Benelux
- 3.8. Nordics
- 3.9. Rest of Europe
-
4. Middle East & Africa
- 4.1. Turkey
- 4.2. Israel
- 4.3. GCC
- 4.4. North Africa
- 4.5. South Africa
- 4.6. Rest of Middle East & Africa
-
5. Asia Pacific
- 5.1. China
- 5.2. India
- 5.3. Japan
- 5.4. South Korea
- 5.5. ASEAN
- 5.6. Oceania
- 5.7. Rest of Asia Pacific
Autonomous Underwater Vehicles Regional Market Share
Geographic Coverage of Autonomous Underwater Vehicles
Autonomous Underwater Vehicles REPORT HIGHLIGHTS
| Aspects | Details |
|---|---|
| Study Period | 2020-2034 |
| Base Year | 2025 |
| Estimated Year | 2026 |
| Forecast Period | 2026-2034 |
| Historical Period | 2020-2025 |
| Growth Rate | CAGR of 20.62% from 2020-2034 |
| Segmentation |
|
Table of Contents
- 1. Introduction
- 1.1. Research Scope
- 1.2. Market Segmentation
- 1.3. Research Objective
- 1.4. Definitions and Assumptions
- 2. Executive Summary
- 2.1. Market Snapshot
- 3. Market Dynamics
- 3.1. Market Drivers
- 3.2. Market Restrains
- 3.3. Market Trends
- 3.4. Market Opportunities
- 4. Market Factor Analysis
- 4.1. Porters Five Forces
- 4.1.1. Bargaining Power of Suppliers
- 4.1.2. Bargaining Power of Buyers
- 4.1.3. Threat of New Entrants
- 4.1.4. Threat of Substitutes
- 4.1.5. Competitive Rivalry
- 4.2. PESTEL analysis
- 4.3. BCG Analysis
- 4.3.1. Stars (High Growth, High Market Share)
- 4.3.2. Cash Cows (Low Growth, High Market Share)
- 4.3.3. Question Mark (High Growth, Low Market Share)
- 4.3.4. Dogs (Low Growth, Low Market Share)
- 4.4. Ansoff Matrix Analysis
- 4.5. Supply Chain Analysis
- 4.6. Regulatory Landscape
- 4.7. Current Market Potential and Opportunity Assessment (TAM–SAM–SOM Framework)
- 4.8. MSR Analyst Note
- 4.1. Porters Five Forces
- 5. Market Analysis, Insights and Forecast 2021-2033
- 5.1. Market Analysis, Insights and Forecast - by Production Analysis
- 5.2. Market Analysis, Insights and Forecast - by Consumption Analysis
- 5.3. Market Analysis, Insights and Forecast - by Import Market Analysis (Value & Volume)
- 5.4. Market Analysis, Insights and Forecast - by Export Market Analysis (Value & Volume)
- 5.5. Market Analysis, Insights and Forecast - by Price Trend Analysis
- 5.6. Market Analysis, Insights and Forecast - by Region
- 5.6.1. North America
- 5.6.2. South America
- 5.6.3. Europe
- 5.6.4. Middle East & Africa
- 5.6.5. Asia Pacific
- 6. Global Autonomous Underwater Vehicles Analysis, Insights and Forecast, 2021-2033
- 6.1. Market Analysis, Insights and Forecast - by Production Analysis
- 6.2. Market Analysis, Insights and Forecast - by Consumption Analysis
- 6.3. Market Analysis, Insights and Forecast - by Import Market Analysis (Value & Volume)
- 6.4. Market Analysis, Insights and Forecast - by Export Market Analysis (Value & Volume)
- 6.5. Market Analysis, Insights and Forecast - by Price Trend Analysis
- 7. North America Autonomous Underwater Vehicles Analysis, Insights and Forecast, 2020-2032
- 7.1. Market Analysis, Insights and Forecast - by Production Analysis
- 7.2. Market Analysis, Insights and Forecast - by Consumption Analysis
- 7.3. Market Analysis, Insights and Forecast - by Import Market Analysis (Value & Volume)
- 7.4. Market Analysis, Insights and Forecast - by Export Market Analysis (Value & Volume)
- 7.5. Market Analysis, Insights and Forecast - by Price Trend Analysis
- 8. South America Autonomous Underwater Vehicles Analysis, Insights and Forecast, 2020-2032
- 8.1. Market Analysis, Insights and Forecast - by Production Analysis
- 8.2. Market Analysis, Insights and Forecast - by Consumption Analysis
- 8.3. Market Analysis, Insights and Forecast - by Import Market Analysis (Value & Volume)
- 8.4. Market Analysis, Insights and Forecast - by Export Market Analysis (Value & Volume)
- 8.5. Market Analysis, Insights and Forecast - by Price Trend Analysis
- 9. Europe Autonomous Underwater Vehicles Analysis, Insights and Forecast, 2020-2032
- 9.1. Market Analysis, Insights and Forecast - by Production Analysis
- 9.2. Market Analysis, Insights and Forecast - by Consumption Analysis
- 9.3. Market Analysis, Insights and Forecast - by Import Market Analysis (Value & Volume)
- 9.4. Market Analysis, Insights and Forecast - by Export Market Analysis (Value & Volume)
- 9.5. Market Analysis, Insights and Forecast - by Price Trend Analysis
- 10. Middle East & Africa Autonomous Underwater Vehicles Analysis, Insights and Forecast, 2020-2032
- 10.1. Market Analysis, Insights and Forecast - by Production Analysis
- 10.2. Market Analysis, Insights and Forecast - by Consumption Analysis
- 10.3. Market Analysis, Insights and Forecast - by Import Market Analysis (Value & Volume)
- 10.4. Market Analysis, Insights and Forecast - by Export Market Analysis (Value & Volume)
- 10.5. Market Analysis, Insights and Forecast - by Price Trend Analysis
- 11. Asia Pacific Autonomous Underwater Vehicles Analysis, Insights and Forecast, 2020-2032
- 11.1. Market Analysis, Insights and Forecast - by Production Analysis
- 11.2. Market Analysis, Insights and Forecast - by Consumption Analysis
- 11.3. Market Analysis, Insights and Forecast - by Import Market Analysis (Value & Volume)
- 11.4. Market Analysis, Insights and Forecast - by Export Market Analysis (Value & Volume)
- 11.5. Market Analysis, Insights and Forecast - by Price Trend Analysis
- 12. Competitive Analysis
- 12.1. Company Profiles
- 12.1.1 L3Harris Technologies Inc
- 12.1.1.1. Company Overview
- 12.1.1.2. Products
- 12.1.1.3. Company Financials
- 12.1.1.4. SWOT Analysis
- 12.1.2 General Dynamics Corporation
- 12.1.2.1. Company Overview
- 12.1.2.2. Products
- 12.1.2.3. Company Financials
- 12.1.2.4. SWOT Analysis
- 12.1.3 Lockheed Martin Corporation
- 12.1.3.1. Company Overview
- 12.1.3.2. Products
- 12.1.3.3. Company Financials
- 12.1.3.4. SWOT Analysis
- 12.1.4 Kongsberg Gruppen ASA
- 12.1.4.1. Company Overview
- 12.1.4.2. Products
- 12.1.4.3. Company Financials
- 12.1.4.4. SWOT Analysis
- 12.1.5 Exail Technologies S
- 12.1.5.1. Company Overview
- 12.1.5.2. Products
- 12.1.5.3. Company Financials
- 12.1.5.4. SWOT Analysis
- 12.1.6 SAAB AB
- 12.1.6.1. Company Overview
- 12.1.6.2. Products
- 12.1.6.3. Company Financials
- 12.1.6.4. SWOT Analysis
- 12.1.7 BAE Systems plc
- 12.1.7.1. Company Overview
- 12.1.7.2. Products
- 12.1.7.3. Company Financials
- 12.1.7.4. SWOT Analysis
- 12.1.8 Teledyne Technologies Inc
- 12.1.8.1. Company Overview
- 12.1.8.2. Products
- 12.1.8.3. Company Financials
- 12.1.8.4. SWOT Analysis
- 12.1.9 The Boeing Company
- 12.1.9.1. Company Overview
- 12.1.9.2. Products
- 12.1.9.3. Company Financials
- 12.1.9.4. SWOT Analysis
- 12.1.1 L3Harris Technologies Inc
- 12.2. Market Entropy
- 12.2.1 Company's Key Areas Served
- 12.2.2 Recent Developments
- 12.3. Company Market Share Analysis 2025
- 12.3.1 Top 5 Companies Market Share Analysis
- 12.3.2 Top 3 Companies Market Share Analysis
- 12.4. List of Potential Customers
- 13. Research Methodology
List of Figures
- Figure 1: Global Autonomous Underwater Vehicles Revenue Breakdown (billion, %) by Region 2025 & 2033
- Figure 2: North America Autonomous Underwater Vehicles Revenue (billion), by Production Analysis 2025 & 2033
- Figure 3: North America Autonomous Underwater Vehicles Revenue Share (%), by Production Analysis 2025 & 2033
- Figure 4: North America Autonomous Underwater Vehicles Revenue (billion), by Consumption Analysis 2025 & 2033
- Figure 5: North America Autonomous Underwater Vehicles Revenue Share (%), by Consumption Analysis 2025 & 2033
- Figure 6: North America Autonomous Underwater Vehicles Revenue (billion), by Import Market Analysis (Value & Volume) 2025 & 2033
- Figure 7: North America Autonomous Underwater Vehicles Revenue Share (%), by Import Market Analysis (Value & Volume) 2025 & 2033
- Figure 8: North America Autonomous Underwater Vehicles Revenue (billion), by Export Market Analysis (Value & Volume) 2025 & 2033
- Figure 9: North America Autonomous Underwater Vehicles Revenue Share (%), by Export Market Analysis (Value & Volume) 2025 & 2033
- Figure 10: North America Autonomous Underwater Vehicles Revenue (billion), by Price Trend Analysis 2025 & 2033
- Figure 11: North America Autonomous Underwater Vehicles Revenue Share (%), by Price Trend Analysis 2025 & 2033
- Figure 12: North America Autonomous Underwater Vehicles Revenue (billion), by Country 2025 & 2033
- Figure 13: North America Autonomous Underwater Vehicles Revenue Share (%), by Country 2025 & 2033
- Figure 14: South America Autonomous Underwater Vehicles Revenue (billion), by Production Analysis 2025 & 2033
- Figure 15: South America Autonomous Underwater Vehicles Revenue Share (%), by Production Analysis 2025 & 2033
- Figure 16: South America Autonomous Underwater Vehicles Revenue (billion), by Consumption Analysis 2025 & 2033
- Figure 17: South America Autonomous Underwater Vehicles Revenue Share (%), by Consumption Analysis 2025 & 2033
- Figure 18: South America Autonomous Underwater Vehicles Revenue (billion), by Import Market Analysis (Value & Volume) 2025 & 2033
- Figure 19: South America Autonomous Underwater Vehicles Revenue Share (%), by Import Market Analysis (Value & Volume) 2025 & 2033
- Figure 20: South America Autonomous Underwater Vehicles Revenue (billion), by Export Market Analysis (Value & Volume) 2025 & 2033
- Figure 21: South America Autonomous Underwater Vehicles Revenue Share (%), by Export Market Analysis (Value & Volume) 2025 & 2033
- Figure 22: South America Autonomous Underwater Vehicles Revenue (billion), by Price Trend Analysis 2025 & 2033
- Figure 23: South America Autonomous Underwater Vehicles Revenue Share (%), by Price Trend Analysis 2025 & 2033
- Figure 24: South America Autonomous Underwater Vehicles Revenue (billion), by Country 2025 & 2033
- Figure 25: South America Autonomous Underwater Vehicles Revenue Share (%), by Country 2025 & 2033
- Figure 26: Europe Autonomous Underwater Vehicles Revenue (billion), by Production Analysis 2025 & 2033
- Figure 27: Europe Autonomous Underwater Vehicles Revenue Share (%), by Production Analysis 2025 & 2033
- Figure 28: Europe Autonomous Underwater Vehicles Revenue (billion), by Consumption Analysis 2025 & 2033
- Figure 29: Europe Autonomous Underwater Vehicles Revenue Share (%), by Consumption Analysis 2025 & 2033
- Figure 30: Europe Autonomous Underwater Vehicles Revenue (billion), by Import Market Analysis (Value & Volume) 2025 & 2033
- Figure 31: Europe Autonomous Underwater Vehicles Revenue Share (%), by Import Market Analysis (Value & Volume) 2025 & 2033
- Figure 32: Europe Autonomous Underwater Vehicles Revenue (billion), by Export Market Analysis (Value & Volume) 2025 & 2033
- Figure 33: Europe Autonomous Underwater Vehicles Revenue Share (%), by Export Market Analysis (Value & Volume) 2025 & 2033
- Figure 34: Europe Autonomous Underwater Vehicles Revenue (billion), by Price Trend Analysis 2025 & 2033
- Figure 35: Europe Autonomous Underwater Vehicles Revenue Share (%), by Price Trend Analysis 2025 & 2033
- Figure 36: Europe Autonomous Underwater Vehicles Revenue (billion), by Country 2025 & 2033
- Figure 37: Europe Autonomous Underwater Vehicles Revenue Share (%), by Country 2025 & 2033
- Figure 38: Middle East & Africa Autonomous Underwater Vehicles Revenue (billion), by Production Analysis 2025 & 2033
- Figure 39: Middle East & Africa Autonomous Underwater Vehicles Revenue Share (%), by Production Analysis 2025 & 2033
- Figure 40: Middle East & Africa Autonomous Underwater Vehicles Revenue (billion), by Consumption Analysis 2025 & 2033
- Figure 41: Middle East & Africa Autonomous Underwater Vehicles Revenue Share (%), by Consumption Analysis 2025 & 2033
- Figure 42: Middle East & Africa Autonomous Underwater Vehicles Revenue (billion), by Import Market Analysis (Value & Volume) 2025 & 2033
- Figure 43: Middle East & Africa Autonomous Underwater Vehicles Revenue Share (%), by Import Market Analysis (Value & Volume) 2025 & 2033
- Figure 44: Middle East & Africa Autonomous Underwater Vehicles Revenue (billion), by Export Market Analysis (Value & Volume) 2025 & 2033
- Figure 45: Middle East & Africa Autonomous Underwater Vehicles Revenue Share (%), by Export Market Analysis (Value & Volume) 2025 & 2033
- Figure 46: Middle East & Africa Autonomous Underwater Vehicles Revenue (billion), by Price Trend Analysis 2025 & 2033
- Figure 47: Middle East & Africa Autonomous Underwater Vehicles Revenue Share (%), by Price Trend Analysis 2025 & 2033
- Figure 48: Middle East & Africa Autonomous Underwater Vehicles Revenue (billion), by Country 2025 & 2033
- Figure 49: Middle East & Africa Autonomous Underwater Vehicles Revenue Share (%), by Country 2025 & 2033
- Figure 50: Asia Pacific Autonomous Underwater Vehicles Revenue (billion), by Production Analysis 2025 & 2033
- Figure 51: Asia Pacific Autonomous Underwater Vehicles Revenue Share (%), by Production Analysis 2025 & 2033
- Figure 52: Asia Pacific Autonomous Underwater Vehicles Revenue (billion), by Consumption Analysis 2025 & 2033
- Figure 53: Asia Pacific Autonomous Underwater Vehicles Revenue Share (%), by Consumption Analysis 2025 & 2033
- Figure 54: Asia Pacific Autonomous Underwater Vehicles Revenue (billion), by Import Market Analysis (Value & Volume) 2025 & 2033
- Figure 55: Asia Pacific Autonomous Underwater Vehicles Revenue Share (%), by Import Market Analysis (Value & Volume) 2025 & 2033
- Figure 56: Asia Pacific Autonomous Underwater Vehicles Revenue (billion), by Export Market Analysis (Value & Volume) 2025 & 2033
- Figure 57: Asia Pacific Autonomous Underwater Vehicles Revenue Share (%), by Export Market Analysis (Value & Volume) 2025 & 2033
- Figure 58: Asia Pacific Autonomous Underwater Vehicles Revenue (billion), by Price Trend Analysis 2025 & 2033
- Figure 59: Asia Pacific Autonomous Underwater Vehicles Revenue Share (%), by Price Trend Analysis 2025 & 2033
- Figure 60: Asia Pacific Autonomous Underwater Vehicles Revenue (billion), by Country 2025 & 2033
- Figure 61: Asia Pacific Autonomous Underwater Vehicles Revenue Share (%), by Country 2025 & 2033
List of Tables
- Table 1: Global Autonomous Underwater Vehicles Revenue billion Forecast, by Production Analysis 2020 & 2033
- Table 2: Global Autonomous Underwater Vehicles Revenue billion Forecast, by Consumption Analysis 2020 & 2033
- Table 3: Global Autonomous Underwater Vehicles Revenue billion Forecast, by Import Market Analysis (Value & Volume) 2020 & 2033
- Table 4: Global Autonomous Underwater Vehicles Revenue billion Forecast, by Export Market Analysis (Value & Volume) 2020 & 2033
- Table 5: Global Autonomous Underwater Vehicles Revenue billion Forecast, by Price Trend Analysis 2020 & 2033
- Table 6: Global Autonomous Underwater Vehicles Revenue billion Forecast, by Region 2020 & 2033
- Table 7: Global Autonomous Underwater Vehicles Revenue billion Forecast, by Production Analysis 2020 & 2033
- Table 8: Global Autonomous Underwater Vehicles Revenue billion Forecast, by Consumption Analysis 2020 & 2033
- Table 9: Global Autonomous Underwater Vehicles Revenue billion Forecast, by Import Market Analysis (Value & Volume) 2020 & 2033
- Table 10: Global Autonomous Underwater Vehicles Revenue billion Forecast, by Export Market Analysis (Value & Volume) 2020 & 2033
- Table 11: Global Autonomous Underwater Vehicles Revenue billion Forecast, by Price Trend Analysis 2020 & 2033
- Table 12: Global Autonomous Underwater Vehicles Revenue billion Forecast, by Country 2020 & 2033
- Table 13: United States Autonomous Underwater Vehicles Revenue (billion) Forecast, by Application 2020 & 2033
- Table 14: Canada Autonomous Underwater Vehicles Revenue (billion) Forecast, by Application 2020 & 2033
- Table 15: Mexico Autonomous Underwater Vehicles Revenue (billion) Forecast, by Application 2020 & 2033
- Table 16: Global Autonomous Underwater Vehicles Revenue billion Forecast, by Production Analysis 2020 & 2033
- Table 17: Global Autonomous Underwater Vehicles Revenue billion Forecast, by Consumption Analysis 2020 & 2033
- Table 18: Global Autonomous Underwater Vehicles Revenue billion Forecast, by Import Market Analysis (Value & Volume) 2020 & 2033
- Table 19: Global Autonomous Underwater Vehicles Revenue billion Forecast, by Export Market Analysis (Value & Volume) 2020 & 2033
- Table 20: Global Autonomous Underwater Vehicles Revenue billion Forecast, by Price Trend Analysis 2020 & 2033
- Table 21: Global Autonomous Underwater Vehicles Revenue billion Forecast, by Country 2020 & 2033
- Table 22: Brazil Autonomous Underwater Vehicles Revenue (billion) Forecast, by Application 2020 & 2033
- Table 23: Argentina Autonomous Underwater Vehicles Revenue (billion) Forecast, by Application 2020 & 2033
- Table 24: Rest of South America Autonomous Underwater Vehicles Revenue (billion) Forecast, by Application 2020 & 2033
- Table 25: Global Autonomous Underwater Vehicles Revenue billion Forecast, by Production Analysis 2020 & 2033
- Table 26: Global Autonomous Underwater Vehicles Revenue billion Forecast, by Consumption Analysis 2020 & 2033
- Table 27: Global Autonomous Underwater Vehicles Revenue billion Forecast, by Import Market Analysis (Value & Volume) 2020 & 2033
- Table 28: Global Autonomous Underwater Vehicles Revenue billion Forecast, by Export Market Analysis (Value & Volume) 2020 & 2033
- Table 29: Global Autonomous Underwater Vehicles Revenue billion Forecast, by Price Trend Analysis 2020 & 2033
- Table 30: Global Autonomous Underwater Vehicles Revenue billion Forecast, by Country 2020 & 2033
- Table 31: United Kingdom Autonomous Underwater Vehicles Revenue (billion) Forecast, by Application 2020 & 2033
- Table 32: Germany Autonomous Underwater Vehicles Revenue (billion) Forecast, by Application 2020 & 2033
- Table 33: France Autonomous Underwater Vehicles Revenue (billion) Forecast, by Application 2020 & 2033
- Table 34: Italy Autonomous Underwater Vehicles Revenue (billion) Forecast, by Application 2020 & 2033
- Table 35: Spain Autonomous Underwater Vehicles Revenue (billion) Forecast, by Application 2020 & 2033
- Table 36: Russia Autonomous Underwater Vehicles Revenue (billion) Forecast, by Application 2020 & 2033
- Table 37: Benelux Autonomous Underwater Vehicles Revenue (billion) Forecast, by Application 2020 & 2033
- Table 38: Nordics Autonomous Underwater Vehicles Revenue (billion) Forecast, by Application 2020 & 2033
- Table 39: Rest of Europe Autonomous Underwater Vehicles Revenue (billion) Forecast, by Application 2020 & 2033
- Table 40: Global Autonomous Underwater Vehicles Revenue billion Forecast, by Production Analysis 2020 & 2033
- Table 41: Global Autonomous Underwater Vehicles Revenue billion Forecast, by Consumption Analysis 2020 & 2033
- Table 42: Global Autonomous Underwater Vehicles Revenue billion Forecast, by Import Market Analysis (Value & Volume) 2020 & 2033
- Table 43: Global Autonomous Underwater Vehicles Revenue billion Forecast, by Export Market Analysis (Value & Volume) 2020 & 2033
- Table 44: Global Autonomous Underwater Vehicles Revenue billion Forecast, by Price Trend Analysis 2020 & 2033
- Table 45: Global Autonomous Underwater Vehicles Revenue billion Forecast, by Country 2020 & 2033
- Table 46: Turkey Autonomous Underwater Vehicles Revenue (billion) Forecast, by Application 2020 & 2033
- Table 47: Israel Autonomous Underwater Vehicles Revenue (billion) Forecast, by Application 2020 & 2033
- Table 48: GCC Autonomous Underwater Vehicles Revenue (billion) Forecast, by Application 2020 & 2033
- Table 49: North Africa Autonomous Underwater Vehicles Revenue (billion) Forecast, by Application 2020 & 2033
- Table 50: South Africa Autonomous Underwater Vehicles Revenue (billion) Forecast, by Application 2020 & 2033
- Table 51: Rest of Middle East & Africa Autonomous Underwater Vehicles Revenue (billion) Forecast, by Application 2020 & 2033
- Table 52: Global Autonomous Underwater Vehicles Revenue billion Forecast, by Production Analysis 2020 & 2033
- Table 53: Global Autonomous Underwater Vehicles Revenue billion Forecast, by Consumption Analysis 2020 & 2033
- Table 54: Global Autonomous Underwater Vehicles Revenue billion Forecast, by Import Market Analysis (Value & Volume) 2020 & 2033
- Table 55: Global Autonomous Underwater Vehicles Revenue billion Forecast, by Export Market Analysis (Value & Volume) 2020 & 2033
- Table 56: Global Autonomous Underwater Vehicles Revenue billion Forecast, by Price Trend Analysis 2020 & 2033
- Table 57: Global Autonomous Underwater Vehicles Revenue billion Forecast, by Country 2020 & 2033
- Table 58: China Autonomous Underwater Vehicles Revenue (billion) Forecast, by Application 2020 & 2033
- Table 59: India Autonomous Underwater Vehicles Revenue (billion) Forecast, by Application 2020 & 2033
- Table 60: Japan Autonomous Underwater Vehicles Revenue (billion) Forecast, by Application 2020 & 2033
- Table 61: South Korea Autonomous Underwater Vehicles Revenue (billion) Forecast, by Application 2020 & 2033
- Table 62: ASEAN Autonomous Underwater Vehicles Revenue (billion) Forecast, by Application 2020 & 2033
- Table 63: Oceania Autonomous Underwater Vehicles Revenue (billion) Forecast, by Application 2020 & 2033
- Table 64: Rest of Asia Pacific Autonomous Underwater Vehicles Revenue (billion) Forecast, by Application 2020 & 2033
Frequently Asked Questions
1. What is the projected Compound Annual Growth Rate (CAGR) of the Autonomous Underwater Vehicles?
The projected CAGR is approximately 20.62%.
2. Which companies are prominent players in the Autonomous Underwater Vehicles?
Key companies in the market include L3Harris Technologies Inc, General Dynamics Corporation, Lockheed Martin Corporation, Kongsberg Gruppen ASA, Exail Technologies S, SAAB AB, BAE Systems plc, Teledyne Technologies Inc, The Boeing Company.
3. What are the main segments of the Autonomous Underwater Vehicles?
The market segments include Production Analysis, Consumption Analysis, Import Market Analysis (Value & Volume), Export Market Analysis (Value & Volume), Price Trend Analysis.
4. Can you provide details about the market size?
The market size is estimated to be USD 2.57 billion as of 2022.
5. What are some drivers contributing to market growth?
Increase in Internet of Things (IoT) and Autonomous Systems; Rise in Demand for Military and Defense Satellite Communication Solutions.
6. What are the notable trends driving market growth?
Military & Defense will a Hold Significant Market Share.
7. Are there any restraints impacting market growth?
Cybersecurity Threats to Satellite Communication; Interference in Transmission of Data.
8. Can you provide examples of recent developments in the market?
February 2024: Kongsberg was awarded a contract with the Defense Innovation Unit (DIU) to rapidly deliver HUGIN Autonomous Underwater Vehicle (AUV) capabilities for the US military.
9. What pricing options are available for accessing the report?
Pricing options include single-user, multi-user, and enterprise licenses priced at USD 4750, USD 5250, and USD 8750 respectively.
10. Is the market size provided in terms of value or volume?
The market size is provided in terms of value, measured in billion.
11. Are there any specific market keywords associated with the report?
Yes, the market keyword associated with the report is "Autonomous Underwater Vehicles," which aids in identifying and referencing the specific market segment covered.
12. How do I determine which pricing option suits my needs best?
The pricing options vary based on user requirements and access needs. Individual users may opt for single-user licenses, while businesses requiring broader access may choose multi-user or enterprise licenses for cost-effective access to the report.
13. Are there any additional resources or data provided in the Autonomous Underwater Vehicles report?
While the report offers comprehensive insights, it's advisable to review the specific contents or supplementary materials provided to ascertain if additional resources or data are available.
14. How can I stay updated on further developments or reports in the Autonomous Underwater Vehicles?
To stay informed about further developments, trends, and reports in the Autonomous Underwater Vehicles, consider subscribing to industry newsletters, following relevant companies and organizations, or regularly checking reputable industry news sources and publications.
Methodology
Step 1 - Identification of Relevant Samples Size from Population Database


Step 2 - Approaches for Defining Global Market Size (Value, Volume* & Price*)

Note*: In applicable scenarios
Step 3 - Data Sources
Primary Research
- Web Analytics
- Survey Reports
- Research Institute
- Latest Research Reports
- Opinion Leaders
Secondary Research
- Annual Reports
- White Paper
- Latest Press Release
- Industry Association
- Paid Database
- Investor Presentations

Step 4 - Data Triangulation
Involves using different sources of information in order to increase the validity of a study
These sources are likely to be stakeholders in a program - participants, other researchers, program staff, other community members, and so on.
Then we put all data in single framework & apply various statistical tools to find out the dynamic on the market.
During the analysis stage, feedback from the stakeholder groups would be compared to determine areas of agreement as well as areas of divergence