

Key Insights
The Clean Coal Technology (CCT) market is poised for significant expansion, driven by stringent environmental regulations and escalating global energy needs. Projected to achieve a Compound Annual Growth Rate (CAGR) of 6.39% from 2025 to 2033, this growth is underpinned by the demand for emission reduction in power generation and industrial sectors. Key technologies fostering this growth include Carbon Capture and Storage (CCS), advanced combustion techniques (oxy-fuel, IGCC), Flue Gas Desulfurization (FGD), and Selective Catalytic Reduction (SCR). The power generation sector remains the primary driver, emphasizing decarbonization of existing coal-fired plants. Simultaneously, industries like cement and steel are increasingly adopting CCT to lower their carbon footprint. Geographically, North America and Asia-Pacific are expected to lead, supported by established coal infrastructure and investment in cleaner solutions. Europe also plays a vital role, influenced by stringent climate policies and carbon neutrality goals. While renewable energy competition and fossil fuel price volatility present potential challenges, the long-term CCT outlook remains positive due to continued global reliance on coal and advancing, cost-competitive technologies. Industry leaders, including Shell PLC, KBR Inc., Siemens Energy AG, General Electric Company, and Alstom SA, are actively investing in R&D and global technology deployment.
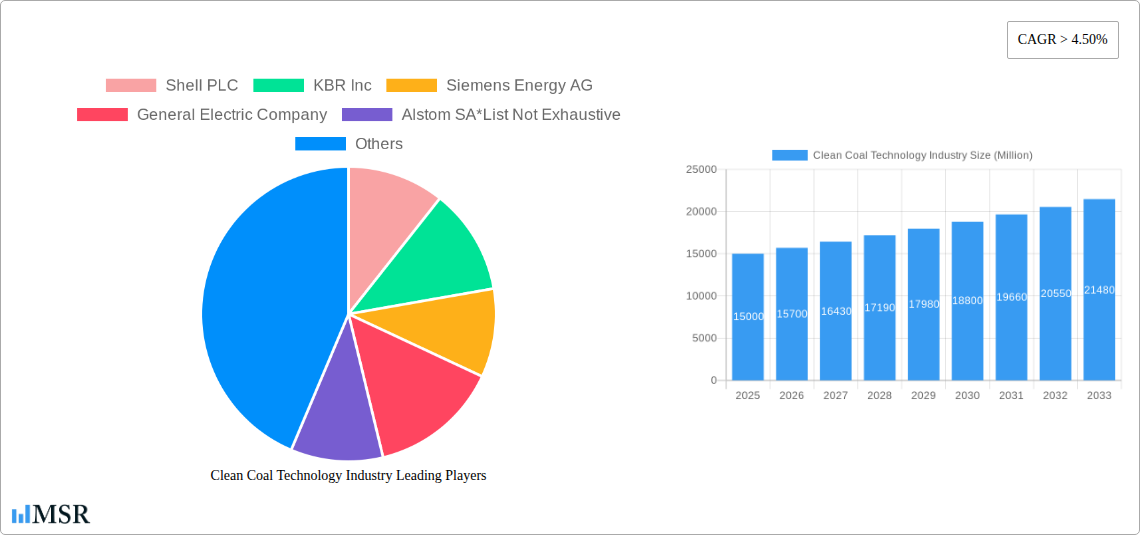
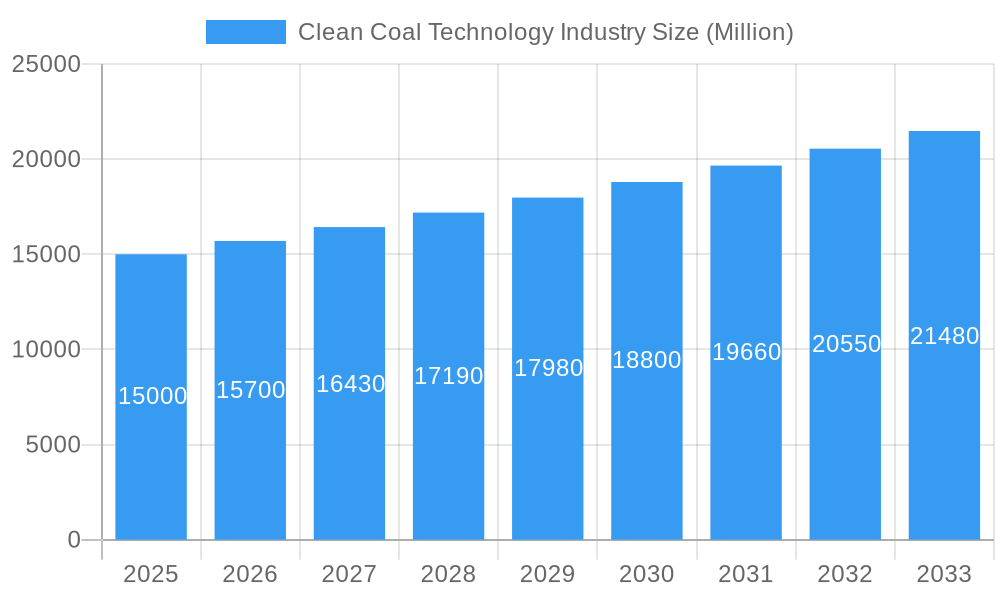
Clean Coal Technology Industry Market Size (In Billion)
Market segmentation highlights the synergy between technological innovation and application requirements. CCS, despite its complexity and high capital costs, is gaining momentum for substantial CO2 reduction. Advanced combustion technologies enhance coal utilization efficiency and cleanliness, while FGD and SCR are essential for mitigating sulfur and nitrogen oxide emissions. Although a smaller segment, residential and commercial heating is seeing gradual adoption of cleaner coal-based solutions, albeit facing competition from renewable heating alternatives. Regional variations in regulations, economic factors, and energy portfolios shape CCT adoption rates. The estimated market size in 2025 is $4.57 billion, with future growth influenced by global energy consumption trends and sector investments. This comprehensive analysis provides a clear understanding of CCT market dynamics and future potential.
Clean Coal Technology Industry Company Market Share
Clean Coal Technology Market Analysis: 2025-2033
This report offers an in-depth analysis of the Clean Coal Technology (CCT) industry, providing critical insights for stakeholders, investors, and professionals. The analysis covers the period from 2025 to 2033, with 2025 serving as the base year. Leveraging extensive data, the projected market size for 2033 is estimated at $4.57 billion, with a CAGR of 6.39%. Leading companies such as Shell PLC, KBR Inc, Siemens Energy AG, General Electric Company, and Alstom SA are profiled. Market segments are analyzed by technology (CCS, Advanced Combustion, FGD, SCR) and application (Power Generation, Industrial Processes, Residential & Commercial Heating).
Clean Coal Technology Industry Market Concentration & Dynamics
The Clean Coal Technology market exhibits a moderately concentrated landscape, with a few dominant players holding significant market share. Shell PLC, for example, holds an estimated XX% market share in CCS technology, while Siemens Energy AG leads in the Advanced Combustion segment with an estimated YY% market share (2024 figures). Market concentration is influenced by factors such as technological expertise, economies of scale, and access to capital. Innovation ecosystems are primarily centered around research institutions and government initiatives. Stringent environmental regulations globally drive the need for cleaner coal technologies, creating a robust regulatory framework. However, the increasing adoption of renewable energy sources presents a significant challenge as a substitute product. M&A activity in the sector has been moderate, with approximately XX deals recorded between 2019 and 2024. End-user trends indicate a growing preference for cleaner energy solutions, pushing the demand for advanced CCT technologies.
- Market Share (2024): Shell PLC (XX%), Siemens Energy AG (YY%), others (ZZ%).
- M&A Deal Count (2019-2024): XX
- Key Regulatory Frameworks: Vary by region, generally focusing on emissions reduction targets.
Clean Coal Technology Industry Industry Insights & Trends
The Clean Coal Technology industry is experiencing significant growth driven by the continued reliance on coal as a primary energy source, particularly in developing economies. The global market size was estimated at $XX Million in 2024 and is projected to reach $XX Million by 2033, fueled by rising energy demands and government investments in cleaner energy solutions. However, the transition towards renewable energy sources is expected to moderate growth. Technological advancements, particularly in CCS and advanced combustion technologies, are improving efficiency and reducing emissions. Shifting consumer behavior towards environmentally friendly energy options influences the demand for cleaner coal technologies.
Key Markets & Segments Leading Clean Coal Technology Industry
The Asia-Pacific region dominates the Clean Coal Technology market, driven by rapid industrialization and urbanization in countries like India and China. China holds the largest market share in terms of both power generation and industrial applications.
By Technology:
- CCS (Carbon Capture and Storage): Growth is driven by government incentives and carbon pricing mechanisms.
- Advanced Combustion Technologies: Higher efficiency and lower emissions make this a fast-growing segment.
- Flue Gas Desulfurization (FGD): Mature technology with steady growth driven by regulatory compliance.
- Selective Catalytic Reduction (SCR): Significant growth potential due to stricter NOx emission standards.
By Application:
- Power Generation: Largest segment due to the widespread use of coal in power plants.
- Industrial Processes: Steady growth driven by the need to reduce emissions from various industrial activities.
- Residential and Commercial Heating: Small but growing segment, particularly in regions with abundant coal resources.
Drivers in Key Regions:
- Asia-Pacific: Rapid economic growth, expanding infrastructure, and rising energy demand.
- North America: Government initiatives promoting clean energy technologies and stringent emission regulations.
- Europe: Focus on decarbonization efforts and stricter environmental regulations.
Clean Coal Technology Industry Product Developments
Recent innovations focus on improving the efficiency of CCS technologies, reducing capital costs of advanced combustion systems, and enhancing the performance of FGD and SCR systems. Companies are actively developing integrated solutions combining multiple clean coal technologies to maximize emission reductions. These advancements are providing competitive advantages by offering superior efficiency, cost-effectiveness, and reduced environmental impact.
Challenges in the Clean Coal Technology Industry Market
The Clean Coal Technology market faces significant challenges, including high capital costs associated with implementing CCS technologies, the complexity of integrating these technologies into existing power plants, and supply chain disruptions affecting the availability of critical components. Furthermore, the intensifying competition from renewable energy sources poses a major threat. The market also faces regulatory uncertainties, and varying policies across different regions create implementation hurdles.
Forces Driving Clean Coal Technology Industry Growth
Technological advancements in CCS, improved efficiency of advanced combustion technologies, and government policies supporting clean coal initiatives are driving market growth. The increasing awareness of environmental concerns and stringent emission regulations are also contributing to this growth. The economic benefits of increased energy efficiency from clean coal technologies are creating further incentive for adoption.
Long-Term Growth Catalysts in Clean Coal Technology Industry
Long-term growth will be fueled by innovations in CCS technologies, strategic partnerships between technology providers and energy companies, and expansion into new markets, particularly in developing economies with significant coal-fired power generation capacities. Continued investments in research and development will be crucial for overcoming technological and economic challenges.
Emerging Opportunities in Clean Coal Technology Industry
Emerging opportunities exist in the development of next-generation CCS technologies with improved efficiency and lower costs. The integration of clean coal technologies with renewable energy sources presents a significant opportunity. Further expansion into emerging markets and developing countries with high coal dependency offers significant potential for growth.
Leading Players in the Clean Coal Technology Industry Sector
- Shell PLC
- KBR Inc
- Siemens Energy AG
- General Electric Company
- Alstom SA
- List Not Exhaustive
Key Milestones in Clean Coal Technology Industry Industry
- October 2021: Adani Power Limited announced plans to commission the Godda Ultra Super Critical coal thermal power project (1600 MW capacity), signaling increased demand for CCT.
- February 2022: The Indian Institute of Chemical Technology (IICT) announced a collaborative project with Northern Coalfields Limits (NCL) for R&D in sustainable mining and CCT, highlighting technological advancements.
Strategic Outlook for Clean Coal Technology Industry Market
The future of the Clean Coal Technology market is intertwined with the global energy transition. While the shift toward renewable energy is undeniable, coal will remain a significant energy source for the foreseeable future, particularly in developing nations. Therefore, continued innovation and investment in efficient and environmentally responsible clean coal technologies will be essential for meeting global energy demands while mitigating climate change. Strategic opportunities lie in developing cost-effective CCS solutions, fostering international collaborations, and adapting to evolving regulatory landscapes.
Clean Coal Technology Industry Segmentation
- 1. Production Analysis
- 2. Consumption Analysis
- 3. Import Market Analysis (Value & Volume)
- 4. Export Market Analysis (Value & Volume)
- 5. Price Trend Analysis
Clean Coal Technology Industry Segmentation By Geography
- 1. North America
- 2. Europe
- 3. Asia Pacific
- 4. Middle East and Africa
- 5. South America
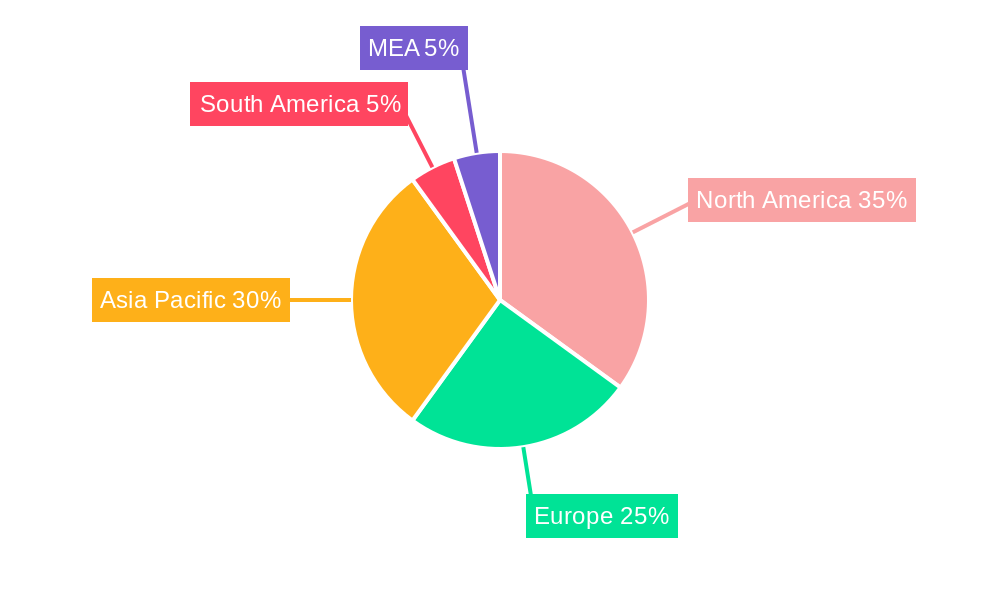
Clean Coal Technology Industry Regional Market Share
Geographic Coverage of Clean Coal Technology Industry
Clean Coal Technology Industry REPORT HIGHLIGHTS
| Aspects | Details |
|---|---|
| Study Period | 2020-2034 |
| Base Year | 2025 |
| Estimated Year | 2026 |
| Forecast Period | 2026-2034 |
| Historical Period | 2020-2025 |
| Growth Rate | CAGR of 6.39% from 2020-2034 |
| Segmentation |
|
Table of Contents
- 1. Introduction
- 1.1. Research Scope
- 1.2. Market Segmentation
- 1.3. Research Objective
- 1.4. Definitions and Assumptions
- 2. Executive Summary
- 2.1. Market Snapshot
- 3. Market Dynamics
- 3.1. Market Drivers
- 3.2. Market Restrains
- 3.3. Market Trends
- 3.4. Market Opportunities
- 4. Market Factor Analysis
- 4.1. Porters Five Forces
- 4.1.1. Bargaining Power of Suppliers
- 4.1.2. Bargaining Power of Buyers
- 4.1.3. Threat of New Entrants
- 4.1.4. Threat of Substitutes
- 4.1.5. Competitive Rivalry
- 4.2. PESTEL analysis
- 4.3. BCG Analysis
- 4.3.1. Stars (High Growth, High Market Share)
- 4.3.2. Cash Cows (Low Growth, High Market Share)
- 4.3.3. Question Mark (High Growth, Low Market Share)
- 4.3.4. Dogs (Low Growth, Low Market Share)
- 4.4. Ansoff Matrix Analysis
- 4.5. Supply Chain Analysis
- 4.6. Regulatory Landscape
- 4.7. Current Market Potential and Opportunity Assessment (TAM–SAM–SOM Framework)
- 4.8. MSR Analyst Note
- 4.1. Porters Five Forces
- 5. Market Analysis, Insights and Forecast 2021-2033
- 5.1. Market Analysis, Insights and Forecast - by Production Analysis
- 5.2. Market Analysis, Insights and Forecast - by Consumption Analysis
- 5.3. Market Analysis, Insights and Forecast - by Import Market Analysis (Value & Volume)
- 5.4. Market Analysis, Insights and Forecast - by Export Market Analysis (Value & Volume)
- 5.5. Market Analysis, Insights and Forecast - by Price Trend Analysis
- 5.6. Market Analysis, Insights and Forecast - by Region
- 5.6.1. North America
- 5.6.2. Europe
- 5.6.3. Asia Pacific
- 5.6.4. Middle East and Africa
- 5.6.5. South America
- 6. Global Clean Coal Technology Industry Analysis, Insights and Forecast, 2021-2033
- 6.1. Market Analysis, Insights and Forecast - by Production Analysis
- 6.2. Market Analysis, Insights and Forecast - by Consumption Analysis
- 6.3. Market Analysis, Insights and Forecast - by Import Market Analysis (Value & Volume)
- 6.4. Market Analysis, Insights and Forecast - by Export Market Analysis (Value & Volume)
- 6.5. Market Analysis, Insights and Forecast - by Price Trend Analysis
- 7. North America Clean Coal Technology Industry Analysis, Insights and Forecast, 2020-2032
- 7.1. Market Analysis, Insights and Forecast - by Production Analysis
- 7.2. Market Analysis, Insights and Forecast - by Consumption Analysis
- 7.3. Market Analysis, Insights and Forecast - by Import Market Analysis (Value & Volume)
- 7.4. Market Analysis, Insights and Forecast - by Export Market Analysis (Value & Volume)
- 7.5. Market Analysis, Insights and Forecast - by Price Trend Analysis
- 8. Europe Clean Coal Technology Industry Analysis, Insights and Forecast, 2020-2032
- 8.1. Market Analysis, Insights and Forecast - by Production Analysis
- 8.2. Market Analysis, Insights and Forecast - by Consumption Analysis
- 8.3. Market Analysis, Insights and Forecast - by Import Market Analysis (Value & Volume)
- 8.4. Market Analysis, Insights and Forecast - by Export Market Analysis (Value & Volume)
- 8.5. Market Analysis, Insights and Forecast - by Price Trend Analysis
- 9. Asia Pacific Clean Coal Technology Industry Analysis, Insights and Forecast, 2020-2032
- 9.1. Market Analysis, Insights and Forecast - by Production Analysis
- 9.2. Market Analysis, Insights and Forecast - by Consumption Analysis
- 9.3. Market Analysis, Insights and Forecast - by Import Market Analysis (Value & Volume)
- 9.4. Market Analysis, Insights and Forecast - by Export Market Analysis (Value & Volume)
- 9.5. Market Analysis, Insights and Forecast - by Price Trend Analysis
- 10. Middle East and Africa Clean Coal Technology Industry Analysis, Insights and Forecast, 2020-2032
- 10.1. Market Analysis, Insights and Forecast - by Production Analysis
- 10.2. Market Analysis, Insights and Forecast - by Consumption Analysis
- 10.3. Market Analysis, Insights and Forecast - by Import Market Analysis (Value & Volume)
- 10.4. Market Analysis, Insights and Forecast - by Export Market Analysis (Value & Volume)
- 10.5. Market Analysis, Insights and Forecast - by Price Trend Analysis
- 11. South America Clean Coal Technology Industry Analysis, Insights and Forecast, 2020-2032
- 11.1. Market Analysis, Insights and Forecast - by Production Analysis
- 11.2. Market Analysis, Insights and Forecast - by Consumption Analysis
- 11.3. Market Analysis, Insights and Forecast - by Import Market Analysis (Value & Volume)
- 11.4. Market Analysis, Insights and Forecast - by Export Market Analysis (Value & Volume)
- 11.5. Market Analysis, Insights and Forecast - by Price Trend Analysis
- 12. Competitive Analysis
- 12.1. Company Profiles
- 12.1.1 Shell PLC
- 12.1.1.1. Company Overview
- 12.1.1.2. Products
- 12.1.1.3. Company Financials
- 12.1.1.4. SWOT Analysis
- 12.1.2 KBR Inc
- 12.1.2.1. Company Overview
- 12.1.2.2. Products
- 12.1.2.3. Company Financials
- 12.1.2.4. SWOT Analysis
- 12.1.3 Siemens Energy AG
- 12.1.3.1. Company Overview
- 12.1.3.2. Products
- 12.1.3.3. Company Financials
- 12.1.3.4. SWOT Analysis
- 12.1.4 General Electric Company
- 12.1.4.1. Company Overview
- 12.1.4.2. Products
- 12.1.4.3. Company Financials
- 12.1.4.4. SWOT Analysis
- 12.1.5 Alstom SA*List Not Exhaustive
- 12.1.5.1. Company Overview
- 12.1.5.2. Products
- 12.1.5.3. Company Financials
- 12.1.5.4. SWOT Analysis
- 12.1.1 Shell PLC
- 12.2. Market Entropy
- 12.2.1 Company's Key Areas Served
- 12.2.2 Recent Developments
- 12.3. Company Market Share Analysis 2025
- 12.3.1 Top 5 Companies Market Share Analysis
- 12.3.2 Top 3 Companies Market Share Analysis
- 12.4. List of Potential Customers
- 13. Research Methodology
List of Figures
- Figure 1: Global Clean Coal Technology Industry Revenue Breakdown (billion, %) by Region 2025 & 2033
- Figure 2: North America Clean Coal Technology Industry Revenue (billion), by Production Analysis 2025 & 2033
- Figure 3: North America Clean Coal Technology Industry Revenue Share (%), by Production Analysis 2025 & 2033
- Figure 4: North America Clean Coal Technology Industry Revenue (billion), by Consumption Analysis 2025 & 2033
- Figure 5: North America Clean Coal Technology Industry Revenue Share (%), by Consumption Analysis 2025 & 2033
- Figure 6: North America Clean Coal Technology Industry Revenue (billion), by Import Market Analysis (Value & Volume) 2025 & 2033
- Figure 7: North America Clean Coal Technology Industry Revenue Share (%), by Import Market Analysis (Value & Volume) 2025 & 2033
- Figure 8: North America Clean Coal Technology Industry Revenue (billion), by Export Market Analysis (Value & Volume) 2025 & 2033
- Figure 9: North America Clean Coal Technology Industry Revenue Share (%), by Export Market Analysis (Value & Volume) 2025 & 2033
- Figure 10: North America Clean Coal Technology Industry Revenue (billion), by Price Trend Analysis 2025 & 2033
- Figure 11: North America Clean Coal Technology Industry Revenue Share (%), by Price Trend Analysis 2025 & 2033
- Figure 12: North America Clean Coal Technology Industry Revenue (billion), by Country 2025 & 2033
- Figure 13: North America Clean Coal Technology Industry Revenue Share (%), by Country 2025 & 2033
- Figure 14: Europe Clean Coal Technology Industry Revenue (billion), by Production Analysis 2025 & 2033
- Figure 15: Europe Clean Coal Technology Industry Revenue Share (%), by Production Analysis 2025 & 2033
- Figure 16: Europe Clean Coal Technology Industry Revenue (billion), by Consumption Analysis 2025 & 2033
- Figure 17: Europe Clean Coal Technology Industry Revenue Share (%), by Consumption Analysis 2025 & 2033
- Figure 18: Europe Clean Coal Technology Industry Revenue (billion), by Import Market Analysis (Value & Volume) 2025 & 2033
- Figure 19: Europe Clean Coal Technology Industry Revenue Share (%), by Import Market Analysis (Value & Volume) 2025 & 2033
- Figure 20: Europe Clean Coal Technology Industry Revenue (billion), by Export Market Analysis (Value & Volume) 2025 & 2033
- Figure 21: Europe Clean Coal Technology Industry Revenue Share (%), by Export Market Analysis (Value & Volume) 2025 & 2033
- Figure 22: Europe Clean Coal Technology Industry Revenue (billion), by Price Trend Analysis 2025 & 2033
- Figure 23: Europe Clean Coal Technology Industry Revenue Share (%), by Price Trend Analysis 2025 & 2033
- Figure 24: Europe Clean Coal Technology Industry Revenue (billion), by Country 2025 & 2033
- Figure 25: Europe Clean Coal Technology Industry Revenue Share (%), by Country 2025 & 2033
- Figure 26: Asia Pacific Clean Coal Technology Industry Revenue (billion), by Production Analysis 2025 & 2033
- Figure 27: Asia Pacific Clean Coal Technology Industry Revenue Share (%), by Production Analysis 2025 & 2033
- Figure 28: Asia Pacific Clean Coal Technology Industry Revenue (billion), by Consumption Analysis 2025 & 2033
- Figure 29: Asia Pacific Clean Coal Technology Industry Revenue Share (%), by Consumption Analysis 2025 & 2033
- Figure 30: Asia Pacific Clean Coal Technology Industry Revenue (billion), by Import Market Analysis (Value & Volume) 2025 & 2033
- Figure 31: Asia Pacific Clean Coal Technology Industry Revenue Share (%), by Import Market Analysis (Value & Volume) 2025 & 2033
- Figure 32: Asia Pacific Clean Coal Technology Industry Revenue (billion), by Export Market Analysis (Value & Volume) 2025 & 2033
- Figure 33: Asia Pacific Clean Coal Technology Industry Revenue Share (%), by Export Market Analysis (Value & Volume) 2025 & 2033
- Figure 34: Asia Pacific Clean Coal Technology Industry Revenue (billion), by Price Trend Analysis 2025 & 2033
- Figure 35: Asia Pacific Clean Coal Technology Industry Revenue Share (%), by Price Trend Analysis 2025 & 2033
- Figure 36: Asia Pacific Clean Coal Technology Industry Revenue (billion), by Country 2025 & 2033
- Figure 37: Asia Pacific Clean Coal Technology Industry Revenue Share (%), by Country 2025 & 2033
- Figure 38: Middle East and Africa Clean Coal Technology Industry Revenue (billion), by Production Analysis 2025 & 2033
- Figure 39: Middle East and Africa Clean Coal Technology Industry Revenue Share (%), by Production Analysis 2025 & 2033
- Figure 40: Middle East and Africa Clean Coal Technology Industry Revenue (billion), by Consumption Analysis 2025 & 2033
- Figure 41: Middle East and Africa Clean Coal Technology Industry Revenue Share (%), by Consumption Analysis 2025 & 2033
- Figure 42: Middle East and Africa Clean Coal Technology Industry Revenue (billion), by Import Market Analysis (Value & Volume) 2025 & 2033
- Figure 43: Middle East and Africa Clean Coal Technology Industry Revenue Share (%), by Import Market Analysis (Value & Volume) 2025 & 2033
- Figure 44: Middle East and Africa Clean Coal Technology Industry Revenue (billion), by Export Market Analysis (Value & Volume) 2025 & 2033
- Figure 45: Middle East and Africa Clean Coal Technology Industry Revenue Share (%), by Export Market Analysis (Value & Volume) 2025 & 2033
- Figure 46: Middle East and Africa Clean Coal Technology Industry Revenue (billion), by Price Trend Analysis 2025 & 2033
- Figure 47: Middle East and Africa Clean Coal Technology Industry Revenue Share (%), by Price Trend Analysis 2025 & 2033
- Figure 48: Middle East and Africa Clean Coal Technology Industry Revenue (billion), by Country 2025 & 2033
- Figure 49: Middle East and Africa Clean Coal Technology Industry Revenue Share (%), by Country 2025 & 2033
- Figure 50: South America Clean Coal Technology Industry Revenue (billion), by Production Analysis 2025 & 2033
- Figure 51: South America Clean Coal Technology Industry Revenue Share (%), by Production Analysis 2025 & 2033
- Figure 52: South America Clean Coal Technology Industry Revenue (billion), by Consumption Analysis 2025 & 2033
- Figure 53: South America Clean Coal Technology Industry Revenue Share (%), by Consumption Analysis 2025 & 2033
- Figure 54: South America Clean Coal Technology Industry Revenue (billion), by Import Market Analysis (Value & Volume) 2025 & 2033
- Figure 55: South America Clean Coal Technology Industry Revenue Share (%), by Import Market Analysis (Value & Volume) 2025 & 2033
- Figure 56: South America Clean Coal Technology Industry Revenue (billion), by Export Market Analysis (Value & Volume) 2025 & 2033
- Figure 57: South America Clean Coal Technology Industry Revenue Share (%), by Export Market Analysis (Value & Volume) 2025 & 2033
- Figure 58: South America Clean Coal Technology Industry Revenue (billion), by Price Trend Analysis 2025 & 2033
- Figure 59: South America Clean Coal Technology Industry Revenue Share (%), by Price Trend Analysis 2025 & 2033
- Figure 60: South America Clean Coal Technology Industry Revenue (billion), by Country 2025 & 2033
- Figure 61: South America Clean Coal Technology Industry Revenue Share (%), by Country 2025 & 2033
List of Tables
- Table 1: Global Clean Coal Technology Industry Revenue billion Forecast, by Production Analysis 2020 & 2033
- Table 2: Global Clean Coal Technology Industry Revenue billion Forecast, by Consumption Analysis 2020 & 2033
- Table 3: Global Clean Coal Technology Industry Revenue billion Forecast, by Import Market Analysis (Value & Volume) 2020 & 2033
- Table 4: Global Clean Coal Technology Industry Revenue billion Forecast, by Export Market Analysis (Value & Volume) 2020 & 2033
- Table 5: Global Clean Coal Technology Industry Revenue billion Forecast, by Price Trend Analysis 2020 & 2033
- Table 6: Global Clean Coal Technology Industry Revenue billion Forecast, by Region 2020 & 2033
- Table 7: Global Clean Coal Technology Industry Revenue billion Forecast, by Production Analysis 2020 & 2033
- Table 8: Global Clean Coal Technology Industry Revenue billion Forecast, by Consumption Analysis 2020 & 2033
- Table 9: Global Clean Coal Technology Industry Revenue billion Forecast, by Import Market Analysis (Value & Volume) 2020 & 2033
- Table 10: Global Clean Coal Technology Industry Revenue billion Forecast, by Export Market Analysis (Value & Volume) 2020 & 2033
- Table 11: Global Clean Coal Technology Industry Revenue billion Forecast, by Price Trend Analysis 2020 & 2033
- Table 12: Global Clean Coal Technology Industry Revenue billion Forecast, by Country 2020 & 2033
- Table 13: Global Clean Coal Technology Industry Revenue billion Forecast, by Production Analysis 2020 & 2033
- Table 14: Global Clean Coal Technology Industry Revenue billion Forecast, by Consumption Analysis 2020 & 2033
- Table 15: Global Clean Coal Technology Industry Revenue billion Forecast, by Import Market Analysis (Value & Volume) 2020 & 2033
- Table 16: Global Clean Coal Technology Industry Revenue billion Forecast, by Export Market Analysis (Value & Volume) 2020 & 2033
- Table 17: Global Clean Coal Technology Industry Revenue billion Forecast, by Price Trend Analysis 2020 & 2033
- Table 18: Global Clean Coal Technology Industry Revenue billion Forecast, by Country 2020 & 2033
- Table 19: Global Clean Coal Technology Industry Revenue billion Forecast, by Production Analysis 2020 & 2033
- Table 20: Global Clean Coal Technology Industry Revenue billion Forecast, by Consumption Analysis 2020 & 2033
- Table 21: Global Clean Coal Technology Industry Revenue billion Forecast, by Import Market Analysis (Value & Volume) 2020 & 2033
- Table 22: Global Clean Coal Technology Industry Revenue billion Forecast, by Export Market Analysis (Value & Volume) 2020 & 2033
- Table 23: Global Clean Coal Technology Industry Revenue billion Forecast, by Price Trend Analysis 2020 & 2033
- Table 24: Global Clean Coal Technology Industry Revenue billion Forecast, by Country 2020 & 2033
- Table 25: Global Clean Coal Technology Industry Revenue billion Forecast, by Production Analysis 2020 & 2033
- Table 26: Global Clean Coal Technology Industry Revenue billion Forecast, by Consumption Analysis 2020 & 2033
- Table 27: Global Clean Coal Technology Industry Revenue billion Forecast, by Import Market Analysis (Value & Volume) 2020 & 2033
- Table 28: Global Clean Coal Technology Industry Revenue billion Forecast, by Export Market Analysis (Value & Volume) 2020 & 2033
- Table 29: Global Clean Coal Technology Industry Revenue billion Forecast, by Price Trend Analysis 2020 & 2033
- Table 30: Global Clean Coal Technology Industry Revenue billion Forecast, by Country 2020 & 2033
- Table 31: Global Clean Coal Technology Industry Revenue billion Forecast, by Production Analysis 2020 & 2033
- Table 32: Global Clean Coal Technology Industry Revenue billion Forecast, by Consumption Analysis 2020 & 2033
- Table 33: Global Clean Coal Technology Industry Revenue billion Forecast, by Import Market Analysis (Value & Volume) 2020 & 2033
- Table 34: Global Clean Coal Technology Industry Revenue billion Forecast, by Export Market Analysis (Value & Volume) 2020 & 2033
- Table 35: Global Clean Coal Technology Industry Revenue billion Forecast, by Price Trend Analysis 2020 & 2033
- Table 36: Global Clean Coal Technology Industry Revenue billion Forecast, by Country 2020 & 2033
Frequently Asked Questions
1. What is the projected Compound Annual Growth Rate (CAGR) of the Clean Coal Technology Industry?
The projected CAGR is approximately 6.39%.
2. Which companies are prominent players in the Clean Coal Technology Industry?
Key companies in the market include Shell PLC, KBR Inc, Siemens Energy AG, General Electric Company, Alstom SA*List Not Exhaustive.
3. What are the main segments of the Clean Coal Technology Industry?
The market segments include Production Analysis, Consumption Analysis, Import Market Analysis (Value & Volume), Export Market Analysis (Value & Volume), Price Trend Analysis.
4. Can you provide details about the market size?
The market size is estimated to be USD 4.57 billion as of 2022.
5. What are some drivers contributing to market growth?
4.; Modernization and Upgrades of Existing Military Aircraft Fleets4.; Increasing Defense Budgets.
6. What are the notable trends driving market growth?
Growth in Power Consumption is Likely to Drive the Market.
7. Are there any restraints impacting market growth?
4.; Shift Toward Unmanned Aircraft.
8. Can you provide examples of recent developments in the market?
In February 2022, the Indian Institute of Chemical Technology (IICT) announced a collaborative project of approximately INR 7.31 core with Northern Coalfields Limits (NCL), Madhya Pradesh (MP), to take up research and development in the field of sustainable mining and clean coal technologies (CCT).
9. What pricing options are available for accessing the report?
Pricing options include single-user, multi-user, and enterprise licenses priced at USD 4750, USD 5250, and USD 8750 respectively.
10. Is the market size provided in terms of value or volume?
The market size is provided in terms of value, measured in billion.
11. Are there any specific market keywords associated with the report?
Yes, the market keyword associated with the report is "Clean Coal Technology Industry," which aids in identifying and referencing the specific market segment covered.
12. How do I determine which pricing option suits my needs best?
The pricing options vary based on user requirements and access needs. Individual users may opt for single-user licenses, while businesses requiring broader access may choose multi-user or enterprise licenses for cost-effective access to the report.
13. Are there any additional resources or data provided in the Clean Coal Technology Industry report?
While the report offers comprehensive insights, it's advisable to review the specific contents or supplementary materials provided to ascertain if additional resources or data are available.
14. How can I stay updated on further developments or reports in the Clean Coal Technology Industry?
To stay informed about further developments, trends, and reports in the Clean Coal Technology Industry, consider subscribing to industry newsletters, following relevant companies and organizations, or regularly checking reputable industry news sources and publications.
Methodology
Step 1 - Identification of Relevant Samples Size from Population Database


Step 2 - Approaches for Defining Global Market Size (Value, Volume* & Price*)

Note*: In applicable scenarios
Step 3 - Data Sources
Primary Research
- Web Analytics
- Survey Reports
- Research Institute
- Latest Research Reports
- Opinion Leaders
Secondary Research
- Annual Reports
- White Paper
- Latest Press Release
- Industry Association
- Paid Database
- Investor Presentations

Step 4 - Data Triangulation
Involves using different sources of information in order to increase the validity of a study
These sources are likely to be stakeholders in a program - participants, other researchers, program staff, other community members, and so on.
Then we put all data in single framework & apply various statistical tools to find out the dynamic on the market.
During the analysis stage, feedback from the stakeholder groups would be compared to determine areas of agreement as well as areas of divergence