

Key Insights
The Australian coal sector, despite global decarbonization pressures, sustains a substantial market presence. This is driven by strong domestic energy needs and ongoing export demand from key Asian economies. The market size is projected to reach $57 billion in 2024, with a compound annual growth rate (CAGR) of 2.2% through 2033. Growth is primarily fueled by thermal coal demand for power generation in the Asia-Pacific, and coking coal for steel production. Thermal coal leads market share, followed by coking coal, with semi-soft coking coal as an emerging segment. However, stringent environmental regulations, particularly on emissions, and the rise of renewable energy present significant growth challenges.
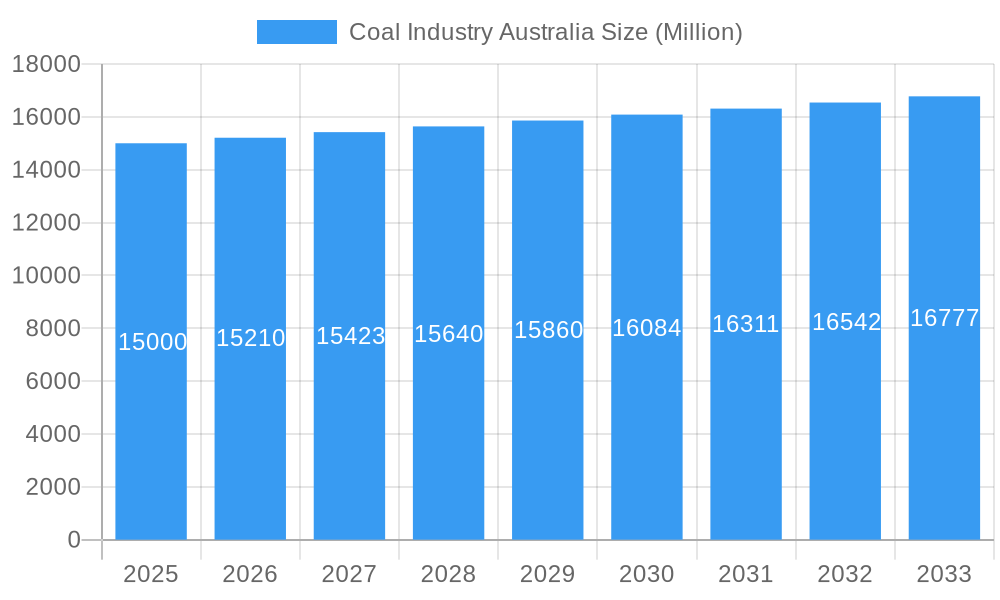
Coal Industry Australia Market Size (In Billion)
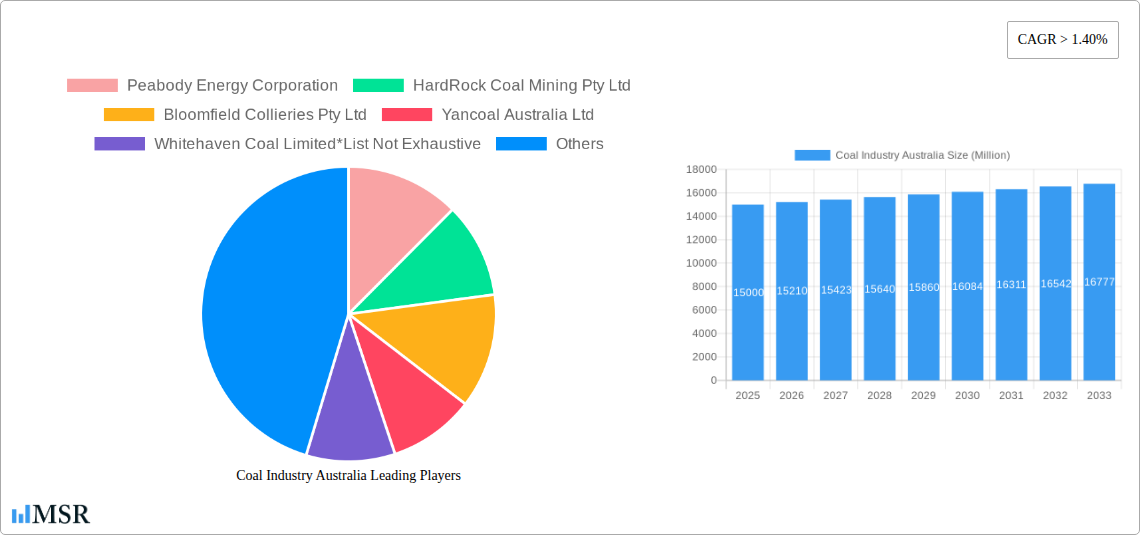
Leading entities such as Peabody Energy Corporation, Yancoal Australia Ltd, and Whitehaven Coal Limited, alongside other major producers, are navigating these dynamics through operational enhancements and diversification. The Asia-Pacific region, encompassing China, Japan, India, and South Korea, remains the primary export destination, significantly influencing the industry's direction.
Coal Industry Australia Company Market Share
The future trajectory of the Australian coal industry involves balancing energy demand with the global transition to cleaner sources. Projected moderate growth necessitates proactive environmental impact reduction, exploration of carbon capture technologies, and sector diversification. Intense competition, marked by consolidation and strategic partnerships, drives market share pursuit and cost optimization. Government policies on emissions and resource management, alongside technological innovations in mining and processing for enhanced efficiency and reduced environmental impact, are crucial for the sector's long-term viability.
Coal Industry Australia: Market Analysis & Forecast 2019-2033
This comprehensive report provides an in-depth analysis of the Australian coal industry, offering crucial insights for stakeholders across the value chain. Covering the period 2019-2033, with a focus on 2025, this report utilizes rigorous data analysis to forecast future trends and identify key opportunities. The study encompasses various coal types (Thermal Coal, Coking Coal, Semi-Soft Coking Coal) and end-uses (Power Generation, Steelmaking, Industrial Applications), providing a granular view of the market's dynamics. Key players like Peabody Energy Corporation, Yancoal Australia Ltd, Whitehaven Coal Limited, and others are analyzed, revealing market share and strategic maneuvers. Download now to gain a competitive edge in this evolving landscape.
Coal Industry Australia Market Concentration & Dynamics
This section assesses the Australian coal market's competitive landscape, encompassing market concentration, innovation, regulation, substitute products, end-user trends, and mergers & acquisitions (M&A) activity from 2019-2024. The market is characterized by a relatively high level of concentration, with a few major players controlling a significant share of production.
- Market Share: While precise figures are proprietary, Yancoal Australia Ltd, Whitehaven Coal Limited, and Peabody Energy Corporation collectively hold an estimated xx% of the market share in 2024. Other significant players include BHP Group Ltd and Centennial Coal Company Ltd, each contributing a substantial, albeit smaller, percentage.
- M&A Activity: The historical period (2019-2024) witnessed xx major M&A deals, primarily focused on consolidating assets and expanding operational capabilities. The forecast period (2025-2033) is anticipated to see a moderate decrease in M&A activity due to increased regulatory scrutiny and market stabilization.
- Innovation Ecosystem: Innovation in the Australian coal industry is focused primarily on improving efficiency and reducing environmental impact. This includes advancements in mining techniques, transportation, and coal processing.
- Regulatory Framework: The Australian government's policies regarding coal mining have become increasingly stringent, focusing on environmental protection and social responsibility. These regulations influence the operational costs and investment decisions of industry players.
- Substitute Products: The increasing adoption of renewable energy sources presents a significant challenge to the coal industry. However, coal remains crucial for steelmaking and some industrial applications, creating a resilient demand base, albeit shrinking.
- End-User Trends: The transition towards cleaner energy sources is driving a decline in coal demand for power generation. However, consistent demand in steelmaking and industrial applications sustains a specific market segment.
Coal Industry Australia Industry Insights & Trends
The Australian coal market experienced a xx Million tonnes decline in production from 2019 to 2024, primarily driven by reduced demand for thermal coal in power generation. However, CAGR from 2025 to 2033 is projected at xx%, primarily due to robust demand from steelmaking and industrial applications. Technological advancements in extraction and processing contribute to marginal efficiency gains. Market size for 2025 is estimated at xx Million tonnes, projected to reach xx Million tonnes by 2033. The shift toward cleaner energy is a major headwind, but industrial applications continue to fuel growth. This contrasts with the global trends showing a much steeper decline in demand for thermal coal. Australia benefits from having high-quality coking coal essential for the global steel industry, partially mitigating the pressure from renewables.
Key Markets & Segments Leading Coal Industry Australia
- By Coal Type: Coking coal remains the dominant segment due to its irreplaceable role in steelmaking, holding approximately xx% of the market in 2025. Thermal coal faces declining demand, but its role in power generation remains significant, projected at xx% of the market in 2025. Semi-soft coking coal holds a smaller share, but it is a niche and important part of the market.
- By End-Use: Steelmaking remains the key driver of growth, accounting for approximately xx% of coal consumption in 2025. While power generation demand is contracting, it still constitutes a significant market share, projected at approximately xx% in 2025. Industrial applications, though smaller, display sustained demand.
Drivers of Dominance:
- Steelmaking: Strong global steel production, particularly in Asia, drives consistent demand for coking coal.
- Power Generation: While declining, coal-fired power plants continue to operate, providing a substantial demand for thermal coal, albeit reducing over time.
- Infrastructure Development: Ongoing infrastructure projects in Australia and abroad continue to support the demand for thermal and coking coal, at least in the short to mid-term.
Coal Industry Australia Product Developments
Recent product innovations focus on optimizing coal quality for specific applications, improving extraction methods to reduce environmental impact, and developing more efficient coal processing techniques. These advancements aim to enhance the competitive edge of Australian coal in global markets despite the growing pressure from renewable energy sources.
Challenges in the Coal Industry Australia Market
The Australian coal industry faces several challenges, including increasingly stringent environmental regulations that escalate operational costs and necessitate significant investments in environmental mitigation measures. Supply chain disruptions, particularly in transportation, can affect production and delivery timelines. Intense competition from other coal-producing nations and the pressure from growing renewable energy adoption pose further significant risks to sustained long-term growth. These factors, combined, impacted the market by approximately xx Million tonnes in 2024, a decrease of xx% compared to 2019.
Forces Driving Coal Industry Australia Growth
Despite challenges, several factors drive future growth. Technological advancements leading to improved mining efficiency and reduced environmental impact will play a key role. The continued, albeit shrinking, demand for thermal coal from existing power generation facilities and the consistent, strong demand for coking coal in steelmaking are also key factors. Export opportunities, particularly to steel-producing nations in Asia, provide a further source of growth, especially in the high-quality coking coal segment.
Long-Term Growth Catalysts in Coal Industry Australia
Long-term growth will be fueled by strategic partnerships aimed at developing cleaner coal technologies and enhancing supply chain resilience. Exploring new applications of coal-derived products and focusing on high-value coking coal exports will be crucial. Expansion into new international markets could also contribute to long-term sustained growth, though this is dependent on the global transition to renewable energy.
Emerging Opportunities in Coal Industry Australia
Opportunities exist in developing innovative technologies for carbon capture and storage, enhancing the sustainability of coal operations. Targeting niche markets requiring specialized coal types, and investing in research and development to optimize coal quality for particular applications represent additional growth avenues.
Leading Players in the Coal Industry Australia Sector
- Peabody Energy Corporation
- HardRock Coal Mining Pty Ltd
- Bloomfield Collieries Pty Ltd
- Yancoal Australia Ltd
- Whitehaven Coal Limited
- Idemitsu Australia Resources Pty Ltd
- Jellinbah Group Pty Ltd
- BHP Group Ltd
- Centennial Coal Company Ltd
- Vale S A
Key Milestones in Coal Industry Australia Industry
- September 2022: AGL Energy announced the closure of its Loy Yang A coal-fired power station in Victoria by 2035, signaling a shift away from coal-based power generation. This milestone underscores the challenges faced by the thermal coal segment.
- October 2022: New South Wales awarded contracts for the design and replacement of four out of five coal power stations within 11 years. This signifies a long-term transition strategy away from coal power generation in the state, impacting the future demand for thermal coal.
Strategic Outlook for Coal Industry Australia Market
The future of the Australian coal industry hinges on adapting to the global energy transition. Focusing on high-value coking coal exports, investing in cleaner technologies, and developing strategic partnerships will be critical to ensuring long-term competitiveness and sustainable growth. While challenges remain significant, the industry's ability to innovate and adapt will determine its future trajectory. The focus will shift towards efficient operations, sustainable practices, and niche markets requiring high-quality coking coal to sustain growth in the long term.
Coal Industry Australia Segmentation
- 1. Electricity
- 2. Iron and Steel
- 3. Other Applications
Coal Industry Australia Segmentation By Geography
-
1. North America
- 1.1. United States
- 1.2. Canada
- 1.3. Mexico
-
2. South America
- 2.1. Brazil
- 2.2. Argentina
- 2.3. Rest of South America
-
3. Europe
- 3.1. United Kingdom
- 3.2. Germany
- 3.3. France
- 3.4. Italy
- 3.5. Spain
- 3.6. Russia
- 3.7. Benelux
- 3.8. Nordics
- 3.9. Rest of Europe
-
4. Middle East & Africa
- 4.1. Turkey
- 4.2. Israel
- 4.3. GCC
- 4.4. North Africa
- 4.5. South Africa
- 4.6. Rest of Middle East & Africa
-
5. Asia Pacific
- 5.1. China
- 5.2. India
- 5.3. Japan
- 5.4. South Korea
- 5.5. ASEAN
- 5.6. Oceania
- 5.7. Rest of Asia Pacific
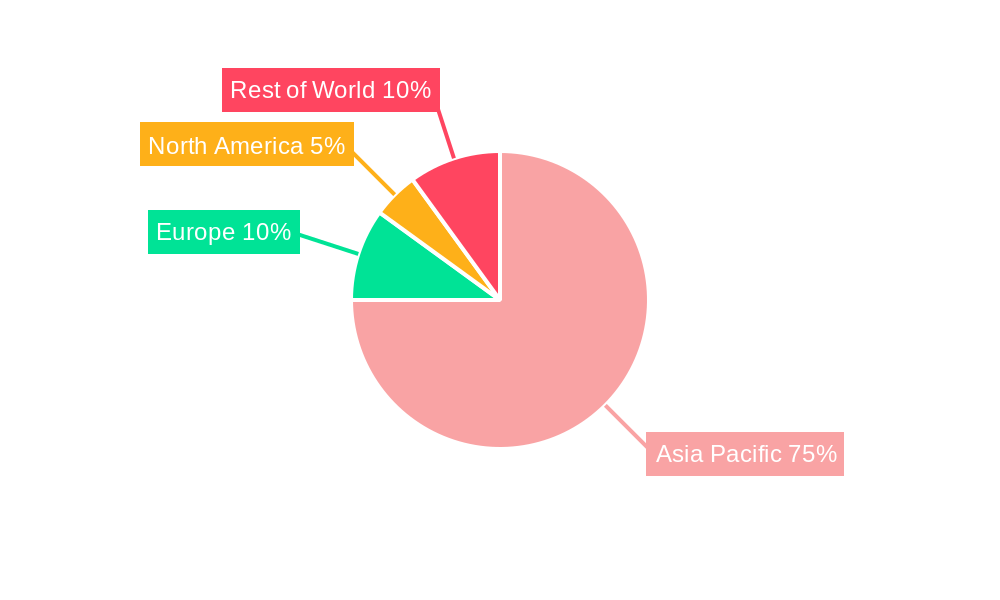
Coal Industry Australia Regional Market Share
Geographic Coverage of Coal Industry Australia
Coal Industry Australia REPORT HIGHLIGHTS
| Aspects | Details |
|---|---|
| Study Period | 2020-2034 |
| Base Year | 2025 |
| Estimated Year | 2026 |
| Forecast Period | 2026-2034 |
| Historical Period | 2020-2025 |
| Growth Rate | CAGR of 2.2% from 2020-2034 |
| Segmentation |
|
Table of Contents
- 1. Introduction
- 1.1. Research Scope
- 1.2. Market Segmentation
- 1.3. Research Objective
- 1.4. Definitions and Assumptions
- 2. Executive Summary
- 2.1. Market Snapshot
- 3. Market Dynamics
- 3.1. Market Drivers
- 3.2. Market Restrains
- 3.3. Market Trends
- 3.4. Market Opportunities
- 4. Market Factor Analysis
- 4.1. Porters Five Forces
- 4.1.1. Bargaining Power of Suppliers
- 4.1.2. Bargaining Power of Buyers
- 4.1.3. Threat of New Entrants
- 4.1.4. Threat of Substitutes
- 4.1.5. Competitive Rivalry
- 4.2. PESTEL analysis
- 4.3. BCG Analysis
- 4.3.1. Stars (High Growth, High Market Share)
- 4.3.2. Cash Cows (Low Growth, High Market Share)
- 4.3.3. Question Mark (High Growth, Low Market Share)
- 4.3.4. Dogs (Low Growth, Low Market Share)
- 4.4. Ansoff Matrix Analysis
- 4.5. Supply Chain Analysis
- 4.6. Regulatory Landscape
- 4.7. Current Market Potential and Opportunity Assessment (TAM–SAM–SOM Framework)
- 4.8. MSR Analyst Note
- 4.1. Porters Five Forces
- 5. Market Analysis, Insights and Forecast 2021-2033
- 5.1. Market Analysis, Insights and Forecast - by Electricity
- 5.2. Market Analysis, Insights and Forecast - by Iron and Steel
- 5.3. Market Analysis, Insights and Forecast - by Other Applications
- 5.4. Market Analysis, Insights and Forecast - by Region
- 5.4.1. North America
- 5.4.2. South America
- 5.4.3. Europe
- 5.4.4. Middle East & Africa
- 5.4.5. Asia Pacific
- 6. Global Coal Industry Australia Analysis, Insights and Forecast, 2021-2033
- 6.1. Market Analysis, Insights and Forecast - by Electricity
- 6.2. Market Analysis, Insights and Forecast - by Iron and Steel
- 6.3. Market Analysis, Insights and Forecast - by Other Applications
- 7. North America Coal Industry Australia Analysis, Insights and Forecast, 2020-2032
- 7.1. Market Analysis, Insights and Forecast - by Electricity
- 7.2. Market Analysis, Insights and Forecast - by Iron and Steel
- 7.3. Market Analysis, Insights and Forecast - by Other Applications
- 8. South America Coal Industry Australia Analysis, Insights and Forecast, 2020-2032
- 8.1. Market Analysis, Insights and Forecast - by Electricity
- 8.2. Market Analysis, Insights and Forecast - by Iron and Steel
- 8.3. Market Analysis, Insights and Forecast - by Other Applications
- 9. Europe Coal Industry Australia Analysis, Insights and Forecast, 2020-2032
- 9.1. Market Analysis, Insights and Forecast - by Electricity
- 9.2. Market Analysis, Insights and Forecast - by Iron and Steel
- 9.3. Market Analysis, Insights and Forecast - by Other Applications
- 10. Middle East & Africa Coal Industry Australia Analysis, Insights and Forecast, 2020-2032
- 10.1. Market Analysis, Insights and Forecast - by Electricity
- 10.2. Market Analysis, Insights and Forecast - by Iron and Steel
- 10.3. Market Analysis, Insights and Forecast - by Other Applications
- 11. Asia Pacific Coal Industry Australia Analysis, Insights and Forecast, 2020-2032
- 11.1. Market Analysis, Insights and Forecast - by Electricity
- 11.2. Market Analysis, Insights and Forecast - by Iron and Steel
- 11.3. Market Analysis, Insights and Forecast - by Other Applications
- 12. Competitive Analysis
- 12.1. Company Profiles
- 12.1.1 Peabody Energy Corporation
- 12.1.1.1. Company Overview
- 12.1.1.2. Products
- 12.1.1.3. Company Financials
- 12.1.1.4. SWOT Analysis
- 12.1.2 HardRock Coal Mining Pty Ltd
- 12.1.2.1. Company Overview
- 12.1.2.2. Products
- 12.1.2.3. Company Financials
- 12.1.2.4. SWOT Analysis
- 12.1.3 Bloomfield Collieries Pty Ltd
- 12.1.3.1. Company Overview
- 12.1.3.2. Products
- 12.1.3.3. Company Financials
- 12.1.3.4. SWOT Analysis
- 12.1.4 Yancoal Australia Ltd
- 12.1.4.1. Company Overview
- 12.1.4.2. Products
- 12.1.4.3. Company Financials
- 12.1.4.4. SWOT Analysis
- 12.1.5 Whitehaven Coal Limited*List Not Exhaustive
- 12.1.5.1. Company Overview
- 12.1.5.2. Products
- 12.1.5.3. Company Financials
- 12.1.5.4. SWOT Analysis
- 12.1.6 Idemitsu Australia Resources Pty Ltd
- 12.1.6.1. Company Overview
- 12.1.6.2. Products
- 12.1.6.3. Company Financials
- 12.1.6.4. SWOT Analysis
- 12.1.7 Jellinbah Group Pty Ltd
- 12.1.7.1. Company Overview
- 12.1.7.2. Products
- 12.1.7.3. Company Financials
- 12.1.7.4. SWOT Analysis
- 12.1.8 BHP Group Ltd
- 12.1.8.1. Company Overview
- 12.1.8.2. Products
- 12.1.8.3. Company Financials
- 12.1.8.4. SWOT Analysis
- 12.1.9 Centennial Coal Company Ltd
- 12.1.9.1. Company Overview
- 12.1.9.2. Products
- 12.1.9.3. Company Financials
- 12.1.9.4. SWOT Analysis
- 12.1.10 Vale S A
- 12.1.10.1. Company Overview
- 12.1.10.2. Products
- 12.1.10.3. Company Financials
- 12.1.10.4. SWOT Analysis
- 12.1.1 Peabody Energy Corporation
- 12.2. Market Entropy
- 12.2.1 Company's Key Areas Served
- 12.2.2 Recent Developments
- 12.3. Company Market Share Analysis 2025
- 12.3.1 Top 5 Companies Market Share Analysis
- 12.3.2 Top 3 Companies Market Share Analysis
- 12.4. List of Potential Customers
- 13. Research Methodology
List of Figures
- Figure 1: Global Coal Industry Australia Revenue Breakdown (billion, %) by Region 2025 & 2033
- Figure 2: Global Coal Industry Australia Volume Breakdown (Kiloton, %) by Region 2025 & 2033
- Figure 3: North America Coal Industry Australia Revenue (billion), by Electricity 2025 & 2033
- Figure 4: North America Coal Industry Australia Volume (Kiloton), by Electricity 2025 & 2033
- Figure 5: North America Coal Industry Australia Revenue Share (%), by Electricity 2025 & 2033
- Figure 6: North America Coal Industry Australia Volume Share (%), by Electricity 2025 & 2033
- Figure 7: North America Coal Industry Australia Revenue (billion), by Iron and Steel 2025 & 2033
- Figure 8: North America Coal Industry Australia Volume (Kiloton), by Iron and Steel 2025 & 2033
- Figure 9: North America Coal Industry Australia Revenue Share (%), by Iron and Steel 2025 & 2033
- Figure 10: North America Coal Industry Australia Volume Share (%), by Iron and Steel 2025 & 2033
- Figure 11: North America Coal Industry Australia Revenue (billion), by Other Applications 2025 & 2033
- Figure 12: North America Coal Industry Australia Volume (Kiloton), by Other Applications 2025 & 2033
- Figure 13: North America Coal Industry Australia Revenue Share (%), by Other Applications 2025 & 2033
- Figure 14: North America Coal Industry Australia Volume Share (%), by Other Applications 2025 & 2033
- Figure 15: North America Coal Industry Australia Revenue (billion), by Country 2025 & 2033
- Figure 16: North America Coal Industry Australia Volume (Kiloton), by Country 2025 & 2033
- Figure 17: North America Coal Industry Australia Revenue Share (%), by Country 2025 & 2033
- Figure 18: North America Coal Industry Australia Volume Share (%), by Country 2025 & 2033
- Figure 19: South America Coal Industry Australia Revenue (billion), by Electricity 2025 & 2033
- Figure 20: South America Coal Industry Australia Volume (Kiloton), by Electricity 2025 & 2033
- Figure 21: South America Coal Industry Australia Revenue Share (%), by Electricity 2025 & 2033
- Figure 22: South America Coal Industry Australia Volume Share (%), by Electricity 2025 & 2033
- Figure 23: South America Coal Industry Australia Revenue (billion), by Iron and Steel 2025 & 2033
- Figure 24: South America Coal Industry Australia Volume (Kiloton), by Iron and Steel 2025 & 2033
- Figure 25: South America Coal Industry Australia Revenue Share (%), by Iron and Steel 2025 & 2033
- Figure 26: South America Coal Industry Australia Volume Share (%), by Iron and Steel 2025 & 2033
- Figure 27: South America Coal Industry Australia Revenue (billion), by Other Applications 2025 & 2033
- Figure 28: South America Coal Industry Australia Volume (Kiloton), by Other Applications 2025 & 2033
- Figure 29: South America Coal Industry Australia Revenue Share (%), by Other Applications 2025 & 2033
- Figure 30: South America Coal Industry Australia Volume Share (%), by Other Applications 2025 & 2033
- Figure 31: South America Coal Industry Australia Revenue (billion), by Country 2025 & 2033
- Figure 32: South America Coal Industry Australia Volume (Kiloton), by Country 2025 & 2033
- Figure 33: South America Coal Industry Australia Revenue Share (%), by Country 2025 & 2033
- Figure 34: South America Coal Industry Australia Volume Share (%), by Country 2025 & 2033
- Figure 35: Europe Coal Industry Australia Revenue (billion), by Electricity 2025 & 2033
- Figure 36: Europe Coal Industry Australia Volume (Kiloton), by Electricity 2025 & 2033
- Figure 37: Europe Coal Industry Australia Revenue Share (%), by Electricity 2025 & 2033
- Figure 38: Europe Coal Industry Australia Volume Share (%), by Electricity 2025 & 2033
- Figure 39: Europe Coal Industry Australia Revenue (billion), by Iron and Steel 2025 & 2033
- Figure 40: Europe Coal Industry Australia Volume (Kiloton), by Iron and Steel 2025 & 2033
- Figure 41: Europe Coal Industry Australia Revenue Share (%), by Iron and Steel 2025 & 2033
- Figure 42: Europe Coal Industry Australia Volume Share (%), by Iron and Steel 2025 & 2033
- Figure 43: Europe Coal Industry Australia Revenue (billion), by Other Applications 2025 & 2033
- Figure 44: Europe Coal Industry Australia Volume (Kiloton), by Other Applications 2025 & 2033
- Figure 45: Europe Coal Industry Australia Revenue Share (%), by Other Applications 2025 & 2033
- Figure 46: Europe Coal Industry Australia Volume Share (%), by Other Applications 2025 & 2033
- Figure 47: Europe Coal Industry Australia Revenue (billion), by Country 2025 & 2033
- Figure 48: Europe Coal Industry Australia Volume (Kiloton), by Country 2025 & 2033
- Figure 49: Europe Coal Industry Australia Revenue Share (%), by Country 2025 & 2033
- Figure 50: Europe Coal Industry Australia Volume Share (%), by Country 2025 & 2033
- Figure 51: Middle East & Africa Coal Industry Australia Revenue (billion), by Electricity 2025 & 2033
- Figure 52: Middle East & Africa Coal Industry Australia Volume (Kiloton), by Electricity 2025 & 2033
- Figure 53: Middle East & Africa Coal Industry Australia Revenue Share (%), by Electricity 2025 & 2033
- Figure 54: Middle East & Africa Coal Industry Australia Volume Share (%), by Electricity 2025 & 2033
- Figure 55: Middle East & Africa Coal Industry Australia Revenue (billion), by Iron and Steel 2025 & 2033
- Figure 56: Middle East & Africa Coal Industry Australia Volume (Kiloton), by Iron and Steel 2025 & 2033
- Figure 57: Middle East & Africa Coal Industry Australia Revenue Share (%), by Iron and Steel 2025 & 2033
- Figure 58: Middle East & Africa Coal Industry Australia Volume Share (%), by Iron and Steel 2025 & 2033
- Figure 59: Middle East & Africa Coal Industry Australia Revenue (billion), by Other Applications 2025 & 2033
- Figure 60: Middle East & Africa Coal Industry Australia Volume (Kiloton), by Other Applications 2025 & 2033
- Figure 61: Middle East & Africa Coal Industry Australia Revenue Share (%), by Other Applications 2025 & 2033
- Figure 62: Middle East & Africa Coal Industry Australia Volume Share (%), by Other Applications 2025 & 2033
- Figure 63: Middle East & Africa Coal Industry Australia Revenue (billion), by Country 2025 & 2033
- Figure 64: Middle East & Africa Coal Industry Australia Volume (Kiloton), by Country 2025 & 2033
- Figure 65: Middle East & Africa Coal Industry Australia Revenue Share (%), by Country 2025 & 2033
- Figure 66: Middle East & Africa Coal Industry Australia Volume Share (%), by Country 2025 & 2033
- Figure 67: Asia Pacific Coal Industry Australia Revenue (billion), by Electricity 2025 & 2033
- Figure 68: Asia Pacific Coal Industry Australia Volume (Kiloton), by Electricity 2025 & 2033
- Figure 69: Asia Pacific Coal Industry Australia Revenue Share (%), by Electricity 2025 & 2033
- Figure 70: Asia Pacific Coal Industry Australia Volume Share (%), by Electricity 2025 & 2033
- Figure 71: Asia Pacific Coal Industry Australia Revenue (billion), by Iron and Steel 2025 & 2033
- Figure 72: Asia Pacific Coal Industry Australia Volume (Kiloton), by Iron and Steel 2025 & 2033
- Figure 73: Asia Pacific Coal Industry Australia Revenue Share (%), by Iron and Steel 2025 & 2033
- Figure 74: Asia Pacific Coal Industry Australia Volume Share (%), by Iron and Steel 2025 & 2033
- Figure 75: Asia Pacific Coal Industry Australia Revenue (billion), by Other Applications 2025 & 2033
- Figure 76: Asia Pacific Coal Industry Australia Volume (Kiloton), by Other Applications 2025 & 2033
- Figure 77: Asia Pacific Coal Industry Australia Revenue Share (%), by Other Applications 2025 & 2033
- Figure 78: Asia Pacific Coal Industry Australia Volume Share (%), by Other Applications 2025 & 2033
- Figure 79: Asia Pacific Coal Industry Australia Revenue (billion), by Country 2025 & 2033
- Figure 80: Asia Pacific Coal Industry Australia Volume (Kiloton), by Country 2025 & 2033
- Figure 81: Asia Pacific Coal Industry Australia Revenue Share (%), by Country 2025 & 2033
- Figure 82: Asia Pacific Coal Industry Australia Volume Share (%), by Country 2025 & 2033
List of Tables
- Table 1: Global Coal Industry Australia Revenue billion Forecast, by Electricity 2020 & 2033
- Table 2: Global Coal Industry Australia Volume Kiloton Forecast, by Electricity 2020 & 2033
- Table 3: Global Coal Industry Australia Revenue billion Forecast, by Iron and Steel 2020 & 2033
- Table 4: Global Coal Industry Australia Volume Kiloton Forecast, by Iron and Steel 2020 & 2033
- Table 5: Global Coal Industry Australia Revenue billion Forecast, by Other Applications 2020 & 2033
- Table 6: Global Coal Industry Australia Volume Kiloton Forecast, by Other Applications 2020 & 2033
- Table 7: Global Coal Industry Australia Revenue billion Forecast, by Region 2020 & 2033
- Table 8: Global Coal Industry Australia Volume Kiloton Forecast, by Region 2020 & 2033
- Table 9: Global Coal Industry Australia Revenue billion Forecast, by Electricity 2020 & 2033
- Table 10: Global Coal Industry Australia Volume Kiloton Forecast, by Electricity 2020 & 2033
- Table 11: Global Coal Industry Australia Revenue billion Forecast, by Iron and Steel 2020 & 2033
- Table 12: Global Coal Industry Australia Volume Kiloton Forecast, by Iron and Steel 2020 & 2033
- Table 13: Global Coal Industry Australia Revenue billion Forecast, by Other Applications 2020 & 2033
- Table 14: Global Coal Industry Australia Volume Kiloton Forecast, by Other Applications 2020 & 2033
- Table 15: Global Coal Industry Australia Revenue billion Forecast, by Country 2020 & 2033
- Table 16: Global Coal Industry Australia Volume Kiloton Forecast, by Country 2020 & 2033
- Table 17: United States Coal Industry Australia Revenue (billion) Forecast, by Application 2020 & 2033
- Table 18: United States Coal Industry Australia Volume (Kiloton) Forecast, by Application 2020 & 2033
- Table 19: Canada Coal Industry Australia Revenue (billion) Forecast, by Application 2020 & 2033
- Table 20: Canada Coal Industry Australia Volume (Kiloton) Forecast, by Application 2020 & 2033
- Table 21: Mexico Coal Industry Australia Revenue (billion) Forecast, by Application 2020 & 2033
- Table 22: Mexico Coal Industry Australia Volume (Kiloton) Forecast, by Application 2020 & 2033
- Table 23: Global Coal Industry Australia Revenue billion Forecast, by Electricity 2020 & 2033
- Table 24: Global Coal Industry Australia Volume Kiloton Forecast, by Electricity 2020 & 2033
- Table 25: Global Coal Industry Australia Revenue billion Forecast, by Iron and Steel 2020 & 2033
- Table 26: Global Coal Industry Australia Volume Kiloton Forecast, by Iron and Steel 2020 & 2033
- Table 27: Global Coal Industry Australia Revenue billion Forecast, by Other Applications 2020 & 2033
- Table 28: Global Coal Industry Australia Volume Kiloton Forecast, by Other Applications 2020 & 2033
- Table 29: Global Coal Industry Australia Revenue billion Forecast, by Country 2020 & 2033
- Table 30: Global Coal Industry Australia Volume Kiloton Forecast, by Country 2020 & 2033
- Table 31: Brazil Coal Industry Australia Revenue (billion) Forecast, by Application 2020 & 2033
- Table 32: Brazil Coal Industry Australia Volume (Kiloton) Forecast, by Application 2020 & 2033
- Table 33: Argentina Coal Industry Australia Revenue (billion) Forecast, by Application 2020 & 2033
- Table 34: Argentina Coal Industry Australia Volume (Kiloton) Forecast, by Application 2020 & 2033
- Table 35: Rest of South America Coal Industry Australia Revenue (billion) Forecast, by Application 2020 & 2033
- Table 36: Rest of South America Coal Industry Australia Volume (Kiloton) Forecast, by Application 2020 & 2033
- Table 37: Global Coal Industry Australia Revenue billion Forecast, by Electricity 2020 & 2033
- Table 38: Global Coal Industry Australia Volume Kiloton Forecast, by Electricity 2020 & 2033
- Table 39: Global Coal Industry Australia Revenue billion Forecast, by Iron and Steel 2020 & 2033
- Table 40: Global Coal Industry Australia Volume Kiloton Forecast, by Iron and Steel 2020 & 2033
- Table 41: Global Coal Industry Australia Revenue billion Forecast, by Other Applications 2020 & 2033
- Table 42: Global Coal Industry Australia Volume Kiloton Forecast, by Other Applications 2020 & 2033
- Table 43: Global Coal Industry Australia Revenue billion Forecast, by Country 2020 & 2033
- Table 44: Global Coal Industry Australia Volume Kiloton Forecast, by Country 2020 & 2033
- Table 45: United Kingdom Coal Industry Australia Revenue (billion) Forecast, by Application 2020 & 2033
- Table 46: United Kingdom Coal Industry Australia Volume (Kiloton) Forecast, by Application 2020 & 2033
- Table 47: Germany Coal Industry Australia Revenue (billion) Forecast, by Application 2020 & 2033
- Table 48: Germany Coal Industry Australia Volume (Kiloton) Forecast, by Application 2020 & 2033
- Table 49: France Coal Industry Australia Revenue (billion) Forecast, by Application 2020 & 2033
- Table 50: France Coal Industry Australia Volume (Kiloton) Forecast, by Application 2020 & 2033
- Table 51: Italy Coal Industry Australia Revenue (billion) Forecast, by Application 2020 & 2033
- Table 52: Italy Coal Industry Australia Volume (Kiloton) Forecast, by Application 2020 & 2033
- Table 53: Spain Coal Industry Australia Revenue (billion) Forecast, by Application 2020 & 2033
- Table 54: Spain Coal Industry Australia Volume (Kiloton) Forecast, by Application 2020 & 2033
- Table 55: Russia Coal Industry Australia Revenue (billion) Forecast, by Application 2020 & 2033
- Table 56: Russia Coal Industry Australia Volume (Kiloton) Forecast, by Application 2020 & 2033
- Table 57: Benelux Coal Industry Australia Revenue (billion) Forecast, by Application 2020 & 2033
- Table 58: Benelux Coal Industry Australia Volume (Kiloton) Forecast, by Application 2020 & 2033
- Table 59: Nordics Coal Industry Australia Revenue (billion) Forecast, by Application 2020 & 2033
- Table 60: Nordics Coal Industry Australia Volume (Kiloton) Forecast, by Application 2020 & 2033
- Table 61: Rest of Europe Coal Industry Australia Revenue (billion) Forecast, by Application 2020 & 2033
- Table 62: Rest of Europe Coal Industry Australia Volume (Kiloton) Forecast, by Application 2020 & 2033
- Table 63: Global Coal Industry Australia Revenue billion Forecast, by Electricity 2020 & 2033
- Table 64: Global Coal Industry Australia Volume Kiloton Forecast, by Electricity 2020 & 2033
- Table 65: Global Coal Industry Australia Revenue billion Forecast, by Iron and Steel 2020 & 2033
- Table 66: Global Coal Industry Australia Volume Kiloton Forecast, by Iron and Steel 2020 & 2033
- Table 67: Global Coal Industry Australia Revenue billion Forecast, by Other Applications 2020 & 2033
- Table 68: Global Coal Industry Australia Volume Kiloton Forecast, by Other Applications 2020 & 2033
- Table 69: Global Coal Industry Australia Revenue billion Forecast, by Country 2020 & 2033
- Table 70: Global Coal Industry Australia Volume Kiloton Forecast, by Country 2020 & 2033
- Table 71: Turkey Coal Industry Australia Revenue (billion) Forecast, by Application 2020 & 2033
- Table 72: Turkey Coal Industry Australia Volume (Kiloton) Forecast, by Application 2020 & 2033
- Table 73: Israel Coal Industry Australia Revenue (billion) Forecast, by Application 2020 & 2033
- Table 74: Israel Coal Industry Australia Volume (Kiloton) Forecast, by Application 2020 & 2033
- Table 75: GCC Coal Industry Australia Revenue (billion) Forecast, by Application 2020 & 2033
- Table 76: GCC Coal Industry Australia Volume (Kiloton) Forecast, by Application 2020 & 2033
- Table 77: North Africa Coal Industry Australia Revenue (billion) Forecast, by Application 2020 & 2033
- Table 78: North Africa Coal Industry Australia Volume (Kiloton) Forecast, by Application 2020 & 2033
- Table 79: South Africa Coal Industry Australia Revenue (billion) Forecast, by Application 2020 & 2033
- Table 80: South Africa Coal Industry Australia Volume (Kiloton) Forecast, by Application 2020 & 2033
- Table 81: Rest of Middle East & Africa Coal Industry Australia Revenue (billion) Forecast, by Application 2020 & 2033
- Table 82: Rest of Middle East & Africa Coal Industry Australia Volume (Kiloton) Forecast, by Application 2020 & 2033
- Table 83: Global Coal Industry Australia Revenue billion Forecast, by Electricity 2020 & 2033
- Table 84: Global Coal Industry Australia Volume Kiloton Forecast, by Electricity 2020 & 2033
- Table 85: Global Coal Industry Australia Revenue billion Forecast, by Iron and Steel 2020 & 2033
- Table 86: Global Coal Industry Australia Volume Kiloton Forecast, by Iron and Steel 2020 & 2033
- Table 87: Global Coal Industry Australia Revenue billion Forecast, by Other Applications 2020 & 2033
- Table 88: Global Coal Industry Australia Volume Kiloton Forecast, by Other Applications 2020 & 2033
- Table 89: Global Coal Industry Australia Revenue billion Forecast, by Country 2020 & 2033
- Table 90: Global Coal Industry Australia Volume Kiloton Forecast, by Country 2020 & 2033
- Table 91: China Coal Industry Australia Revenue (billion) Forecast, by Application 2020 & 2033
- Table 92: China Coal Industry Australia Volume (Kiloton) Forecast, by Application 2020 & 2033
- Table 93: India Coal Industry Australia Revenue (billion) Forecast, by Application 2020 & 2033
- Table 94: India Coal Industry Australia Volume (Kiloton) Forecast, by Application 2020 & 2033
- Table 95: Japan Coal Industry Australia Revenue (billion) Forecast, by Application 2020 & 2033
- Table 96: Japan Coal Industry Australia Volume (Kiloton) Forecast, by Application 2020 & 2033
- Table 97: South Korea Coal Industry Australia Revenue (billion) Forecast, by Application 2020 & 2033
- Table 98: South Korea Coal Industry Australia Volume (Kiloton) Forecast, by Application 2020 & 2033
- Table 99: ASEAN Coal Industry Australia Revenue (billion) Forecast, by Application 2020 & 2033
- Table 100: ASEAN Coal Industry Australia Volume (Kiloton) Forecast, by Application 2020 & 2033
- Table 101: Oceania Coal Industry Australia Revenue (billion) Forecast, by Application 2020 & 2033
- Table 102: Oceania Coal Industry Australia Volume (Kiloton) Forecast, by Application 2020 & 2033
- Table 103: Rest of Asia Pacific Coal Industry Australia Revenue (billion) Forecast, by Application 2020 & 2033
- Table 104: Rest of Asia Pacific Coal Industry Australia Volume (Kiloton) Forecast, by Application 2020 & 2033
Frequently Asked Questions
1. What is the projected Compound Annual Growth Rate (CAGR) of the Coal Industry Australia?
The projected CAGR is approximately 2.2%.
2. Which companies are prominent players in the Coal Industry Australia?
Key companies in the market include Peabody Energy Corporation, HardRock Coal Mining Pty Ltd, Bloomfield Collieries Pty Ltd, Yancoal Australia Ltd, Whitehaven Coal Limited*List Not Exhaustive, Idemitsu Australia Resources Pty Ltd, Jellinbah Group Pty Ltd, BHP Group Ltd, Centennial Coal Company Ltd, Vale S A.
3. What are the main segments of the Coal Industry Australia?
The market segments include Electricity, Iron and Steel, Other Applications.
4. Can you provide details about the market size?
The market size is estimated to be USD 57 billion as of 2022.
5. What are some drivers contributing to market growth?
4.; Increase in Prices of Electricity Procured from Conventional Mechanisms 4.; Decline in Cost of Solar Energy Infrastructure.
6. What are the notable trends driving market growth?
Demand for Bituminous Coal to Drive the Market.
7. Are there any restraints impacting market growth?
4.; Competition from Other Alternative Energy Sources.
8. Can you provide examples of recent developments in the market?
September 2022: AGL Energy announced the company's coal-fired Loy Yang A power station in Victoria will close in 2035.
9. What pricing options are available for accessing the report?
Pricing options include single-user, multi-user, and enterprise licenses priced at USD 3800, USD 4500, and USD 5800 respectively.
10. Is the market size provided in terms of value or volume?
The market size is provided in terms of value, measured in billion and volume, measured in Kiloton.
11. Are there any specific market keywords associated with the report?
Yes, the market keyword associated with the report is "Coal Industry Australia," which aids in identifying and referencing the specific market segment covered.
12. How do I determine which pricing option suits my needs best?
The pricing options vary based on user requirements and access needs. Individual users may opt for single-user licenses, while businesses requiring broader access may choose multi-user or enterprise licenses for cost-effective access to the report.
13. Are there any additional resources or data provided in the Coal Industry Australia report?
While the report offers comprehensive insights, it's advisable to review the specific contents or supplementary materials provided to ascertain if additional resources or data are available.
14. How can I stay updated on further developments or reports in the Coal Industry Australia?
To stay informed about further developments, trends, and reports in the Coal Industry Australia, consider subscribing to industry newsletters, following relevant companies and organizations, or regularly checking reputable industry news sources and publications.
Methodology
Step 1 - Identification of Relevant Samples Size from Population Database


Step 2 - Approaches for Defining Global Market Size (Value, Volume* & Price*)

Note*: In applicable scenarios
Step 3 - Data Sources
Primary Research
- Web Analytics
- Survey Reports
- Research Institute
- Latest Research Reports
- Opinion Leaders
Secondary Research
- Annual Reports
- White Paper
- Latest Press Release
- Industry Association
- Paid Database
- Investor Presentations

Step 4 - Data Triangulation
Involves using different sources of information in order to increase the validity of a study
These sources are likely to be stakeholders in a program - participants, other researchers, program staff, other community members, and so on.
Then we put all data in single framework & apply various statistical tools to find out the dynamic on the market.
During the analysis stage, feedback from the stakeholder groups would be compared to determine areas of agreement as well as areas of divergence