

Key Insights
The Cooling Tower Rental Market is poised for significant expansion, projecting a Compound Annual Growth Rate (CAGR) of 6.2%. This growth trajectory spans from the base year of 2025 to 2033. The market's current valuation stands at $1.39 billion. This upward trend is propelled by increasing global industrialization and urbanization, driving the need for adaptable and temporary cooling infrastructure. The inherent flexibility and cost advantages of rental solutions, especially for businesses with variable cooling demands or short-term operational needs, are key market drivers. Moreover, evolving environmental mandates related to water conservation and emissions are encouraging the adoption of sustainable cooling technologies, thereby indirectly stimulating demand for energy-efficient rental cooling towers. The market is segmented by cooling tower type (wet, dry, hybrid) and end-user sector (commercial, industrial). The industrial sector currently represents the largest market share due to its substantial cooling requirements. North America and Europe lead in market dominance, but the Asia-Pacific region is expected to experience substantial growth driven by rapid industrial development and infrastructure expansion. Key industry players, including SPX Cooling Technologies, Johnson Controls, and KTK Kühlturm, are actively enhancing their technological offerings and service networks to secure market positions. Competitive pricing and the expansion of rental fleet capacities are critical competitive differentiators.
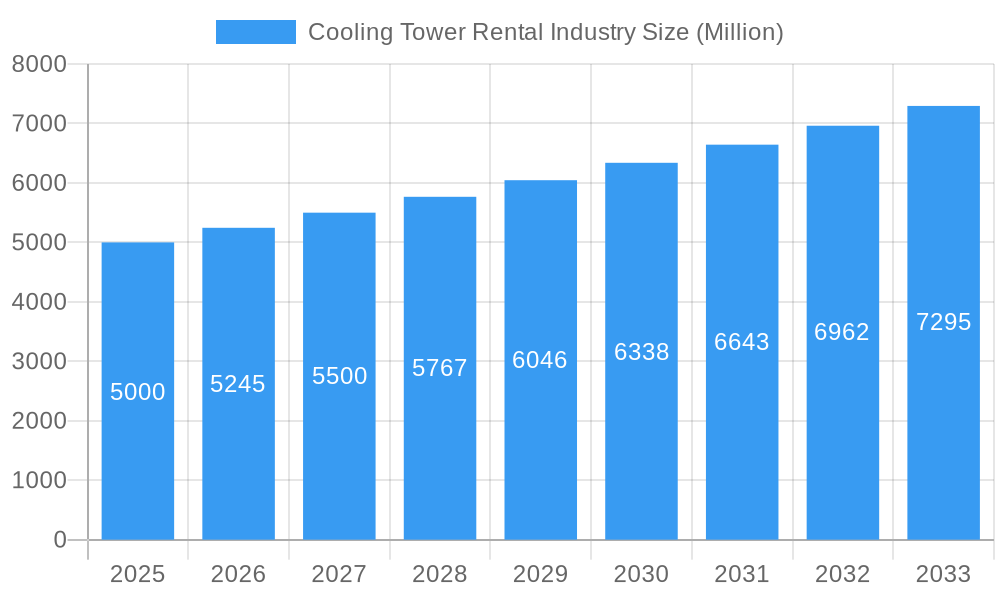
Cooling Tower Rental Industry Market Size (In Billion)
Challenges to market growth include volatility in raw material prices, economic downturns impacting industrial output, and the potential emergence of new market competitors. However, the overall market outlook remains highly favorable. The integration of advanced technologies, such as smart controls and remote monitoring systems, is enhancing operational efficiency and reducing energy consumption, further augmenting the attractiveness of rental cooling towers. The growing adoption of modular and prefabricated cooling solutions is also anticipated to foster market expansion. The rental market is expected to see increased demand for hybrid cooling towers, which offer superior energy efficiency and operational flexibility compared to conventional wet cooling towers. Government initiatives and incentives promoting energy-efficient cooling technologies will also contribute to growth, creating opportunities for rental providers to offer a broader spectrum of environmentally friendly solutions. Strategic market analysis, incorporating macroeconomic trends and regulatory shifts, is essential for sustained growth in this dynamic sector.
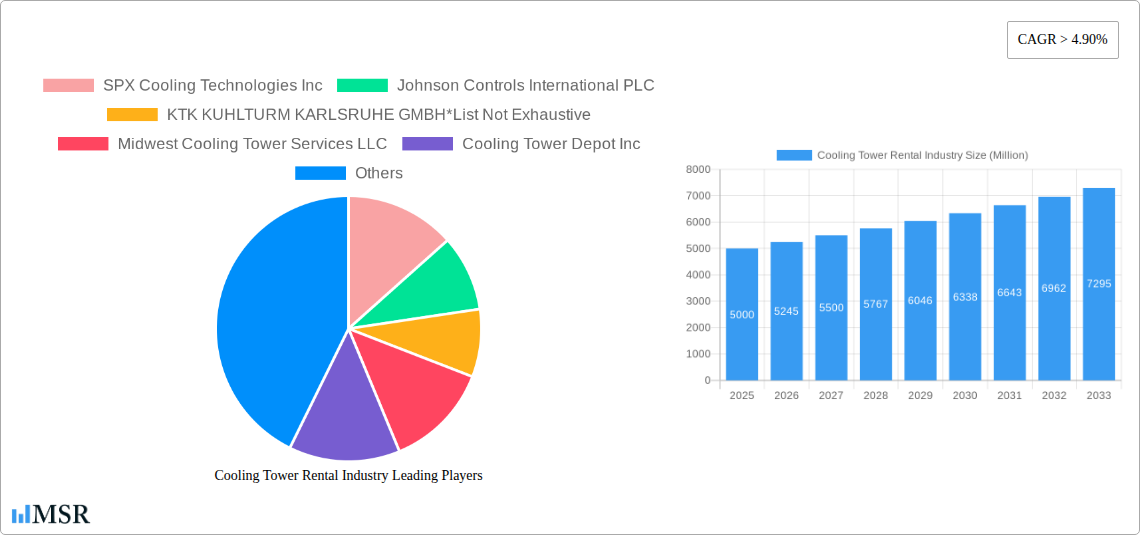
Cooling Tower Rental Industry Company Market Share
Cooling Tower Rental Industry Market Report: 2019-2033
This comprehensive report provides a detailed analysis of the Cooling Tower Rental industry, offering invaluable insights for stakeholders, investors, and industry professionals. Covering the period from 2019 to 2033, with a focus on 2025, this report delves into market dynamics, key players, and future growth potential, providing actionable intelligence to navigate the evolving landscape. The global market value is projected to reach $XX Million by 2033.
Cooling Tower Rental Industry Market Concentration & Dynamics
The cooling tower rental market is characterized by a moderately concentrated landscape, with several major players holding significant market share. Companies like SPX Cooling Technologies Inc, Johnson Controls International PLC, and KTK KUHLTURM KARLSRUHE GMBH, alongside regional players such as Midwest Cooling Tower Services LLC, Cooling Tower Depot Inc, and others, compete for market dominance. The industry's innovation ecosystem is driven by advancements in energy efficiency, automation, and materials science. Regulatory frameworks, particularly concerning environmental regulations and safety standards, significantly influence market operations. Substitute products, including evaporative coolers and air conditioning systems, exert competitive pressure. End-user trends, particularly in the industrial and commercial sectors, significantly influence demand. The number of M&A activities in the historical period (2019-2024) stood at XX, resulting in a market share shift among key players. Market share analysis reveals that the top 5 players collectively hold approximately XX% of the market share.
- Market Concentration: Moderately concentrated.
- Innovation: Focus on energy efficiency, automation, and material science.
- Regulatory: Stringent environmental and safety standards.
- Substitutes: Evaporative coolers, air conditioning systems.
- M&A Activity (2019-2024): XX deals.
Cooling Tower Rental Industry Insights & Trends
The cooling tower rental market witnessed a CAGR of XX% during the historical period (2019-2024), reaching a market size of $XX Million in 2024. Market growth is primarily driven by increasing industrialization, urbanization, and the rising demand for efficient cooling solutions in various sectors. Technological disruptions, such as the adoption of smart cooling technologies and remote monitoring systems, are transforming the industry. Evolving consumer behaviors, including a preference for sustainable and cost-effective solutions, are shaping market demand. The forecast period (2025-2033) anticipates continued growth, driven by expanding industrial infrastructure, particularly in developing economies. The market is projected to reach $XX Million by 2033, exhibiting a CAGR of XX%.
Key Markets & Segments Leading Cooling Tower Rental Industry
The industrial sector represents the dominant end-user segment, accounting for approximately XX% of the market share in 2024. Geographically, North America and Asia-Pacific are the leading regions, driven by robust industrial activity and infrastructure development. Within cooling tower types, wet cooling towers hold the largest market share due to their cost-effectiveness and established technology.
- Dominant Region: North America and Asia-Pacific
- Dominant End-User: Industrial
- Dominant Type: Wet Cooling Towers
Drivers:
- Strong economic growth in developing economies.
- Expansion of industrial infrastructure and manufacturing.
- Growing demand for efficient cooling in data centers and power plants.
Cooling Tower Rental Industry Product Developments
Recent product innovations focus on improving energy efficiency, reducing water consumption, and enhancing operational reliability. Advancements in materials science, such as the use of corrosion-resistant materials, are extending the lifespan of rental units. Smart technologies, including remote monitoring and predictive maintenance capabilities, are enhancing the value proposition for customers. These innovations provide competitive advantages, attracting environmentally conscious customers and boosting operational efficiency.
Challenges in the Cooling Tower Rental Industry Market
The cooling tower rental industry faces challenges including stringent environmental regulations, supply chain disruptions impacting material availability and transportation costs, and intense competition from established players and new entrants. These factors contribute to fluctuating pricing and operational complexities. The COVID-19 pandemic significantly impacted the market in 2020, resulting in a XX% decrease in rental demand due to refinery shutdowns and reduced industrial activity. Supply chain issues during this period added to operational challenges.
Forces Driving Cooling Tower Rental Industry Growth
Key growth drivers include increasing industrial activity, particularly in emerging economies; rising demand for efficient cooling solutions in data centers and power plants; government initiatives promoting energy efficiency and sustainable technologies; and technological advancements enhancing cooling tower performance and reducing operational costs.
Long-Term Growth Catalysts in the Cooling Tower Rental Industry
Long-term growth will be driven by sustained technological innovation, strategic partnerships to expand market reach, and expansion into new geographic markets. The development of advanced materials, automation, and smart technologies will further enhance cooling tower performance and sustainability, driving market expansion.
Emerging Opportunities in Cooling Tower Rental Industry
Emerging opportunities include the expanding data center market, the increasing adoption of renewable energy sources (requiring efficient cooling solutions), and the growing focus on sustainable and eco-friendly cooling technologies. New markets in developing economies and niche applications such as modular cooling solutions will also present growth potential.
Leading Players in the Cooling Tower Rental Industry Sector
- SPX Cooling Technologies Inc
- Johnson Controls International PLC
- KTK KUHLTURM KARLSRUHE GMBH
- Midwest Cooling Tower Services LLC
- Cooling Tower Depot Inc
- Caterpillar Inc
- Aggreko PLC
- Baltimore Aircoil Co
- Carrier Rental Systems Inc
- United Rentals Inc
Key Milestones in Cooling Tower Rental Industry Industry
- 2020 Q2: COVID-19 pandemic significantly reduces demand due to refinery shutdowns and reduced industrial activity.
- 2021 Q4: Gradual market recovery begins as industrial activity resumes.
- 2022: Introduction of several new energy-efficient cooling tower models by major players.
- 2023: Increased focus on sustainable and eco-friendly cooling solutions.
- 2024: Several strategic partnerships formed to expand market reach and service capabilities.
Strategic Outlook for Cooling Tower Rental Industry Market
The cooling tower rental market holds significant future potential, driven by consistent growth in industrial activity, technological advancements, and increasing demand for sustainable cooling solutions. Strategic opportunities lie in expanding into new geographic markets, focusing on niche applications, and developing innovative products that cater to evolving customer needs and environmental regulations. The market is poised for continued growth, offering lucrative opportunities for businesses that can adapt to the changing market dynamics.
Cooling Tower Rental Industry Segmentation
-
1. Type
- 1.1. Wet
- 1.2. Dry
- 1.3. Hybrid
-
2. End User
- 2.1. Commercial
- 2.2. Industrial
Cooling Tower Rental Industry Segmentation By Geography
- 1. North America
- 2. Europe
- 3. Asia Pacific
- 4. Middle East and Africa
- 5. South America
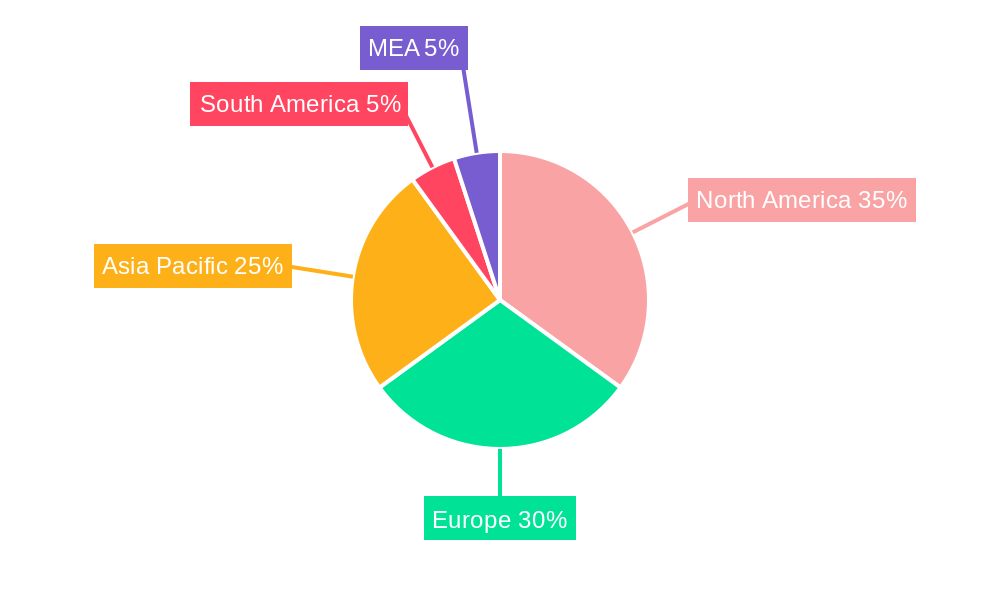
Cooling Tower Rental Industry Regional Market Share
Geographic Coverage of Cooling Tower Rental Industry
Cooling Tower Rental Industry REPORT HIGHLIGHTS
| Aspects | Details |
|---|---|
| Study Period | 2020-2034 |
| Base Year | 2025 |
| Estimated Year | 2026 |
| Forecast Period | 2026-2034 |
| Historical Period | 2020-2025 |
| Growth Rate | CAGR of 6.2% from 2020-2034 |
| Segmentation |
|
Table of Contents
- 1. Introduction
- 1.1. Research Scope
- 1.2. Market Segmentation
- 1.3. Research Objective
- 1.4. Definitions and Assumptions
- 2. Executive Summary
- 2.1. Market Snapshot
- 3. Market Dynamics
- 3.1. Market Drivers
- 3.2. Market Restrains
- 3.3. Market Trends
- 3.4. Market Opportunities
- 4. Market Factor Analysis
- 4.1. Porters Five Forces
- 4.1.1. Bargaining Power of Suppliers
- 4.1.2. Bargaining Power of Buyers
- 4.1.3. Threat of New Entrants
- 4.1.4. Threat of Substitutes
- 4.1.5. Competitive Rivalry
- 4.2. PESTEL analysis
- 4.3. BCG Analysis
- 4.3.1. Stars (High Growth, High Market Share)
- 4.3.2. Cash Cows (Low Growth, High Market Share)
- 4.3.3. Question Mark (High Growth, Low Market Share)
- 4.3.4. Dogs (Low Growth, Low Market Share)
- 4.4. Ansoff Matrix Analysis
- 4.5. Supply Chain Analysis
- 4.6. Regulatory Landscape
- 4.7. Current Market Potential and Opportunity Assessment (TAM–SAM–SOM Framework)
- 4.8. MSR Analyst Note
- 4.1. Porters Five Forces
- 5. Market Analysis, Insights and Forecast 2021-2033
- 5.1. Market Analysis, Insights and Forecast - by Type
- 5.1.1. Wet
- 5.1.2. Dry
- 5.1.3. Hybrid
- 5.2. Market Analysis, Insights and Forecast - by End User
- 5.2.1. Commercial
- 5.2.2. Industrial
- 5.3. Market Analysis, Insights and Forecast - by Region
- 5.3.1. North America
- 5.3.2. Europe
- 5.3.3. Asia Pacific
- 5.3.4. Middle East and Africa
- 5.3.5. South America
- 5.1. Market Analysis, Insights and Forecast - by Type
- 6. Global Cooling Tower Rental Industry Analysis, Insights and Forecast, 2021-2033
- 6.1. Market Analysis, Insights and Forecast - by Type
- 6.1.1. Wet
- 6.1.2. Dry
- 6.1.3. Hybrid
- 6.2. Market Analysis, Insights and Forecast - by End User
- 6.2.1. Commercial
- 6.2.2. Industrial
- 6.1. Market Analysis, Insights and Forecast - by Type
- 7. North America Cooling Tower Rental Industry Analysis, Insights and Forecast, 2020-2032
- 7.1. Market Analysis, Insights and Forecast - by Type
- 7.1.1. Wet
- 7.1.2. Dry
- 7.1.3. Hybrid
- 7.2. Market Analysis, Insights and Forecast - by End User
- 7.2.1. Commercial
- 7.2.2. Industrial
- 7.1. Market Analysis, Insights and Forecast - by Type
- 8. Europe Cooling Tower Rental Industry Analysis, Insights and Forecast, 2020-2032
- 8.1. Market Analysis, Insights and Forecast - by Type
- 8.1.1. Wet
- 8.1.2. Dry
- 8.1.3. Hybrid
- 8.2. Market Analysis, Insights and Forecast - by End User
- 8.2.1. Commercial
- 8.2.2. Industrial
- 8.1. Market Analysis, Insights and Forecast - by Type
- 9. Asia Pacific Cooling Tower Rental Industry Analysis, Insights and Forecast, 2020-2032
- 9.1. Market Analysis, Insights and Forecast - by Type
- 9.1.1. Wet
- 9.1.2. Dry
- 9.1.3. Hybrid
- 9.2. Market Analysis, Insights and Forecast - by End User
- 9.2.1. Commercial
- 9.2.2. Industrial
- 9.1. Market Analysis, Insights and Forecast - by Type
- 10. Middle East and Africa Cooling Tower Rental Industry Analysis, Insights and Forecast, 2020-2032
- 10.1. Market Analysis, Insights and Forecast - by Type
- 10.1.1. Wet
- 10.1.2. Dry
- 10.1.3. Hybrid
- 10.2. Market Analysis, Insights and Forecast - by End User
- 10.2.1. Commercial
- 10.2.2. Industrial
- 10.1. Market Analysis, Insights and Forecast - by Type
- 11. South America Cooling Tower Rental Industry Analysis, Insights and Forecast, 2020-2032
- 11.1. Market Analysis, Insights and Forecast - by Type
- 11.1.1. Wet
- 11.1.2. Dry
- 11.1.3. Hybrid
- 11.2. Market Analysis, Insights and Forecast - by End User
- 11.2.1. Commercial
- 11.2.2. Industrial
- 11.1. Market Analysis, Insights and Forecast - by Type
- 12. Competitive Analysis
- 12.1. Company Profiles
- 12.1.1 SPX Cooling Technologies Inc
- 12.1.1.1. Company Overview
- 12.1.1.2. Products
- 12.1.1.3. Company Financials
- 12.1.1.4. SWOT Analysis
- 12.1.2 Johnson Controls International PLC
- 12.1.2.1. Company Overview
- 12.1.2.2. Products
- 12.1.2.3. Company Financials
- 12.1.2.4. SWOT Analysis
- 12.1.3 KTK KUHLTURM KARLSRUHE GMBH*List Not Exhaustive
- 12.1.3.1. Company Overview
- 12.1.3.2. Products
- 12.1.3.3. Company Financials
- 12.1.3.4. SWOT Analysis
- 12.1.4 Midwest Cooling Tower Services LLC
- 12.1.4.1. Company Overview
- 12.1.4.2. Products
- 12.1.4.3. Company Financials
- 12.1.4.4. SWOT Analysis
- 12.1.5 Cooling Tower Depot Inc
- 12.1.5.1. Company Overview
- 12.1.5.2. Products
- 12.1.5.3. Company Financials
- 12.1.5.4. SWOT Analysis
- 12.1.6 Caterpillar Inc
- 12.1.6.1. Company Overview
- 12.1.6.2. Products
- 12.1.6.3. Company Financials
- 12.1.6.4. SWOT Analysis
- 12.1.7 Aggreko PLC
- 12.1.7.1. Company Overview
- 12.1.7.2. Products
- 12.1.7.3. Company Financials
- 12.1.7.4. SWOT Analysis
- 12.1.8 Baltimore Aircoil Co
- 12.1.8.1. Company Overview
- 12.1.8.2. Products
- 12.1.8.3. Company Financials
- 12.1.8.4. SWOT Analysis
- 12.1.9 Carrier Rental Systems Inc
- 12.1.9.1. Company Overview
- 12.1.9.2. Products
- 12.1.9.3. Company Financials
- 12.1.9.4. SWOT Analysis
- 12.1.10 United Rentals Inc
- 12.1.10.1. Company Overview
- 12.1.10.2. Products
- 12.1.10.3. Company Financials
- 12.1.10.4. SWOT Analysis
- 12.1.1 SPX Cooling Technologies Inc
- 12.2. Market Entropy
- 12.2.1 Company's Key Areas Served
- 12.2.2 Recent Developments
- 12.3. Company Market Share Analysis 2025
- 12.3.1 Top 5 Companies Market Share Analysis
- 12.3.2 Top 3 Companies Market Share Analysis
- 12.4. List of Potential Customers
- 13. Research Methodology
List of Figures
- Figure 1: Global Cooling Tower Rental Industry Revenue Breakdown (billion, %) by Region 2025 & 2033
- Figure 2: North America Cooling Tower Rental Industry Revenue (billion), by Type 2025 & 2033
- Figure 3: North America Cooling Tower Rental Industry Revenue Share (%), by Type 2025 & 2033
- Figure 4: North America Cooling Tower Rental Industry Revenue (billion), by End User 2025 & 2033
- Figure 5: North America Cooling Tower Rental Industry Revenue Share (%), by End User 2025 & 2033
- Figure 6: North America Cooling Tower Rental Industry Revenue (billion), by Country 2025 & 2033
- Figure 7: North America Cooling Tower Rental Industry Revenue Share (%), by Country 2025 & 2033
- Figure 8: Europe Cooling Tower Rental Industry Revenue (billion), by Type 2025 & 2033
- Figure 9: Europe Cooling Tower Rental Industry Revenue Share (%), by Type 2025 & 2033
- Figure 10: Europe Cooling Tower Rental Industry Revenue (billion), by End User 2025 & 2033
- Figure 11: Europe Cooling Tower Rental Industry Revenue Share (%), by End User 2025 & 2033
- Figure 12: Europe Cooling Tower Rental Industry Revenue (billion), by Country 2025 & 2033
- Figure 13: Europe Cooling Tower Rental Industry Revenue Share (%), by Country 2025 & 2033
- Figure 14: Asia Pacific Cooling Tower Rental Industry Revenue (billion), by Type 2025 & 2033
- Figure 15: Asia Pacific Cooling Tower Rental Industry Revenue Share (%), by Type 2025 & 2033
- Figure 16: Asia Pacific Cooling Tower Rental Industry Revenue (billion), by End User 2025 & 2033
- Figure 17: Asia Pacific Cooling Tower Rental Industry Revenue Share (%), by End User 2025 & 2033
- Figure 18: Asia Pacific Cooling Tower Rental Industry Revenue (billion), by Country 2025 & 2033
- Figure 19: Asia Pacific Cooling Tower Rental Industry Revenue Share (%), by Country 2025 & 2033
- Figure 20: Middle East and Africa Cooling Tower Rental Industry Revenue (billion), by Type 2025 & 2033
- Figure 21: Middle East and Africa Cooling Tower Rental Industry Revenue Share (%), by Type 2025 & 2033
- Figure 22: Middle East and Africa Cooling Tower Rental Industry Revenue (billion), by End User 2025 & 2033
- Figure 23: Middle East and Africa Cooling Tower Rental Industry Revenue Share (%), by End User 2025 & 2033
- Figure 24: Middle East and Africa Cooling Tower Rental Industry Revenue (billion), by Country 2025 & 2033
- Figure 25: Middle East and Africa Cooling Tower Rental Industry Revenue Share (%), by Country 2025 & 2033
- Figure 26: South America Cooling Tower Rental Industry Revenue (billion), by Type 2025 & 2033
- Figure 27: South America Cooling Tower Rental Industry Revenue Share (%), by Type 2025 & 2033
- Figure 28: South America Cooling Tower Rental Industry Revenue (billion), by End User 2025 & 2033
- Figure 29: South America Cooling Tower Rental Industry Revenue Share (%), by End User 2025 & 2033
- Figure 30: South America Cooling Tower Rental Industry Revenue (billion), by Country 2025 & 2033
- Figure 31: South America Cooling Tower Rental Industry Revenue Share (%), by Country 2025 & 2033
List of Tables
- Table 1: Global Cooling Tower Rental Industry Revenue billion Forecast, by Type 2020 & 2033
- Table 2: Global Cooling Tower Rental Industry Revenue billion Forecast, by End User 2020 & 2033
- Table 3: Global Cooling Tower Rental Industry Revenue billion Forecast, by Region 2020 & 2033
- Table 4: Global Cooling Tower Rental Industry Revenue billion Forecast, by Type 2020 & 2033
- Table 5: Global Cooling Tower Rental Industry Revenue billion Forecast, by End User 2020 & 2033
- Table 6: Global Cooling Tower Rental Industry Revenue billion Forecast, by Country 2020 & 2033
- Table 7: Global Cooling Tower Rental Industry Revenue billion Forecast, by Type 2020 & 2033
- Table 8: Global Cooling Tower Rental Industry Revenue billion Forecast, by End User 2020 & 2033
- Table 9: Global Cooling Tower Rental Industry Revenue billion Forecast, by Country 2020 & 2033
- Table 10: Global Cooling Tower Rental Industry Revenue billion Forecast, by Type 2020 & 2033
- Table 11: Global Cooling Tower Rental Industry Revenue billion Forecast, by End User 2020 & 2033
- Table 12: Global Cooling Tower Rental Industry Revenue billion Forecast, by Country 2020 & 2033
- Table 13: Global Cooling Tower Rental Industry Revenue billion Forecast, by Type 2020 & 2033
- Table 14: Global Cooling Tower Rental Industry Revenue billion Forecast, by End User 2020 & 2033
- Table 15: Global Cooling Tower Rental Industry Revenue billion Forecast, by Country 2020 & 2033
- Table 16: Global Cooling Tower Rental Industry Revenue billion Forecast, by Type 2020 & 2033
- Table 17: Global Cooling Tower Rental Industry Revenue billion Forecast, by End User 2020 & 2033
- Table 18: Global Cooling Tower Rental Industry Revenue billion Forecast, by Country 2020 & 2033
Frequently Asked Questions
1. What is the projected Compound Annual Growth Rate (CAGR) of the Cooling Tower Rental Industry?
The projected CAGR is approximately 6.2%.
2. Which companies are prominent players in the Cooling Tower Rental Industry?
Key companies in the market include SPX Cooling Technologies Inc, Johnson Controls International PLC, KTK KUHLTURM KARLSRUHE GMBH*List Not Exhaustive, Midwest Cooling Tower Services LLC, Cooling Tower Depot Inc, Caterpillar Inc, Aggreko PLC, Baltimore Aircoil Co, Carrier Rental Systems Inc, United Rentals Inc.
3. What are the main segments of the Cooling Tower Rental Industry?
The market segments include Type, End User.
4. Can you provide details about the market size?
The market size is estimated to be USD 1.39 billion as of 2022.
5. What are some drivers contributing to market growth?
4.; Favorable Government Policies.
6. What are the notable trends driving market growth?
Industrial Segment to Dominate the Market.
7. Are there any restraints impacting market growth?
4.; Rising Emphasis on Other Alternative Clean Energy Sources.
8. Can you provide examples of recent developments in the market?
Restrictions and impacts related to COVID-19 significantly reduced activities like air travel and commuting. This reduced the demand for fuels for transportation, and the shutdown restrictions on refineries affected the downstream sector in 2020. Since cooling towers play a major role in refinery operations, the shutdowns and reduced production rates affected the market for cooling tower rental.
9. What pricing options are available for accessing the report?
Pricing options include single-user, multi-user, and enterprise licenses priced at USD 4750, USD 5250, and USD 8750 respectively.
10. Is the market size provided in terms of value or volume?
The market size is provided in terms of value, measured in billion.
11. Are there any specific market keywords associated with the report?
Yes, the market keyword associated with the report is "Cooling Tower Rental Industry," which aids in identifying and referencing the specific market segment covered.
12. How do I determine which pricing option suits my needs best?
The pricing options vary based on user requirements and access needs. Individual users may opt for single-user licenses, while businesses requiring broader access may choose multi-user or enterprise licenses for cost-effective access to the report.
13. Are there any additional resources or data provided in the Cooling Tower Rental Industry report?
While the report offers comprehensive insights, it's advisable to review the specific contents or supplementary materials provided to ascertain if additional resources or data are available.
14. How can I stay updated on further developments or reports in the Cooling Tower Rental Industry?
To stay informed about further developments, trends, and reports in the Cooling Tower Rental Industry, consider subscribing to industry newsletters, following relevant companies and organizations, or regularly checking reputable industry news sources and publications.
Methodology
Step 1 - Identification of Relevant Samples Size from Population Database


Step 2 - Approaches for Defining Global Market Size (Value, Volume* & Price*)

Note*: In applicable scenarios
Step 3 - Data Sources
Primary Research
- Web Analytics
- Survey Reports
- Research Institute
- Latest Research Reports
- Opinion Leaders
Secondary Research
- Annual Reports
- White Paper
- Latest Press Release
- Industry Association
- Paid Database
- Investor Presentations

Step 4 - Data Triangulation
Involves using different sources of information in order to increase the validity of a study
These sources are likely to be stakeholders in a program - participants, other researchers, program staff, other community members, and so on.
Then we put all data in single framework & apply various statistical tools to find out the dynamic on the market.
During the analysis stage, feedback from the stakeholder groups would be compared to determine areas of agreement as well as areas of divergence