

Key Insights
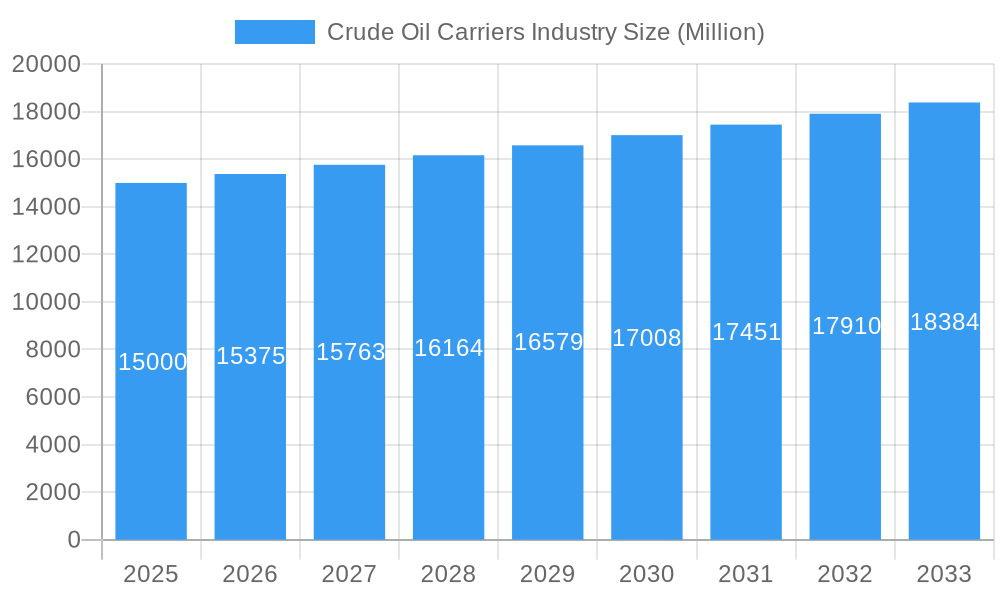
The global crude oil carrier market is poised for substantial growth, projected to reach $225142.8 million by 2025, with a Compound Annual Growth Rate (CAGR) of approximately 4.6% from 2025 to 2033. This expansion is primarily fueled by escalating worldwide crude oil demand, particularly from emerging economies in Asia-Pacific and the Middle East. While the global shift towards cleaner energy presents some challenges, the enduring necessity of crude oil as a feedstock for petrochemicals will sustain demand.
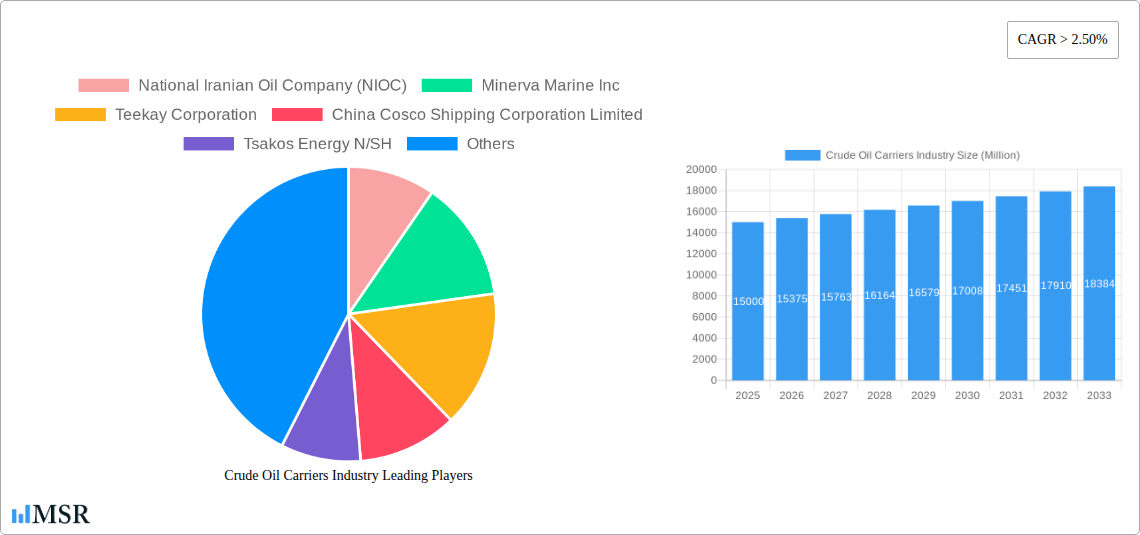
Crude Oil Carriers Industry Market Size (In Billion)
Key market drivers include increasing energy consumption, amplified global trade volumes, and the expansion of oil refining infrastructure in critical regions. The industry is witnessing a trend towards larger vessels, such as Very Large Crude Carriers (VLCCs) and Ultra Large Crude Carriers (ULCCs), to capitalize on economies of scale. Innovations in vessel design and operational efficiency are also enhancing profitability. However, market growth faces headwinds from volatile oil prices, geopolitical risks affecting trade routes, and stringent environmental regulations.
Crude Oil Carriers Industry Company Market Share
The market is segmented by vessel size, including Medium Range (MR), Panamax, Aframax, Suezmax, VLCC, and ULCC, each with unique dynamics influenced by cargo capacity and efficiency. Prominent industry players, including National Iranian Oil Company (NIOC), Minerva Marine Inc., Teekay Corporation, and China Cosco Shipping Corporation Limited, are actively competing through fleet modernization and strategic partnerships.
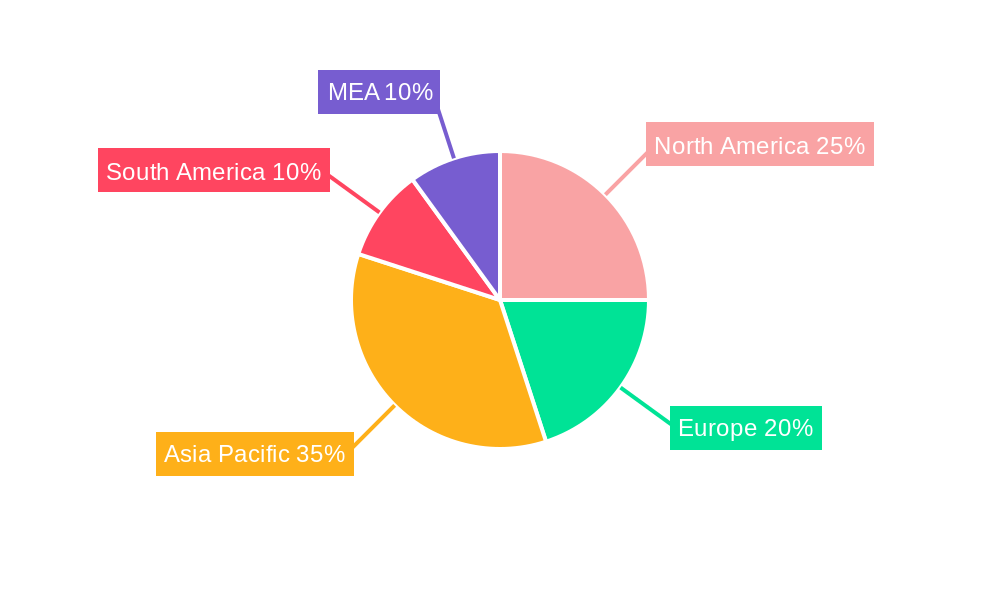
Geographically, significant market activity is concentrated in major oil-producing and consuming regions: North America, Europe, Asia-Pacific, and the Middle East & Africa. Continued market expansion is anticipated, driven by the ongoing need for secure and efficient crude oil transportation solutions.
The competitive arena features both established leaders and new entrants. Strategies such as fleet expansion, mergers and acquisitions, and technological investment are crucial for maintaining competitive advantage. Regional growth trajectories will vary, influenced by local oil production, consumption patterns, and economic development. North America is expected to maintain a strong market position due to its robust domestic oil production and refining capabilities. Asia-Pacific is projected to be the fastest-growing region, propelled by industrialization and rising energy demand, followed by the Middle East and Africa.
Europe and South America will also contribute to market growth, albeit at a potentially slower pace, reflecting varying reliance on imported crude oil and evolving energy landscapes. Continuous analysis of global economic conditions, oil price volatility, and regulatory shifts is essential for informed market performance assessment and investment strategies.
Crude Oil Carriers Industry: Market Analysis & Forecast 2019-2033
This comprehensive report provides a detailed analysis of the Crude Oil Carriers industry, covering market dynamics, key segments, leading players, and future growth prospects from 2019 to 2033. The study period spans 2019-2024 (Historical Period), with 2025 serving as the base and estimated year. The forecast period extends from 2025 to 2033. This in-depth analysis is crucial for stakeholders seeking actionable insights into this dynamic sector.
Crude Oil Carriers Industry Market Concentration & Dynamics
This section assesses the competitive landscape of the crude oil carriers market, examining market concentration, innovation, regulatory frameworks, substitutes, end-user trends, and mergers & acquisitions (M&A) activities. The global crude oil carrier market exhibits moderate concentration, with several major players holding significant market share. For instance, Teekay Corporation, China Cosco Shipping Corporation Limited, and Euronav NV collectively account for approximately XX% of the market share (2024 data).
The industry’s innovation ecosystem is focused on enhancing efficiency and environmental sustainability, with a surge in investment in technologies such as LNG-fueled vessels and digitalization for fleet management. Regulatory frameworks, particularly concerning emissions standards (IMO 2020 and beyond), heavily influence market dynamics. Substitute products, such as pipelines, are a competitive factor, particularly for shorter distances. End-user trends, mainly driven by global oil demand and geopolitical factors, significantly impact the market. M&A activity has been relatively consistent over the past few years, with approximately XX deals recorded between 2019 and 2024, indicating consolidation within the sector.
- Market Share: Teekay Corporation (XX%), China Cosco Shipping Corporation Limited (XX%), Euronav NV (XX%), Others (XX%)
- M&A Deal Count (2019-2024): XX
- Key Regulatory Factors: IMO 2020, other upcoming environmental regulations.
Crude Oil Carriers Industry Insights & Trends
The global crude oil carrier market is experiencing significant growth, driven primarily by increasing global oil demand, particularly from developing economies. The market size in 2025 is estimated at $XX Million, with a Compound Annual Growth Rate (CAGR) of XX% projected from 2025 to 2033. Technological advancements, such as the adoption of LNG-powered vessels to reduce emissions, are reshaping the industry. Changing consumer behaviors, reflected in increasing environmental consciousness and pressure for cleaner shipping practices, are also influencing market trends. Furthermore, fluctuations in crude oil prices and geopolitical events are significant factors affecting market growth and investment decisions. Geopolitical instability in key oil-producing regions often disrupts supply chains and creates uncertainty, which impacts shipping demand. Technological disruption from automation and digitalization continues to shape the competitive landscape, demanding increased investment in modern fleet management systems and skilled personnel.
Key Markets & Segments Leading Crude Oil Carriers Industry
The Very Large Crude Carriers (VLCC) segment currently dominates the crude oil carrier market, accounting for approximately XX% of the total fleet capacity. This dominance is primarily driven by the efficient transportation of large volumes of crude oil across long distances. Suezmax vessels hold a substantial share as well, representing a critical segment for medium-haul transportation. The growth of the VLCC segment is fueled by increasing global oil trade volumes and the expanding size of refineries.
Key Drivers for VLCC Dominance:
- Economies of Scale: Lower transportation costs per barrel compared to smaller vessels.
- Infrastructure: Availability of ports and terminals capable of handling VLCCs.
- Global Oil Trade: Increased demand for long-haul crude oil transportation.
Other segments, including Aframax, Panamax, and Medium Range vessels, cater to specific regional and logistical needs, presenting substantial market segments in themselves.
Regional Dominance: The Asia-Pacific region demonstrates a leading position in the crude oil carrier market. The region's burgeoning energy consumption and significant oil imports drive the demand for efficient crude oil transportation services.
Crude Oil Carriers Industry Product Developments
Recent advancements in crude oil carrier design focus on improving fuel efficiency, reducing emissions, and enhancing safety features. This includes the increased use of LNG as fuel and the adoption of advanced technologies such as ballast water management systems and hull designs that improve fuel efficiency. These innovations enhance a vessel's competitiveness and market appeal by reducing operational costs and environmental impact.
Challenges in the Crude Oil Carriers Industry Market
The crude oil carrier industry faces several challenges, including volatile oil prices, stringent environmental regulations (resulting in xx Million in additional compliance costs annually, estimated), geopolitical instability disrupting trade routes, and intense competition amongst carriers. These factors influence profitability and investment decisions within the sector. Supply chain disruptions due to port congestion and crew shortages also pose significant operational challenges, impacting the delivery timelines and overall market efficiency.
Forces Driving Crude Oil Carriers Industry Growth
Key growth drivers include the steadily increasing global demand for oil, particularly from developing nations, ongoing investments in refinery expansion, and the continuous evolution of shipping technologies towards greater efficiency and environmental sustainability. Government incentives for cleaner shipping also support industry growth.
Long-Term Growth Catalysts in the Crude Oil Carriers Industry
Long-term growth will be driven by continued expansion of the global oil market, technological advancements in vessel design and operational efficiency, and strategic partnerships aimed at optimizing logistics and reducing environmental impact. Exploration and development of new oil reserves also present opportunities for long-haul crude oil transport.
Emerging Opportunities in Crude Oil Carriers Industry
Emerging opportunities lie in the development and adoption of innovative technologies such as AI-powered vessel management systems, the expansion of LNG-fueled fleets to comply with stricter environmental rules, and the exploration of new trading routes to optimize transport efficiency. Further growth is possible through strategic collaborations that foster sustainability and efficiency within the industry.
Leading Players in the Crude Oil Carriers Industry Sector
- National Iranian Oil Company (NIOC)
- Minerva Marine Inc
- Teekay Corporation
- China Cosco Shipping Corporation Limited
- Tsakos Energy N/SH
- China Merchants Group Ltd
- Euronav NV
- Petroliam Nasional Berhad (PETRONAS)
- The National Shipping Co Saudi Arabia
- Angelicoussis Shipping Group Ltd
Key Milestones in Crude Oil Carriers Industry Industry
- 2020: Implementation of IMO 2020 sulfur cap significantly impacted fuel costs and vessel operations.
- 2022: Several major players announced investments in LNG-powered vessels.
- 2023: Increased focus on digitalization and AI adoption in fleet management.
- 2024: XX - Significant M&A activity amongst major players.
Strategic Outlook for Crude Oil Carriers Industry Market
The future of the crude oil carrier market is promising, driven by long-term growth in global oil demand and continuous technological advancements that improve efficiency and reduce environmental impact. Strategic opportunities for growth include investing in new technologies, focusing on operational efficiency, and expanding into emerging markets. Companies that effectively adapt to evolving regulations and changing consumer preferences are poised for success in this dynamic sector.
Crude Oil Carriers Industry Segmentation
-
1. Size
- 1.1. Medium Range
- 1.2. Panaxax
- 1.3. Aframax
- 1.4. Suezmax
- 1.5. Very Lar
Crude Oil Carriers Industry Segmentation By Geography
- 1. North America
- 2. Europe
- 3. Asia Pacific
- 4. South America
- 5. Middle East
Crude Oil Carriers Industry Regional Market Share
Geographic Coverage of Crude Oil Carriers Industry
Crude Oil Carriers Industry REPORT HIGHLIGHTS
| Aspects | Details |
|---|---|
| Study Period | 2020-2034 |
| Base Year | 2025 |
| Estimated Year | 2026 |
| Forecast Period | 2026-2034 |
| Historical Period | 2020-2025 |
| Growth Rate | CAGR of 4.6% from 2020-2034 |
| Segmentation |
|
Table of Contents
- 1. Introduction
- 1.1. Research Scope
- 1.2. Market Segmentation
- 1.3. Research Objective
- 1.4. Definitions and Assumptions
- 2. Executive Summary
- 2.1. Market Snapshot
- 3. Market Dynamics
- 3.1. Market Drivers
- 3.2. Market Restrains
- 3.3. Market Trends
- 3.4. Market Opportunities
- 4. Market Factor Analysis
- 4.1. Porters Five Forces
- 4.1.1. Bargaining Power of Suppliers
- 4.1.2. Bargaining Power of Buyers
- 4.1.3. Threat of New Entrants
- 4.1.4. Threat of Substitutes
- 4.1.5. Competitive Rivalry
- 4.2. PESTEL analysis
- 4.3. BCG Analysis
- 4.3.1. Stars (High Growth, High Market Share)
- 4.3.2. Cash Cows (Low Growth, High Market Share)
- 4.3.3. Question Mark (High Growth, Low Market Share)
- 4.3.4. Dogs (Low Growth, Low Market Share)
- 4.4. Ansoff Matrix Analysis
- 4.5. Supply Chain Analysis
- 4.6. Regulatory Landscape
- 4.7. Current Market Potential and Opportunity Assessment (TAM–SAM–SOM Framework)
- 4.8. MSR Analyst Note
- 4.1. Porters Five Forces
- 5. Market Analysis, Insights and Forecast 2021-2033
- 5.1. Market Analysis, Insights and Forecast - by Size
- 5.1.1. Medium Range
- 5.1.2. Panaxax
- 5.1.3. Aframax
- 5.1.4. Suezmax
- 5.1.5. Very Lar
- 5.2. Market Analysis, Insights and Forecast - by Region
- 5.2.1. North America
- 5.2.2. Europe
- 5.2.3. Asia Pacific
- 5.2.4. South America
- 5.2.5. Middle East
- 5.1. Market Analysis, Insights and Forecast - by Size
- 6. Global Crude Oil Carriers Industry Analysis, Insights and Forecast, 2021-2033
- 6.1. Market Analysis, Insights and Forecast - by Size
- 6.1.1. Medium Range
- 6.1.2. Panaxax
- 6.1.3. Aframax
- 6.1.4. Suezmax
- 6.1.5. Very Lar
- 6.1. Market Analysis, Insights and Forecast - by Size
- 7. North America Crude Oil Carriers Industry Analysis, Insights and Forecast, 2020-2032
- 7.1. Market Analysis, Insights and Forecast - by Size
- 7.1.1. Medium Range
- 7.1.2. Panaxax
- 7.1.3. Aframax
- 7.1.4. Suezmax
- 7.1.5. Very Lar
- 7.1. Market Analysis, Insights and Forecast - by Size
- 8. Europe Crude Oil Carriers Industry Analysis, Insights and Forecast, 2020-2032
- 8.1. Market Analysis, Insights and Forecast - by Size
- 8.1.1. Medium Range
- 8.1.2. Panaxax
- 8.1.3. Aframax
- 8.1.4. Suezmax
- 8.1.5. Very Lar
- 8.1. Market Analysis, Insights and Forecast - by Size
- 9. Asia Pacific Crude Oil Carriers Industry Analysis, Insights and Forecast, 2020-2032
- 9.1. Market Analysis, Insights and Forecast - by Size
- 9.1.1. Medium Range
- 9.1.2. Panaxax
- 9.1.3. Aframax
- 9.1.4. Suezmax
- 9.1.5. Very Lar
- 9.1. Market Analysis, Insights and Forecast - by Size
- 10. South America Crude Oil Carriers Industry Analysis, Insights and Forecast, 2020-2032
- 10.1. Market Analysis, Insights and Forecast - by Size
- 10.1.1. Medium Range
- 10.1.2. Panaxax
- 10.1.3. Aframax
- 10.1.4. Suezmax
- 10.1.5. Very Lar
- 10.1. Market Analysis, Insights and Forecast - by Size
- 11. Middle East Crude Oil Carriers Industry Analysis, Insights and Forecast, 2020-2032
- 11.1. Market Analysis, Insights and Forecast - by Size
- 11.1.1. Medium Range
- 11.1.2. Panaxax
- 11.1.3. Aframax
- 11.1.4. Suezmax
- 11.1.5. Very Lar
- 11.1. Market Analysis, Insights and Forecast - by Size
- 12. Competitive Analysis
- 12.1. Company Profiles
- 12.1.1 National Iranian Oil Company (NIOC)
- 12.1.1.1. Company Overview
- 12.1.1.2. Products
- 12.1.1.3. Company Financials
- 12.1.1.4. SWOT Analysis
- 12.1.2 Minerva Marine Inc
- 12.1.2.1. Company Overview
- 12.1.2.2. Products
- 12.1.2.3. Company Financials
- 12.1.2.4. SWOT Analysis
- 12.1.3 Teekay Corporation
- 12.1.3.1. Company Overview
- 12.1.3.2. Products
- 12.1.3.3. Company Financials
- 12.1.3.4. SWOT Analysis
- 12.1.4 China Cosco Shipping Corporation Limited
- 12.1.4.1. Company Overview
- 12.1.4.2. Products
- 12.1.4.3. Company Financials
- 12.1.4.4. SWOT Analysis
- 12.1.5 Tsakos Energy N/SH
- 12.1.5.1. Company Overview
- 12.1.5.2. Products
- 12.1.5.3. Company Financials
- 12.1.5.4. SWOT Analysis
- 12.1.6 China Merchants Group Ltd
- 12.1.6.1. Company Overview
- 12.1.6.2. Products
- 12.1.6.3. Company Financials
- 12.1.6.4. SWOT Analysis
- 12.1.7 Euronav NV
- 12.1.7.1. Company Overview
- 12.1.7.2. Products
- 12.1.7.3. Company Financials
- 12.1.7.4. SWOT Analysis
- 12.1.8 Petroliam Nasional Berhad (PETRONAS)*List Not Exhaustive
- 12.1.8.1. Company Overview
- 12.1.8.2. Products
- 12.1.8.3. Company Financials
- 12.1.8.4. SWOT Analysis
- 12.1.9 The National Shipping Co Saudi Arabia
- 12.1.9.1. Company Overview
- 12.1.9.2. Products
- 12.1.9.3. Company Financials
- 12.1.9.4. SWOT Analysis
- 12.1.10 Angelicoussis Shipping Group Ltd
- 12.1.10.1. Company Overview
- 12.1.10.2. Products
- 12.1.10.3. Company Financials
- 12.1.10.4. SWOT Analysis
- 12.1.1 National Iranian Oil Company (NIOC)
- 12.2. Market Entropy
- 12.2.1 Company's Key Areas Served
- 12.2.2 Recent Developments
- 12.3. Company Market Share Analysis 2025
- 12.3.1 Top 5 Companies Market Share Analysis
- 12.3.2 Top 3 Companies Market Share Analysis
- 12.4. List of Potential Customers
- 13. Research Methodology
List of Figures
- Figure 1: Global Crude Oil Carriers Industry Revenue Breakdown (million, %) by Region 2025 & 2033
- Figure 2: Global Crude Oil Carriers Industry Volume Breakdown (metric tonnes, %) by Region 2025 & 2033
- Figure 3: North America Crude Oil Carriers Industry Revenue (million), by Size 2025 & 2033
- Figure 4: North America Crude Oil Carriers Industry Volume (metric tonnes), by Size 2025 & 2033
- Figure 5: North America Crude Oil Carriers Industry Revenue Share (%), by Size 2025 & 2033
- Figure 6: North America Crude Oil Carriers Industry Volume Share (%), by Size 2025 & 2033
- Figure 7: North America Crude Oil Carriers Industry Revenue (million), by Country 2025 & 2033
- Figure 8: North America Crude Oil Carriers Industry Volume (metric tonnes), by Country 2025 & 2033
- Figure 9: North America Crude Oil Carriers Industry Revenue Share (%), by Country 2025 & 2033
- Figure 10: North America Crude Oil Carriers Industry Volume Share (%), by Country 2025 & 2033
- Figure 11: Europe Crude Oil Carriers Industry Revenue (million), by Size 2025 & 2033
- Figure 12: Europe Crude Oil Carriers Industry Volume (metric tonnes), by Size 2025 & 2033
- Figure 13: Europe Crude Oil Carriers Industry Revenue Share (%), by Size 2025 & 2033
- Figure 14: Europe Crude Oil Carriers Industry Volume Share (%), by Size 2025 & 2033
- Figure 15: Europe Crude Oil Carriers Industry Revenue (million), by Country 2025 & 2033
- Figure 16: Europe Crude Oil Carriers Industry Volume (metric tonnes), by Country 2025 & 2033
- Figure 17: Europe Crude Oil Carriers Industry Revenue Share (%), by Country 2025 & 2033
- Figure 18: Europe Crude Oil Carriers Industry Volume Share (%), by Country 2025 & 2033
- Figure 19: Asia Pacific Crude Oil Carriers Industry Revenue (million), by Size 2025 & 2033
- Figure 20: Asia Pacific Crude Oil Carriers Industry Volume (metric tonnes), by Size 2025 & 2033
- Figure 21: Asia Pacific Crude Oil Carriers Industry Revenue Share (%), by Size 2025 & 2033
- Figure 22: Asia Pacific Crude Oil Carriers Industry Volume Share (%), by Size 2025 & 2033
- Figure 23: Asia Pacific Crude Oil Carriers Industry Revenue (million), by Country 2025 & 2033
- Figure 24: Asia Pacific Crude Oil Carriers Industry Volume (metric tonnes), by Country 2025 & 2033
- Figure 25: Asia Pacific Crude Oil Carriers Industry Revenue Share (%), by Country 2025 & 2033
- Figure 26: Asia Pacific Crude Oil Carriers Industry Volume Share (%), by Country 2025 & 2033
- Figure 27: South America Crude Oil Carriers Industry Revenue (million), by Size 2025 & 2033
- Figure 28: South America Crude Oil Carriers Industry Volume (metric tonnes), by Size 2025 & 2033
- Figure 29: South America Crude Oil Carriers Industry Revenue Share (%), by Size 2025 & 2033
- Figure 30: South America Crude Oil Carriers Industry Volume Share (%), by Size 2025 & 2033
- Figure 31: South America Crude Oil Carriers Industry Revenue (million), by Country 2025 & 2033
- Figure 32: South America Crude Oil Carriers Industry Volume (metric tonnes), by Country 2025 & 2033
- Figure 33: South America Crude Oil Carriers Industry Revenue Share (%), by Country 2025 & 2033
- Figure 34: South America Crude Oil Carriers Industry Volume Share (%), by Country 2025 & 2033
- Figure 35: Middle East Crude Oil Carriers Industry Revenue (million), by Size 2025 & 2033
- Figure 36: Middle East Crude Oil Carriers Industry Volume (metric tonnes), by Size 2025 & 2033
- Figure 37: Middle East Crude Oil Carriers Industry Revenue Share (%), by Size 2025 & 2033
- Figure 38: Middle East Crude Oil Carriers Industry Volume Share (%), by Size 2025 & 2033
- Figure 39: Middle East Crude Oil Carriers Industry Revenue (million), by Country 2025 & 2033
- Figure 40: Middle East Crude Oil Carriers Industry Volume (metric tonnes), by Country 2025 & 2033
- Figure 41: Middle East Crude Oil Carriers Industry Revenue Share (%), by Country 2025 & 2033
- Figure 42: Middle East Crude Oil Carriers Industry Volume Share (%), by Country 2025 & 2033
List of Tables
- Table 1: Global Crude Oil Carriers Industry Revenue million Forecast, by Size 2020 & 2033
- Table 2: Global Crude Oil Carriers Industry Volume metric tonnes Forecast, by Size 2020 & 2033
- Table 3: Global Crude Oil Carriers Industry Revenue million Forecast, by Region 2020 & 2033
- Table 4: Global Crude Oil Carriers Industry Volume metric tonnes Forecast, by Region 2020 & 2033
- Table 5: Global Crude Oil Carriers Industry Revenue million Forecast, by Size 2020 & 2033
- Table 6: Global Crude Oil Carriers Industry Volume metric tonnes Forecast, by Size 2020 & 2033
- Table 7: Global Crude Oil Carriers Industry Revenue million Forecast, by Country 2020 & 2033
- Table 8: Global Crude Oil Carriers Industry Volume metric tonnes Forecast, by Country 2020 & 2033
- Table 9: Global Crude Oil Carriers Industry Revenue million Forecast, by Size 2020 & 2033
- Table 10: Global Crude Oil Carriers Industry Volume metric tonnes Forecast, by Size 2020 & 2033
- Table 11: Global Crude Oil Carriers Industry Revenue million Forecast, by Country 2020 & 2033
- Table 12: Global Crude Oil Carriers Industry Volume metric tonnes Forecast, by Country 2020 & 2033
- Table 13: Global Crude Oil Carriers Industry Revenue million Forecast, by Size 2020 & 2033
- Table 14: Global Crude Oil Carriers Industry Volume metric tonnes Forecast, by Size 2020 & 2033
- Table 15: Global Crude Oil Carriers Industry Revenue million Forecast, by Country 2020 & 2033
- Table 16: Global Crude Oil Carriers Industry Volume metric tonnes Forecast, by Country 2020 & 2033
- Table 17: Global Crude Oil Carriers Industry Revenue million Forecast, by Size 2020 & 2033
- Table 18: Global Crude Oil Carriers Industry Volume metric tonnes Forecast, by Size 2020 & 2033
- Table 19: Global Crude Oil Carriers Industry Revenue million Forecast, by Country 2020 & 2033
- Table 20: Global Crude Oil Carriers Industry Volume metric tonnes Forecast, by Country 2020 & 2033
- Table 21: Global Crude Oil Carriers Industry Revenue million Forecast, by Size 2020 & 2033
- Table 22: Global Crude Oil Carriers Industry Volume metric tonnes Forecast, by Size 2020 & 2033
- Table 23: Global Crude Oil Carriers Industry Revenue million Forecast, by Country 2020 & 2033
- Table 24: Global Crude Oil Carriers Industry Volume metric tonnes Forecast, by Country 2020 & 2033
Frequently Asked Questions
1. What is the projected Compound Annual Growth Rate (CAGR) of the Crude Oil Carriers Industry?
The projected CAGR is approximately 4.6%.
2. Which companies are prominent players in the Crude Oil Carriers Industry?
Key companies in the market include National Iranian Oil Company (NIOC), Minerva Marine Inc, Teekay Corporation, China Cosco Shipping Corporation Limited, Tsakos Energy N/SH, China Merchants Group Ltd, Euronav NV, Petroliam Nasional Berhad (PETRONAS)*List Not Exhaustive, The National Shipping Co Saudi Arabia, Angelicoussis Shipping Group Ltd.
3. What are the main segments of the Crude Oil Carriers Industry?
The market segments include Size.
4. Can you provide details about the market size?
The market size is estimated to be USD 225142.8 million as of 2022.
5. What are some drivers contributing to market growth?
Increasing Electricity Demand; Rising Investments in the Coal Industry.
6. What are the notable trends driving market growth?
Very Large Crude Carrier to Dominate the Market.
7. Are there any restraints impacting market growth?
Increasing Installation of Renewable Energy Sources.
8. Can you provide examples of recent developments in the market?
N/A
9. What pricing options are available for accessing the report?
Pricing options include single-user, multi-user, and enterprise licenses priced at USD 4750, USD 5250, and USD 8750 respectively.
10. Is the market size provided in terms of value or volume?
The market size is provided in terms of value, measured in million and volume, measured in metric tonnes.
11. Are there any specific market keywords associated with the report?
Yes, the market keyword associated with the report is "Crude Oil Carriers Industry," which aids in identifying and referencing the specific market segment covered.
12. How do I determine which pricing option suits my needs best?
The pricing options vary based on user requirements and access needs. Individual users may opt for single-user licenses, while businesses requiring broader access may choose multi-user or enterprise licenses for cost-effective access to the report.
13. Are there any additional resources or data provided in the Crude Oil Carriers Industry report?
While the report offers comprehensive insights, it's advisable to review the specific contents or supplementary materials provided to ascertain if additional resources or data are available.
14. How can I stay updated on further developments or reports in the Crude Oil Carriers Industry?
To stay informed about further developments, trends, and reports in the Crude Oil Carriers Industry, consider subscribing to industry newsletters, following relevant companies and organizations, or regularly checking reputable industry news sources and publications.
Methodology
Step 1 - Identification of Relevant Samples Size from Population Database


Step 2 - Approaches for Defining Global Market Size (Value, Volume* & Price*)

Note*: In applicable scenarios
Step 3 - Data Sources
Primary Research
- Web Analytics
- Survey Reports
- Research Institute
- Latest Research Reports
- Opinion Leaders
Secondary Research
- Annual Reports
- White Paper
- Latest Press Release
- Industry Association
- Paid Database
- Investor Presentations

Step 4 - Data Triangulation
Involves using different sources of information in order to increase the validity of a study
These sources are likely to be stakeholders in a program - participants, other researchers, program staff, other community members, and so on.
Then we put all data in single framework & apply various statistical tools to find out the dynamic on the market.
During the analysis stage, feedback from the stakeholder groups would be compared to determine areas of agreement as well as areas of divergence