

Key Insights
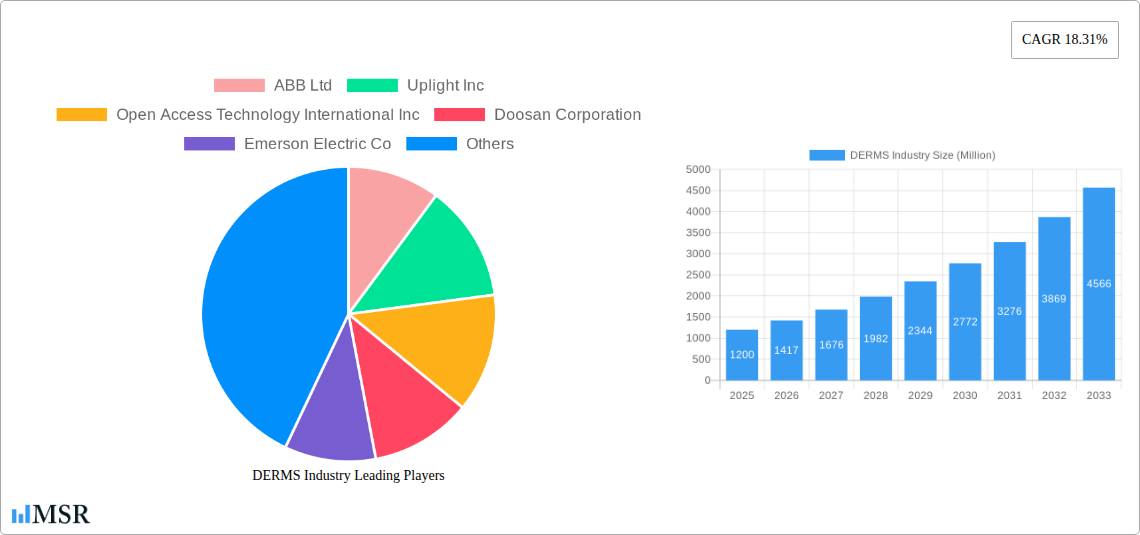
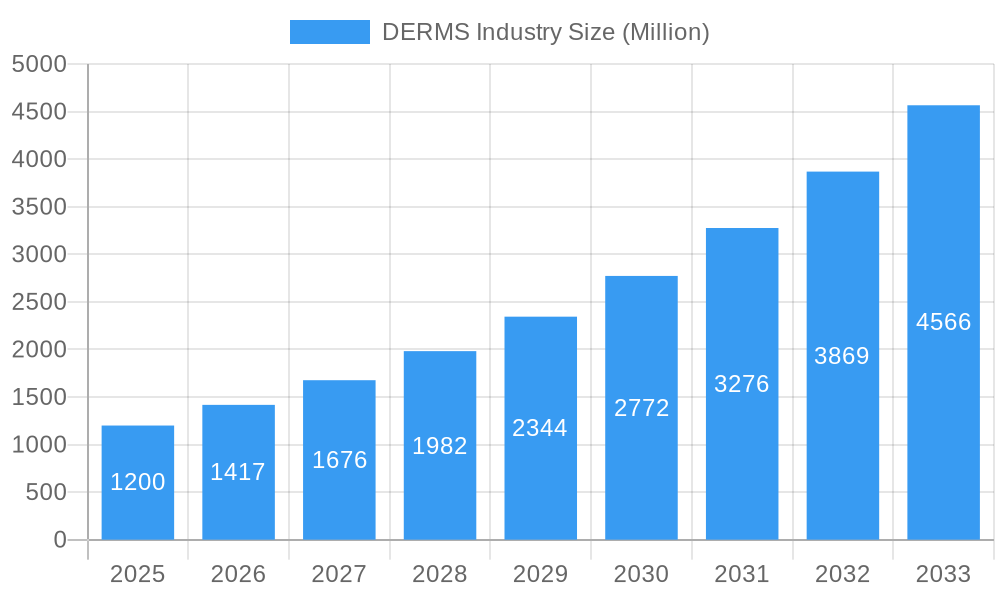
The Distributed Energy Resource Management System (DERMS) market is experiencing robust growth, projected to reach $1.20 billion in 2025 and maintain a Compound Annual Growth Rate (CAGR) of 18.31% from 2025 to 2033. This expansion is driven primarily by the increasing adoption of renewable energy sources like solar photovoltaic (PV) and the widespread integration of electric vehicles (EVs) into the energy grid. Furthermore, the growing need for efficient microgrid management and the escalating demand for advanced energy management solutions across industrial, residential, and commercial sectors are significantly contributing to market growth. Technological advancements, such as the development of sophisticated algorithms and artificial intelligence (AI)-powered analytics, are further enhancing the capabilities of DERMS, leading to improved grid stability, reduced operational costs, and increased energy efficiency. The expanding smart grid infrastructure globally also presents a significant opportunity for DERMS providers. However, challenges remain, including the high initial investment costs associated with implementing DERMS solutions and the complexity of integrating diverse energy resources. Nevertheless, the long-term benefits of improved grid management and enhanced renewable energy integration are expected to outweigh these challenges, fueling continued market expansion.
DERMS Industry Market Size (In Billion)
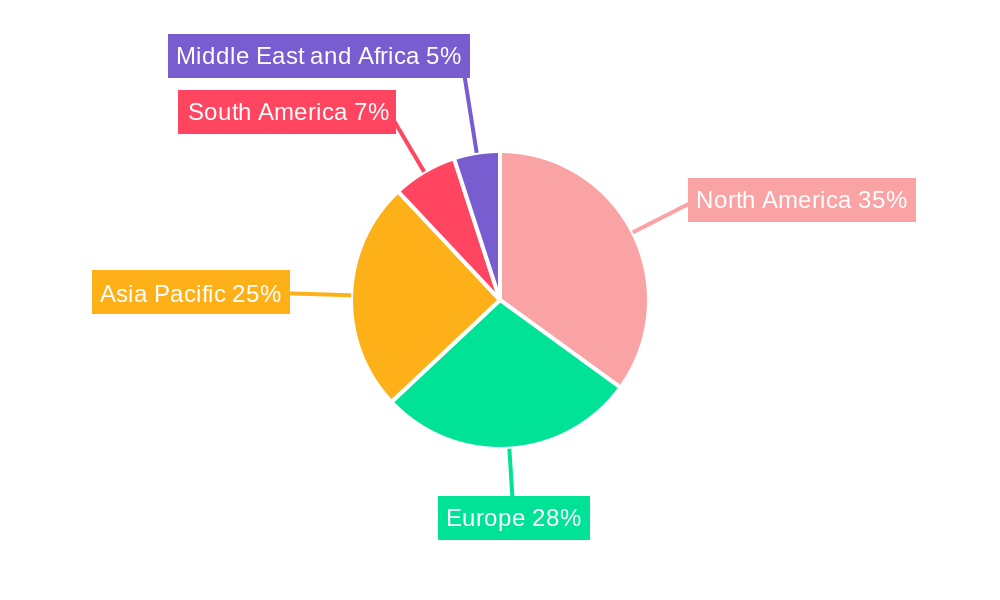
The geographical distribution of the DERMS market reflects the varying levels of renewable energy adoption and smart grid development across different regions. North America, particularly the United States, is expected to maintain a significant market share due to substantial investments in renewable energy infrastructure and the advanced stage of its smart grid deployment. Europe, driven by its strong focus on climate change mitigation and its commitment to renewable energy targets, is also poised for significant growth. The Asia-Pacific region, with its rapidly growing economies and increasing demand for electricity, presents a substantial potential for future market expansion. While South America and the Middle East and Africa may exhibit slower growth initially, their burgeoning renewable energy sectors and ongoing modernization of energy infrastructure will contribute to increasing demand for DERMS solutions in the coming years. Key players in the DERMS market, including ABB Ltd, Schneider Electric SE, and Siemens AG, are investing heavily in research and development to enhance their product offerings and expand their market reach, intensifying competition and driving innovation.
DERMS Industry Company Market Share
DERMS Industry Market Report: 2019-2033
This comprehensive report provides a detailed analysis of the Distributed Energy Resource Management System (DERMS) industry, offering actionable insights for stakeholders across the value chain. With a study period spanning 2019-2033, a base year of 2025, and a forecast period of 2025-2033, this report unveils the market's trajectory, key players, and emerging trends. The report projects a market size of xx Million by 2033, with a CAGR of xx%.
DERMS Industry Market Concentration & Dynamics
The DERMS market exhibits a moderately concentrated landscape, with a handful of major players—including ABB Ltd, ABB Ltd, Uplight Inc, Open Access Technology International Inc, Doosan Corporation, Emerson Electric Co, Emerson Electric Co, Mitsubishi Electric Corporation, Siemens AG, Schneider Electric SE, Oracle Corporation, Engie SA, and General Electric Company—holding significant market share. However, a vibrant ecosystem of smaller, specialized firms is driving innovation, particularly in niche technologies like microgrids and advanced analytics. The market share of the top 5 players is estimated at xx%, indicating room for both organic growth and further consolidation.
The regulatory environment is evolving rapidly, with increasing emphasis on grid modernization and integration of renewable energy sources. This is driving demand for advanced DERMS solutions capable of managing diverse energy resources and optimizing grid operations. Substitute products, such as legacy SCADA systems, are facing increasing pressure due to limitations in scalability and functionality. Furthermore, the increasing adoption of smart grids and the proliferation of distributed energy resources are creating significant opportunities for DERMS vendors.
M&A activity in the DERMS sector has been robust in recent years, with xx deals recorded between 2019 and 2024. This trend is expected to continue as larger players seek to expand their product portfolios and market reach through strategic acquisitions. End-user trends show a strong shift towards integrated DERMS solutions that offer greater visibility and control over distributed energy resources. This is particularly evident in the commercial and industrial segments, where energy efficiency and cost optimization are key drivers.
DERMS Industry Industry Insights & Trends
The DERMS market is experiencing significant growth driven by several key factors. The global push towards renewable energy sources, such as solar PV and wind, is creating a need for sophisticated grid management systems to handle intermittent power generation. The rise of electric vehicles (EVs) further exacerbates this need, adding substantial load variability to the grid. This is further compounded by the increasing adoption of microgrids, which require intelligent control systems to ensure reliable power supply. Technological advancements, including the development of advanced analytics and AI-powered optimization algorithms, are improving the efficiency and effectiveness of DERMS solutions. Furthermore, evolving consumer behaviors, with a greater emphasis on sustainability and energy efficiency, are driving demand for smarter energy management solutions.
The market experienced substantial growth in the historical period (2019-2024), reaching xx Million in 2024. This strong growth is projected to continue in the forecast period (2025-2033), with a projected market value of xx Million by 2033. The CAGR during this period is estimated to be xx%. This growth reflects the increasing adoption of DERMS across various sectors and geographies.
Key Markets & Segments Leading DERMS Industry
The North American market currently holds a dominant position in the DERMS industry, driven by strong government support for renewable energy and grid modernization initiatives. This is further complemented by significant investments in smart grid infrastructure and the presence of major DERMS vendors in the region. European markets are also experiencing significant growth, fueled by similar policy drivers and a growing focus on energy efficiency.
Dominant Technology Segments:
- Solar Photovoltaic (PV): The rapid growth of solar PV installations is the biggest driver for DERMS adoption.
- Electric Vehicles: The increasing penetration of EVs is creating new challenges and opportunities for grid management, driving demand for advanced DERMS solutions.
- Microgrids: The increasing popularity of microgrids is fueling demand for DERMS solutions capable of managing localized energy systems.
- Other Technologies: The integration of other distributed energy resources, such as energy storage and demand response programs, is also contributing to market growth.
Dominant End-User Segments:
- Commercial: Businesses are increasingly adopting DERMS to optimize energy consumption and reduce costs.
- Industrial: Industrial facilities are deploying DERMS to enhance operational efficiency and improve grid reliability.
- Residential: While still nascent, residential DERMS adoption is increasing with the rise of rooftop solar and home energy management systems.
Drivers for each segment include robust economic growth, supportive government policies, and the increasing availability of cost-effective renewable energy sources. The detailed dominance analysis indicates the strong correlation between government initiatives, technological advancement, and the adoption rate of DERMS across segments.
DERMS Industry Product Developments
Recent product innovations focus on enhanced data analytics, AI-powered optimization, and improved user interfaces. New applications are emerging in areas such as microgrid management, EV charging infrastructure optimization, and demand-side management. These advancements are providing DERMS vendors with a significant competitive edge by enabling them to offer more sophisticated and effective solutions.
Challenges in the DERMS Industry Market
The DERMS market faces challenges, including regulatory uncertainty in some regions, supply chain disruptions impacting component availability (impacting production by xx%), and intense competition among established and emerging vendors. These factors can lead to project delays and increased costs, hindering wider adoption.
Forces Driving DERMS Industry Growth
Key growth drivers include government mandates promoting renewable energy integration, increasing energy prices driving cost-optimization initiatives, and technological advancements enhancing DERMS capabilities. For example, the increased focus on grid resilience and the growing adoption of smart grid technologies are significantly boosting DERMS adoption.
Challenges in the DERMS Industry Market
Long-term growth catalysts include continued innovation in areas such as AI and machine learning, strategic partnerships between DERMS vendors and energy providers, and expansion into new geographic markets. These factors will unlock further market potential and fuel sustained growth.
Emerging Opportunities in DERMS Industry
Emerging opportunities exist in integrating DERMS with other smart grid technologies, expanding into new markets in developing economies, and addressing the growing need for cybersecurity solutions within DERMS platforms. The focus on improving grid reliability and efficiency will further drive the adoption of more advanced DERMS solutions.
Leading Players in the DERMS Industry Sector
- ABB Ltd
- Uplight Inc
- Open Access Technology International Inc
- Doosan Corporation
- Emerson Electric Co
- Mitsubishi Electric Corporation
- Siemens AG
- Schneider Electric SE
- Oracle Corporation
- Engie SA
- General Electric Company
Key Milestones in DERMS Industry Industry
- April 2023: Alloy.ai launches a demand and inventory control tower for consumer brands, highlighting the convergence of data analytics and energy management.
- January 2024: IEA reports a 50% increase in renewable energy capacity additions in 2023, reaching nearly 510 GW, predominantly solar PV, emphasizing the growing need for robust DERMS solutions.
- February 2024: NCCETC reports 774 grid modernization actions in 2023 across more than 50 US states, highlighting key trends such as virtual power plants and long-duration energy storage, underscoring the expanding role of DERMS.
Strategic Outlook for DERMS Industry Market
The DERMS market is poised for significant growth, driven by increasing demand for renewable energy integration, grid modernization initiatives, and technological advancements. Strategic opportunities exist for companies that can offer innovative solutions that address emerging challenges, such as grid resilience and cybersecurity. Partnerships and collaborations are key to unlocking the full potential of this growing market.
DERMS Industry Segmentation
-
1. Technology
- 1.1. Solar Photovoltaic (PV)
- 1.2. Electric Vehicles
- 1.3. Microgrids
- 1.4. Other Technologies
-
2. End User
- 2.1. Industrial
- 2.2. Residential
- 2.3. Commercial
DERMS Industry Segmentation By Geography
-
1. North America
- 1.1. United States
- 1.2. Canada
- 1.3. Rest of North America
-
2. Europe
- 2.1. Germany
- 2.2. Italy
- 2.3. France
- 2.4. United Kingdom
- 2.5. Rest of Europe
-
3. Asia Pacific
- 3.1. India
- 3.2. China
- 3.3. Japan
- 3.4. South Korea
- 3.5. Rest of Asia Pacific
-
4. South America
- 4.1. Brazil
- 4.2. Argentina
- 4.3. Rest of South America
-
5. Middle East and Africa
- 5.1. United Arab Emirates
- 5.2. Saudi Arabia
- 5.3. Saudi Arabia
- 5.4. Rest of Middle East and Africa
DERMS Industry Regional Market Share
Geographic Coverage of DERMS Industry
DERMS Industry REPORT HIGHLIGHTS
| Aspects | Details |
|---|---|
| Study Period | 2020-2034 |
| Base Year | 2025 |
| Estimated Year | 2026 |
| Forecast Period | 2026-2034 |
| Historical Period | 2020-2025 |
| Growth Rate | CAGR of 18.31% from 2020-2034 |
| Segmentation |
|
Table of Contents
- 1. Introduction
- 1.1. Research Scope
- 1.2. Market Segmentation
- 1.3. Research Objective
- 1.4. Definitions and Assumptions
- 2. Executive Summary
- 2.1. Market Snapshot
- 3. Market Dynamics
- 3.1. Market Drivers
- 3.2. Market Restrains
- 3.3. Market Trends
- 3.4. Market Opportunities
- 4. Market Factor Analysis
- 4.1. Porters Five Forces
- 4.1.1. Bargaining Power of Suppliers
- 4.1.2. Bargaining Power of Buyers
- 4.1.3. Threat of New Entrants
- 4.1.4. Threat of Substitutes
- 4.1.5. Competitive Rivalry
- 4.2. PESTEL analysis
- 4.3. BCG Analysis
- 4.3.1. Stars (High Growth, High Market Share)
- 4.3.2. Cash Cows (Low Growth, High Market Share)
- 4.3.3. Question Mark (High Growth, Low Market Share)
- 4.3.4. Dogs (Low Growth, Low Market Share)
- 4.4. Ansoff Matrix Analysis
- 4.5. Supply Chain Analysis
- 4.6. Regulatory Landscape
- 4.7. Current Market Potential and Opportunity Assessment (TAM–SAM–SOM Framework)
- 4.8. MSR Analyst Note
- 4.1. Porters Five Forces
- 5. Market Analysis, Insights and Forecast 2021-2033
- 5.1. Market Analysis, Insights and Forecast - by Technology
- 5.1.1. Solar Photovoltaic (PV)
- 5.1.2. Electric Vehicles
- 5.1.3. Microgrids
- 5.1.4. Other Technologies
- 5.2. Market Analysis, Insights and Forecast - by End User
- 5.2.1. Industrial
- 5.2.2. Residential
- 5.2.3. Commercial
- 5.3. Market Analysis, Insights and Forecast - by Region
- 5.3.1. North America
- 5.3.2. Europe
- 5.3.3. Asia Pacific
- 5.3.4. South America
- 5.3.5. Middle East and Africa
- 5.1. Market Analysis, Insights and Forecast - by Technology
- 6. Global DERMS Industry Analysis, Insights and Forecast, 2021-2033
- 6.1. Market Analysis, Insights and Forecast - by Technology
- 6.1.1. Solar Photovoltaic (PV)
- 6.1.2. Electric Vehicles
- 6.1.3. Microgrids
- 6.1.4. Other Technologies
- 6.2. Market Analysis, Insights and Forecast - by End User
- 6.2.1. Industrial
- 6.2.2. Residential
- 6.2.3. Commercial
- 6.1. Market Analysis, Insights and Forecast - by Technology
- 7. North America DERMS Industry Analysis, Insights and Forecast, 2020-2032
- 7.1. Market Analysis, Insights and Forecast - by Technology
- 7.1.1. Solar Photovoltaic (PV)
- 7.1.2. Electric Vehicles
- 7.1.3. Microgrids
- 7.1.4. Other Technologies
- 7.2. Market Analysis, Insights and Forecast - by End User
- 7.2.1. Industrial
- 7.2.2. Residential
- 7.2.3. Commercial
- 7.1. Market Analysis, Insights and Forecast - by Technology
- 8. Europe DERMS Industry Analysis, Insights and Forecast, 2020-2032
- 8.1. Market Analysis, Insights and Forecast - by Technology
- 8.1.1. Solar Photovoltaic (PV)
- 8.1.2. Electric Vehicles
- 8.1.3. Microgrids
- 8.1.4. Other Technologies
- 8.2. Market Analysis, Insights and Forecast - by End User
- 8.2.1. Industrial
- 8.2.2. Residential
- 8.2.3. Commercial
- 8.1. Market Analysis, Insights and Forecast - by Technology
- 9. Asia Pacific DERMS Industry Analysis, Insights and Forecast, 2020-2032
- 9.1. Market Analysis, Insights and Forecast - by Technology
- 9.1.1. Solar Photovoltaic (PV)
- 9.1.2. Electric Vehicles
- 9.1.3. Microgrids
- 9.1.4. Other Technologies
- 9.2. Market Analysis, Insights and Forecast - by End User
- 9.2.1. Industrial
- 9.2.2. Residential
- 9.2.3. Commercial
- 9.1. Market Analysis, Insights and Forecast - by Technology
- 10. South America DERMS Industry Analysis, Insights and Forecast, 2020-2032
- 10.1. Market Analysis, Insights and Forecast - by Technology
- 10.1.1. Solar Photovoltaic (PV)
- 10.1.2. Electric Vehicles
- 10.1.3. Microgrids
- 10.1.4. Other Technologies
- 10.2. Market Analysis, Insights and Forecast - by End User
- 10.2.1. Industrial
- 10.2.2. Residential
- 10.2.3. Commercial
- 10.1. Market Analysis, Insights and Forecast - by Technology
- 11. Middle East and Africa DERMS Industry Analysis, Insights and Forecast, 2020-2032
- 11.1. Market Analysis, Insights and Forecast - by Technology
- 11.1.1. Solar Photovoltaic (PV)
- 11.1.2. Electric Vehicles
- 11.1.3. Microgrids
- 11.1.4. Other Technologies
- 11.2. Market Analysis, Insights and Forecast - by End User
- 11.2.1. Industrial
- 11.2.2. Residential
- 11.2.3. Commercial
- 11.1. Market Analysis, Insights and Forecast - by Technology
- 12. Competitive Analysis
- 12.1. Company Profiles
- 12.1.1 ABB Ltd
- 12.1.1.1. Company Overview
- 12.1.1.2. Products
- 12.1.1.3. Company Financials
- 12.1.1.4. SWOT Analysis
- 12.1.2 Uplight Inc
- 12.1.2.1. Company Overview
- 12.1.2.2. Products
- 12.1.2.3. Company Financials
- 12.1.2.4. SWOT Analysis
- 12.1.3 Open Access Technology International Inc
- 12.1.3.1. Company Overview
- 12.1.3.2. Products
- 12.1.3.3. Company Financials
- 12.1.3.4. SWOT Analysis
- 12.1.4 Doosan Corporation
- 12.1.4.1. Company Overview
- 12.1.4.2. Products
- 12.1.4.3. Company Financials
- 12.1.4.4. SWOT Analysis
- 12.1.5 Emerson Electric Co
- 12.1.5.1. Company Overview
- 12.1.5.2. Products
- 12.1.5.3. Company Financials
- 12.1.5.4. SWOT Analysis
- 12.1.6 Mitsubishi Electric Corporation
- 12.1.6.1. Company Overview
- 12.1.6.2. Products
- 12.1.6.3. Company Financials
- 12.1.6.4. SWOT Analysis
- 12.1.7 Siemens AG
- 12.1.7.1. Company Overview
- 12.1.7.2. Products
- 12.1.7.3. Company Financials
- 12.1.7.4. SWOT Analysis
- 12.1.8 Schneider Electric SE
- 12.1.8.1. Company Overview
- 12.1.8.2. Products
- 12.1.8.3. Company Financials
- 12.1.8.4. SWOT Analysis
- 12.1.9 Oracle Corporation
- 12.1.9.1. Company Overview
- 12.1.9.2. Products
- 12.1.9.3. Company Financials
- 12.1.9.4. SWOT Analysis
- 12.1.10 Engie SA
- 12.1.10.1. Company Overview
- 12.1.10.2. Products
- 12.1.10.3. Company Financials
- 12.1.10.4. SWOT Analysis
- 12.1.11 General Electric Company
- 12.1.11.1. Company Overview
- 12.1.11.2. Products
- 12.1.11.3. Company Financials
- 12.1.11.4. SWOT Analysis
- 12.1.1 ABB Ltd
- 12.2. Market Entropy
- 12.2.1 Company's Key Areas Served
- 12.2.2 Recent Developments
- 12.3. Company Market Share Analysis 2025
- 12.3.1 Top 5 Companies Market Share Analysis
- 12.3.2 Top 3 Companies Market Share Analysis
- 12.4. List of Potential Customers
- 13. Research Methodology
List of Figures
- Figure 1: Global DERMS Industry Revenue Breakdown (Million, %) by Region 2025 & 2033
- Figure 2: North America DERMS Industry Revenue (Million), by Technology 2025 & 2033
- Figure 3: North America DERMS Industry Revenue Share (%), by Technology 2025 & 2033
- Figure 4: North America DERMS Industry Revenue (Million), by End User 2025 & 2033
- Figure 5: North America DERMS Industry Revenue Share (%), by End User 2025 & 2033
- Figure 6: North America DERMS Industry Revenue (Million), by Country 2025 & 2033
- Figure 7: North America DERMS Industry Revenue Share (%), by Country 2025 & 2033
- Figure 8: Europe DERMS Industry Revenue (Million), by Technology 2025 & 2033
- Figure 9: Europe DERMS Industry Revenue Share (%), by Technology 2025 & 2033
- Figure 10: Europe DERMS Industry Revenue (Million), by End User 2025 & 2033
- Figure 11: Europe DERMS Industry Revenue Share (%), by End User 2025 & 2033
- Figure 12: Europe DERMS Industry Revenue (Million), by Country 2025 & 2033
- Figure 13: Europe DERMS Industry Revenue Share (%), by Country 2025 & 2033
- Figure 14: Asia Pacific DERMS Industry Revenue (Million), by Technology 2025 & 2033
- Figure 15: Asia Pacific DERMS Industry Revenue Share (%), by Technology 2025 & 2033
- Figure 16: Asia Pacific DERMS Industry Revenue (Million), by End User 2025 & 2033
- Figure 17: Asia Pacific DERMS Industry Revenue Share (%), by End User 2025 & 2033
- Figure 18: Asia Pacific DERMS Industry Revenue (Million), by Country 2025 & 2033
- Figure 19: Asia Pacific DERMS Industry Revenue Share (%), by Country 2025 & 2033
- Figure 20: South America DERMS Industry Revenue (Million), by Technology 2025 & 2033
- Figure 21: South America DERMS Industry Revenue Share (%), by Technology 2025 & 2033
- Figure 22: South America DERMS Industry Revenue (Million), by End User 2025 & 2033
- Figure 23: South America DERMS Industry Revenue Share (%), by End User 2025 & 2033
- Figure 24: South America DERMS Industry Revenue (Million), by Country 2025 & 2033
- Figure 25: South America DERMS Industry Revenue Share (%), by Country 2025 & 2033
- Figure 26: Middle East and Africa DERMS Industry Revenue (Million), by Technology 2025 & 2033
- Figure 27: Middle East and Africa DERMS Industry Revenue Share (%), by Technology 2025 & 2033
- Figure 28: Middle East and Africa DERMS Industry Revenue (Million), by End User 2025 & 2033
- Figure 29: Middle East and Africa DERMS Industry Revenue Share (%), by End User 2025 & 2033
- Figure 30: Middle East and Africa DERMS Industry Revenue (Million), by Country 2025 & 2033
- Figure 31: Middle East and Africa DERMS Industry Revenue Share (%), by Country 2025 & 2033
List of Tables
- Table 1: Global DERMS Industry Revenue Million Forecast, by Technology 2020 & 2033
- Table 2: Global DERMS Industry Revenue Million Forecast, by End User 2020 & 2033
- Table 3: Global DERMS Industry Revenue Million Forecast, by Region 2020 & 2033
- Table 4: Global DERMS Industry Revenue Million Forecast, by Technology 2020 & 2033
- Table 5: Global DERMS Industry Revenue Million Forecast, by End User 2020 & 2033
- Table 6: Global DERMS Industry Revenue Million Forecast, by Country 2020 & 2033
- Table 7: United States DERMS Industry Revenue (Million) Forecast, by Application 2020 & 2033
- Table 8: Canada DERMS Industry Revenue (Million) Forecast, by Application 2020 & 2033
- Table 9: Rest of North America DERMS Industry Revenue (Million) Forecast, by Application 2020 & 2033
- Table 10: Global DERMS Industry Revenue Million Forecast, by Technology 2020 & 2033
- Table 11: Global DERMS Industry Revenue Million Forecast, by End User 2020 & 2033
- Table 12: Global DERMS Industry Revenue Million Forecast, by Country 2020 & 2033
- Table 13: Germany DERMS Industry Revenue (Million) Forecast, by Application 2020 & 2033
- Table 14: Italy DERMS Industry Revenue (Million) Forecast, by Application 2020 & 2033
- Table 15: France DERMS Industry Revenue (Million) Forecast, by Application 2020 & 2033
- Table 16: United Kingdom DERMS Industry Revenue (Million) Forecast, by Application 2020 & 2033
- Table 17: Rest of Europe DERMS Industry Revenue (Million) Forecast, by Application 2020 & 2033
- Table 18: Global DERMS Industry Revenue Million Forecast, by Technology 2020 & 2033
- Table 19: Global DERMS Industry Revenue Million Forecast, by End User 2020 & 2033
- Table 20: Global DERMS Industry Revenue Million Forecast, by Country 2020 & 2033
- Table 21: India DERMS Industry Revenue (Million) Forecast, by Application 2020 & 2033
- Table 22: China DERMS Industry Revenue (Million) Forecast, by Application 2020 & 2033
- Table 23: Japan DERMS Industry Revenue (Million) Forecast, by Application 2020 & 2033
- Table 24: South Korea DERMS Industry Revenue (Million) Forecast, by Application 2020 & 2033
- Table 25: Rest of Asia Pacific DERMS Industry Revenue (Million) Forecast, by Application 2020 & 2033
- Table 26: Global DERMS Industry Revenue Million Forecast, by Technology 2020 & 2033
- Table 27: Global DERMS Industry Revenue Million Forecast, by End User 2020 & 2033
- Table 28: Global DERMS Industry Revenue Million Forecast, by Country 2020 & 2033
- Table 29: Brazil DERMS Industry Revenue (Million) Forecast, by Application 2020 & 2033
- Table 30: Argentina DERMS Industry Revenue (Million) Forecast, by Application 2020 & 2033
- Table 31: Rest of South America DERMS Industry Revenue (Million) Forecast, by Application 2020 & 2033
- Table 32: Global DERMS Industry Revenue Million Forecast, by Technology 2020 & 2033
- Table 33: Global DERMS Industry Revenue Million Forecast, by End User 2020 & 2033
- Table 34: Global DERMS Industry Revenue Million Forecast, by Country 2020 & 2033
- Table 35: United Arab Emirates DERMS Industry Revenue (Million) Forecast, by Application 2020 & 2033
- Table 36: Saudi Arabia DERMS Industry Revenue (Million) Forecast, by Application 2020 & 2033
- Table 37: Saudi Arabia DERMS Industry Revenue (Million) Forecast, by Application 2020 & 2033
- Table 38: Rest of Middle East and Africa DERMS Industry Revenue (Million) Forecast, by Application 2020 & 2033
Frequently Asked Questions
1. What is the projected Compound Annual Growth Rate (CAGR) of the DERMS Industry?
The projected CAGR is approximately 18.31%.
2. Which companies are prominent players in the DERMS Industry?
Key companies in the market include ABB Ltd, Uplight Inc, Open Access Technology International Inc, Doosan Corporation, Emerson Electric Co, Mitsubishi Electric Corporation, Siemens AG, Schneider Electric SE, Oracle Corporation, Engie SA, General Electric Company.
3. What are the main segments of the DERMS Industry?
The market segments include Technology, End User.
4. Can you provide details about the market size?
The market size is estimated to be USD 1.20 Million as of 2022.
5. What are some drivers contributing to market growth?
4.; Increasing Shift Toward Renewables-based Distributed Power Generation4.; Rising Investments in Smart Grid.
6. What are the notable trends driving market growth?
Solar Photovoltaic (PV) Segment to Dominate the Market.
7. Are there any restraints impacting market growth?
4.; Expansion and Upgradation of Centralized Grid.
8. Can you provide examples of recent developments in the market?
February 2024: According to the N.C. Clean Energy Technology Center (NCCETC), a total of 774 grid modernization actions were taken in more than fifty states in 2023. The top trend in grid modernization includes the growing interest in virtual power plants, cost recovery for interconnection upgrades, examining the impacts of wholesale market participation, studying long-duration energy storage, utilities proposing new performance incentive mechanisms, undertaking grid resilience planning, utilities pursuing pilot programs and projects, utilizing green button standards for access to customer energy usage data, providing customers with demand response incentive opportunities, and utilities exploring opt-out time-varying rates.
9. What pricing options are available for accessing the report?
Pricing options include single-user, multi-user, and enterprise licenses priced at USD 4750, USD 5250, and USD 8750 respectively.
10. Is the market size provided in terms of value or volume?
The market size is provided in terms of value, measured in Million.
11. Are there any specific market keywords associated with the report?
Yes, the market keyword associated with the report is "DERMS Industry," which aids in identifying and referencing the specific market segment covered.
12. How do I determine which pricing option suits my needs best?
The pricing options vary based on user requirements and access needs. Individual users may opt for single-user licenses, while businesses requiring broader access may choose multi-user or enterprise licenses for cost-effective access to the report.
13. Are there any additional resources or data provided in the DERMS Industry report?
While the report offers comprehensive insights, it's advisable to review the specific contents or supplementary materials provided to ascertain if additional resources or data are available.
14. How can I stay updated on further developments or reports in the DERMS Industry?
To stay informed about further developments, trends, and reports in the DERMS Industry, consider subscribing to industry newsletters, following relevant companies and organizations, or regularly checking reputable industry news sources and publications.
Methodology
Step 1 - Identification of Relevant Samples Size from Population Database


Step 2 - Approaches for Defining Global Market Size (Value, Volume* & Price*)

Note*: In applicable scenarios
Step 3 - Data Sources
Primary Research
- Web Analytics
- Survey Reports
- Research Institute
- Latest Research Reports
- Opinion Leaders
Secondary Research
- Annual Reports
- White Paper
- Latest Press Release
- Industry Association
- Paid Database
- Investor Presentations

Step 4 - Data Triangulation
Involves using different sources of information in order to increase the validity of a study
These sources are likely to be stakeholders in a program - participants, other researchers, program staff, other community members, and so on.
Then we put all data in single framework & apply various statistical tools to find out the dynamic on the market.
During the analysis stage, feedback from the stakeholder groups would be compared to determine areas of agreement as well as areas of divergence