

Key Insights
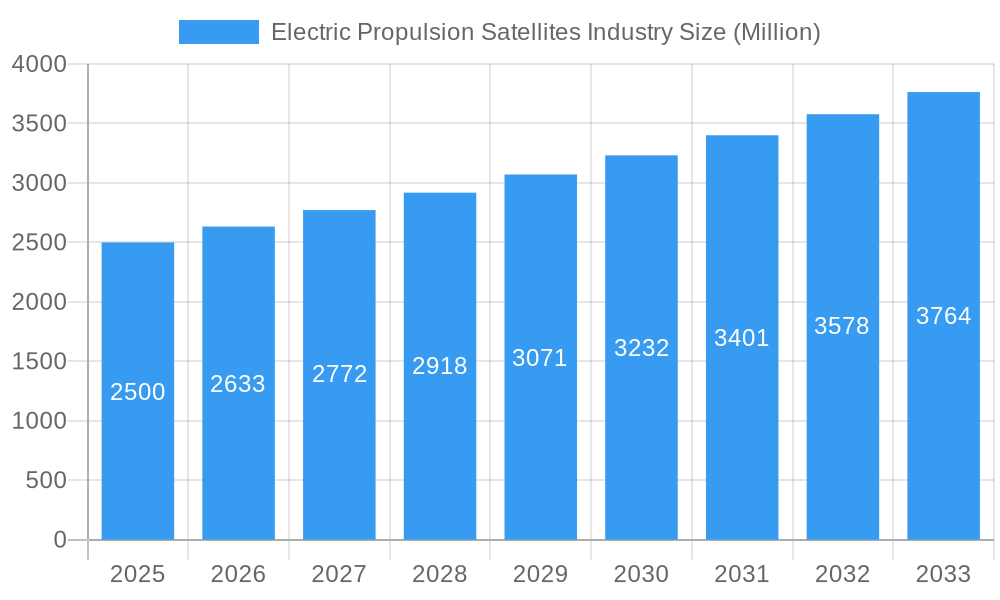
The Electric Propulsion Satellites (EPS) market is experiencing robust growth, driven by increasing demand for higher satellite performance, reduced operational costs, and enhanced mission flexibility. The market, valued at approximately $2.5 billion in 2025, is projected to exhibit a compound annual growth rate (CAGR) of 5.37% from 2025 to 2033, reaching an estimated market size of over $4 billion by 2033. This expansion is fueled by several key factors. The adoption of electric propulsion systems offers significant advantages over traditional chemical propulsion, including increased fuel efficiency leading to longer mission lifespans and greater maneuverability. Furthermore, the growing need for constellations of small satellites for various applications, like Earth observation, communication, and navigation, is significantly boosting the demand for cost-effective and efficient propulsion solutions like EPS. Technological advancements in electric thruster technology, miniaturization, and improved power systems are further accelerating market growth.
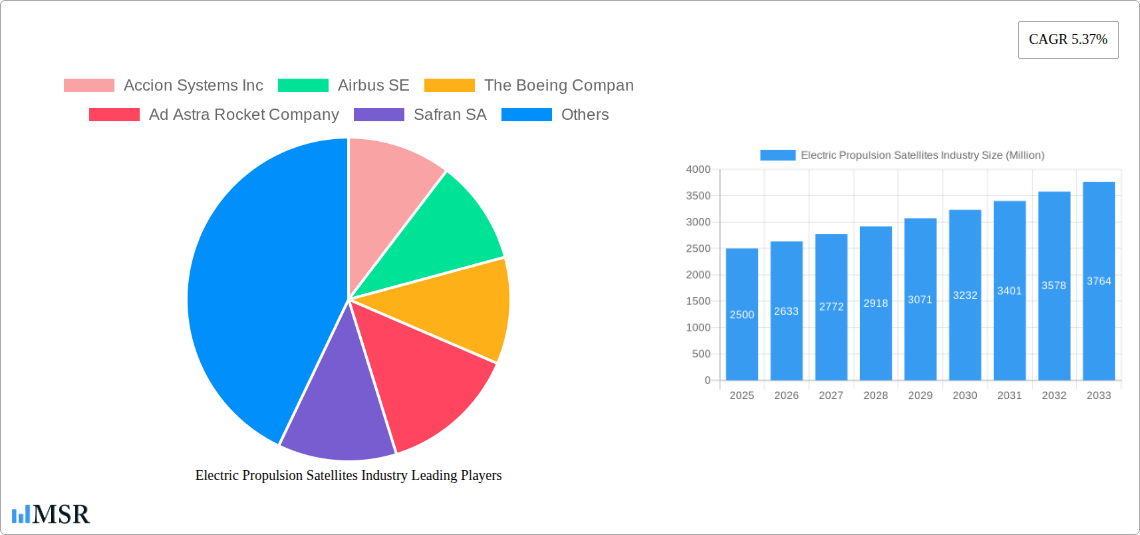
Electric Propulsion Satellites Industry Market Size (In Billion)
Segment-wise, the full-electric propulsion type is anticipated to dominate the market, driven by its superior fuel efficiency and versatility compared to hybrid systems. The commercial sector represents a significant portion of the market, fueled by the increasing demand for satellite-based services across various industries. Geographically, North America and Europe currently hold significant market shares, but the Asia-Pacific region is poised for substantial growth due to increasing investments in space exploration and satellite technology within the region. Key players like Accion Systems, Airbus, Boeing, and Safran are actively investing in research and development, and strategic partnerships to consolidate their market positions and capture emerging opportunities within this dynamic and rapidly evolving market landscape. The competitive landscape is characterized by a mix of established aerospace giants and innovative startups, leading to continuous technological innovation and market consolidation.
Electric Propulsion Satellites Industry Company Market Share
Electric Propulsion Satellites Industry: A Comprehensive Market Report (2019-2033)
This in-depth report provides a comprehensive analysis of the Electric Propulsion Satellites industry, offering crucial insights for stakeholders, investors, and industry professionals. Covering the period from 2019 to 2033, with a focus on 2025, this report meticulously examines market dynamics, growth drivers, key players, and emerging trends, empowering you to make informed strategic decisions. The global electric propulsion satellites market is projected to reach xx Million by 2033, exhibiting a robust Compound Annual Growth Rate (CAGR) of xx% during the forecast period (2025-2033).
Electric Propulsion Satellites Industry Market Concentration & Dynamics
The Electric Propulsion Satellites market exhibits a moderately concentrated landscape, with key players like The Boeing Company, Airbus SE, and Northrop Grumman Corporation holding significant market share. However, the presence of several smaller, innovative companies like Accion Systems Inc. and Busek Co Inc. fosters a dynamic competitive environment. Market share fluctuations are influenced by factors such as technological advancements, successful product launches, and strategic mergers and acquisitions (M&A).
- Market Concentration: The top 5 players account for approximately xx% of the market share in 2025.
- Innovation Ecosystems: A vibrant ecosystem of research institutions, startups, and established players drives innovation in electric propulsion technologies.
- Regulatory Frameworks: International space regulations and national policies significantly influence market growth, particularly regarding satellite deployment and operation.
- Substitute Products: While currently limited, alternative propulsion methods are under development and could pose a potential threat in the long term.
- End-User Trends: Increasing demand for smaller, more agile satellites for commercial and military applications fuels market growth.
- M&A Activities: The past five years (2019-2024) witnessed xx M&A deals in the electric propulsion satellites sector, signifying industry consolidation and strategic partnerships.
Electric Propulsion Satellites Industry Industry Insights & Trends
The Electric Propulsion Satellites market is experiencing robust growth, driven primarily by the increasing demand for smaller, more fuel-efficient satellites. The miniaturization of satellites and the rise of constellations for various applications, including Earth observation, communication, and navigation, are significant factors. Technological advancements in electric propulsion systems, such as the development of more efficient ion thrusters and Hall-effect thrusters, are also contributing to market expansion. Furthermore, the rising adoption of electric propulsion in both commercial and military applications underscores the technology's growing prominence. The market size was valued at xx Million in 2025, and is anticipated to reach xx Million by 2033.
Key Markets & Segments Leading Electric Propulsion Satellites Industry
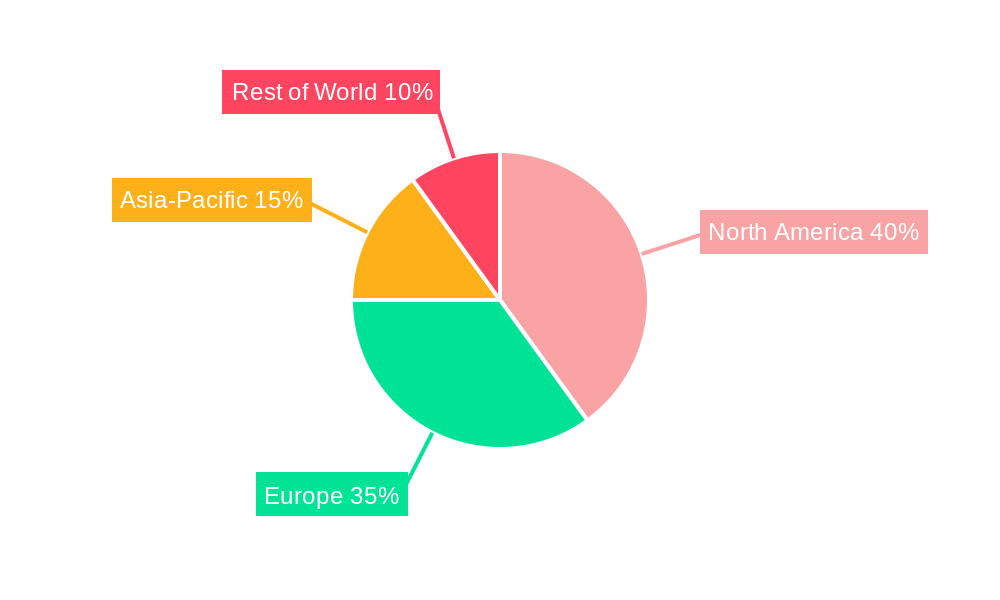
North America currently dominates the Electric Propulsion Satellites market, driven by robust government funding for space exploration and defense initiatives, along with a strong presence of major aerospace companies. However, the Asia-Pacific region is witnessing rapid growth, fueled by increasing investment in satellite technology and space programs.
- Dominant Region: North America
- Dominant Propulsion Type: Full-electric propulsion systems hold a larger market share due to their high efficiency and versatility.
- Dominant End-User: The commercial segment is experiencing faster growth due to the rise of NewSpace companies and increasing demand for communication and Earth observation satellites.
Drivers:
- North America: Strong government support, established aerospace industry, and high technological advancements.
- Asia-Pacific: Rapid economic growth, increasing investment in space exploration, and government initiatives.
- Europe: Strong research and development infrastructure, presence of established aerospace companies, and collaborations across member states.
- Full Electric Propulsion: Higher efficiency, longer lifespan, and reduced reliance on chemical propellants.
- Commercial End-User: Expanding satellite constellations, increasing demand for communication and Earth observation satellites.
Electric Propulsion Satellites Industry Product Developments
Recent innovations focus on higher-efficiency electric propulsion systems, miniaturization for CubeSats and smallsats, and improved reliability for long-duration missions. Companies are developing advanced ion thrusters and Hall-effect thrusters with enhanced performance and reduced costs. These advancements are driving increased adoption across diverse applications, providing competitive advantages through enhanced fuel efficiency, extended mission life, and improved maneuverability.
Challenges in the Electric Propulsion Satellites Industry Market
The Electric Propulsion Satellites industry faces challenges including high initial development costs, stringent regulatory compliance requirements, and the complex supply chain management involved in procuring specialized components. Furthermore, competition from alternative propulsion technologies and the need for continuous technological innovation to maintain a competitive edge pose significant hurdles. These factors collectively limit the market's overall growth rate, particularly in the early stages of adoption.
Forces Driving Electric Propulsion Satellites Industry Growth
Key growth drivers include increasing demand for smaller, more fuel-efficient satellites; advancements in electric propulsion technology; rising government and private investments in space exploration; and the growing need for satellite-based services in various sectors. The development of more efficient and cost-effective electric propulsion systems, coupled with the expansion of satellite constellations, are key accelerators.
Long-Term Growth Catalysts in the Electric Propulsion Satellites Industry
Long-term growth is fueled by the potential for increased collaboration between government agencies and private companies, further technological innovation leading to even more efficient and cost-effective systems, and the expansion into new applications like deep space exploration.
Emerging Opportunities in Electric Propulsion Satellites Industry
Emerging opportunities reside in the development of advanced electric propulsion systems for deep space missions, integration with advanced satellite technologies, and the expansion into new markets, such as in-space servicing and debris removal. The use of electric propulsion in conjunction with other innovative technologies presents significant potential for growth.
Leading Players in the Electric Propulsion Satellites Industry Sector
Key Milestones in Electric Propulsion Satellites Industry Industry
- 2020: Successful testing of a new high-efficiency ion thruster by a leading company.
- 2021: Significant investment in electric propulsion research by a major government agency.
- 2022: Launch of a commercial satellite utilizing a new generation electric propulsion system.
- 2023: Acquisition of a smaller electric propulsion company by a larger aerospace corporation.
- 2024: Announcement of a new multi-year research collaboration focused on advanced electric propulsion technology.
Strategic Outlook for Electric Propulsion Satellites Industry Market
The Electric Propulsion Satellites market is poised for substantial growth, driven by technological advancements, increasing demand, and strategic partnerships. The long-term outlook is positive, with significant opportunities for companies that can innovate, adapt, and effectively navigate the regulatory landscape. The market is expected to experience a period of sustained growth and consolidation.
Electric Propulsion Satellites Industry Segmentation
-
1. Propulsion Type
- 1.1. Full Electric
- 1.2. Hybrid
-
2. End User
- 2.1. Commercial
- 2.2. Military
Electric Propulsion Satellites Industry Segmentation By Geography
-
1. North America
- 1.1. United States
- 1.2. Canada
- 1.3. Mexico
-
2. South America
- 2.1. Brazil
- 2.2. Argentina
- 2.3. Rest of South America
-
3. Europe
- 3.1. United Kingdom
- 3.2. Germany
- 3.3. France
- 3.4. Italy
- 3.5. Spain
- 3.6. Russia
- 3.7. Benelux
- 3.8. Nordics
- 3.9. Rest of Europe
-
4. Middle East & Africa
- 4.1. Turkey
- 4.2. Israel
- 4.3. GCC
- 4.4. North Africa
- 4.5. South Africa
- 4.6. Rest of Middle East & Africa
-
5. Asia Pacific
- 5.1. China
- 5.2. India
- 5.3. Japan
- 5.4. South Korea
- 5.5. ASEAN
- 5.6. Oceania
- 5.7. Rest of Asia Pacific
Electric Propulsion Satellites Industry Regional Market Share
Geographic Coverage of Electric Propulsion Satellites Industry
Electric Propulsion Satellites Industry REPORT HIGHLIGHTS
| Aspects | Details |
|---|---|
| Study Period | 2020-2034 |
| Base Year | 2025 |
| Estimated Year | 2026 |
| Forecast Period | 2026-2034 |
| Historical Period | 2020-2025 |
| Growth Rate | CAGR of 13.7% from 2020-2034 |
| Segmentation |
|
Table of Contents
- 1. Introduction
- 1.1. Research Scope
- 1.2. Market Segmentation
- 1.3. Research Objective
- 1.4. Definitions and Assumptions
- 2. Executive Summary
- 2.1. Market Snapshot
- 3. Market Dynamics
- 3.1. Market Drivers
- 3.2. Market Restrains
- 3.3. Market Trends
- 3.4. Market Opportunities
- 4. Market Factor Analysis
- 4.1. Porters Five Forces
- 4.1.1. Bargaining Power of Suppliers
- 4.1.2. Bargaining Power of Buyers
- 4.1.3. Threat of New Entrants
- 4.1.4. Threat of Substitutes
- 4.1.5. Competitive Rivalry
- 4.2. PESTEL analysis
- 4.3. BCG Analysis
- 4.3.1. Stars (High Growth, High Market Share)
- 4.3.2. Cash Cows (Low Growth, High Market Share)
- 4.3.3. Question Mark (High Growth, Low Market Share)
- 4.3.4. Dogs (Low Growth, Low Market Share)
- 4.4. Ansoff Matrix Analysis
- 4.5. Supply Chain Analysis
- 4.6. Regulatory Landscape
- 4.7. Current Market Potential and Opportunity Assessment (TAM–SAM–SOM Framework)
- 4.8. MSR Analyst Note
- 4.1. Porters Five Forces
- 5. Market Analysis, Insights and Forecast 2021-2033
- 5.1. Market Analysis, Insights and Forecast - by Propulsion Type
- 5.1.1. Full Electric
- 5.1.2. Hybrid
- 5.2. Market Analysis, Insights and Forecast - by End User
- 5.2.1. Commercial
- 5.2.2. Military
- 5.3. Market Analysis, Insights and Forecast - by Region
- 5.3.1. North America
- 5.3.2. South America
- 5.3.3. Europe
- 5.3.4. Middle East & Africa
- 5.3.5. Asia Pacific
- 5.1. Market Analysis, Insights and Forecast - by Propulsion Type
- 6. Global Electric Propulsion Satellites Industry Analysis, Insights and Forecast, 2021-2033
- 6.1. Market Analysis, Insights and Forecast - by Propulsion Type
- 6.1.1. Full Electric
- 6.1.2. Hybrid
- 6.2. Market Analysis, Insights and Forecast - by End User
- 6.2.1. Commercial
- 6.2.2. Military
- 6.1. Market Analysis, Insights and Forecast - by Propulsion Type
- 7. North America Electric Propulsion Satellites Industry Analysis, Insights and Forecast, 2020-2032
- 7.1. Market Analysis, Insights and Forecast - by Propulsion Type
- 7.1.1. Full Electric
- 7.1.2. Hybrid
- 7.2. Market Analysis, Insights and Forecast - by End User
- 7.2.1. Commercial
- 7.2.2. Military
- 7.1. Market Analysis, Insights and Forecast - by Propulsion Type
- 8. South America Electric Propulsion Satellites Industry Analysis, Insights and Forecast, 2020-2032
- 8.1. Market Analysis, Insights and Forecast - by Propulsion Type
- 8.1.1. Full Electric
- 8.1.2. Hybrid
- 8.2. Market Analysis, Insights and Forecast - by End User
- 8.2.1. Commercial
- 8.2.2. Military
- 8.1. Market Analysis, Insights and Forecast - by Propulsion Type
- 9. Europe Electric Propulsion Satellites Industry Analysis, Insights and Forecast, 2020-2032
- 9.1. Market Analysis, Insights and Forecast - by Propulsion Type
- 9.1.1. Full Electric
- 9.1.2. Hybrid
- 9.2. Market Analysis, Insights and Forecast - by End User
- 9.2.1. Commercial
- 9.2.2. Military
- 9.1. Market Analysis, Insights and Forecast - by Propulsion Type
- 10. Middle East & Africa Electric Propulsion Satellites Industry Analysis, Insights and Forecast, 2020-2032
- 10.1. Market Analysis, Insights and Forecast - by Propulsion Type
- 10.1.1. Full Electric
- 10.1.2. Hybrid
- 10.2. Market Analysis, Insights and Forecast - by End User
- 10.2.1. Commercial
- 10.2.2. Military
- 10.1. Market Analysis, Insights and Forecast - by Propulsion Type
- 11. Asia Pacific Electric Propulsion Satellites Industry Analysis, Insights and Forecast, 2020-2032
- 11.1. Market Analysis, Insights and Forecast - by Propulsion Type
- 11.1.1. Full Electric
- 11.1.2. Hybrid
- 11.2. Market Analysis, Insights and Forecast - by End User
- 11.2.1. Commercial
- 11.2.2. Military
- 11.1. Market Analysis, Insights and Forecast - by Propulsion Type
- 12. Competitive Analysis
- 12.1. Company Profiles
- 12.1.1 Accion Systems Inc
- 12.1.1.1. Company Overview
- 12.1.1.2. Products
- 12.1.1.3. Company Financials
- 12.1.1.4. SWOT Analysis
- 12.1.2 Airbus SE
- 12.1.2.1. Company Overview
- 12.1.2.2. Products
- 12.1.2.3. Company Financials
- 12.1.2.4. SWOT Analysis
- 12.1.3 The Boeing Compan
- 12.1.3.1. Company Overview
- 12.1.3.2. Products
- 12.1.3.3. Company Financials
- 12.1.3.4. SWOT Analysis
- 12.1.4 Ad Astra Rocket Company
- 12.1.4.1. Company Overview
- 12.1.4.2. Products
- 12.1.4.3. Company Financials
- 12.1.4.4. SWOT Analysis
- 12.1.5 Safran SA
- 12.1.5.1. Company Overview
- 12.1.5.2. Products
- 12.1.5.3. Company Financials
- 12.1.5.4. SWOT Analysis
- 12.1.6 Thales
- 12.1.6.1. Company Overview
- 12.1.6.2. Products
- 12.1.6.3. Company Financials
- 12.1.6.4. SWOT Analysis
- 12.1.7 Aerojet Rocketdyne Holdings Inc
- 12.1.7.1. Company Overview
- 12.1.7.2. Products
- 12.1.7.3. Company Financials
- 12.1.7.4. SWOT Analysis
- 12.1.8 Sitael S p A
- 12.1.8.1. Company Overview
- 12.1.8.2. Products
- 12.1.8.3. Company Financials
- 12.1.8.4. SWOT Analysis
- 12.1.9 Busek Co Inc
- 12.1.9.1. Company Overview
- 12.1.9.2. Products
- 12.1.9.3. Company Financials
- 12.1.9.4. SWOT Analysis
- 12.1.10 Northrop Grumman Corporation
- 12.1.10.1. Company Overview
- 12.1.10.2. Products
- 12.1.10.3. Company Financials
- 12.1.10.4. SWOT Analysis
- 12.1.1 Accion Systems Inc
- 12.2. Market Entropy
- 12.2.1 Company's Key Areas Served
- 12.2.2 Recent Developments
- 12.3. Company Market Share Analysis 2025
- 12.3.1 Top 5 Companies Market Share Analysis
- 12.3.2 Top 3 Companies Market Share Analysis
- 12.4. List of Potential Customers
- 13. Research Methodology
List of Figures
- Figure 1: Global Electric Propulsion Satellites Industry Revenue Breakdown (billion, %) by Region 2025 & 2033
- Figure 2: North America Electric Propulsion Satellites Industry Revenue (billion), by Propulsion Type 2025 & 2033
- Figure 3: North America Electric Propulsion Satellites Industry Revenue Share (%), by Propulsion Type 2025 & 2033
- Figure 4: North America Electric Propulsion Satellites Industry Revenue (billion), by End User 2025 & 2033
- Figure 5: North America Electric Propulsion Satellites Industry Revenue Share (%), by End User 2025 & 2033
- Figure 6: North America Electric Propulsion Satellites Industry Revenue (billion), by Country 2025 & 2033
- Figure 7: North America Electric Propulsion Satellites Industry Revenue Share (%), by Country 2025 & 2033
- Figure 8: South America Electric Propulsion Satellites Industry Revenue (billion), by Propulsion Type 2025 & 2033
- Figure 9: South America Electric Propulsion Satellites Industry Revenue Share (%), by Propulsion Type 2025 & 2033
- Figure 10: South America Electric Propulsion Satellites Industry Revenue (billion), by End User 2025 & 2033
- Figure 11: South America Electric Propulsion Satellites Industry Revenue Share (%), by End User 2025 & 2033
- Figure 12: South America Electric Propulsion Satellites Industry Revenue (billion), by Country 2025 & 2033
- Figure 13: South America Electric Propulsion Satellites Industry Revenue Share (%), by Country 2025 & 2033
- Figure 14: Europe Electric Propulsion Satellites Industry Revenue (billion), by Propulsion Type 2025 & 2033
- Figure 15: Europe Electric Propulsion Satellites Industry Revenue Share (%), by Propulsion Type 2025 & 2033
- Figure 16: Europe Electric Propulsion Satellites Industry Revenue (billion), by End User 2025 & 2033
- Figure 17: Europe Electric Propulsion Satellites Industry Revenue Share (%), by End User 2025 & 2033
- Figure 18: Europe Electric Propulsion Satellites Industry Revenue (billion), by Country 2025 & 2033
- Figure 19: Europe Electric Propulsion Satellites Industry Revenue Share (%), by Country 2025 & 2033
- Figure 20: Middle East & Africa Electric Propulsion Satellites Industry Revenue (billion), by Propulsion Type 2025 & 2033
- Figure 21: Middle East & Africa Electric Propulsion Satellites Industry Revenue Share (%), by Propulsion Type 2025 & 2033
- Figure 22: Middle East & Africa Electric Propulsion Satellites Industry Revenue (billion), by End User 2025 & 2033
- Figure 23: Middle East & Africa Electric Propulsion Satellites Industry Revenue Share (%), by End User 2025 & 2033
- Figure 24: Middle East & Africa Electric Propulsion Satellites Industry Revenue (billion), by Country 2025 & 2033
- Figure 25: Middle East & Africa Electric Propulsion Satellites Industry Revenue Share (%), by Country 2025 & 2033
- Figure 26: Asia Pacific Electric Propulsion Satellites Industry Revenue (billion), by Propulsion Type 2025 & 2033
- Figure 27: Asia Pacific Electric Propulsion Satellites Industry Revenue Share (%), by Propulsion Type 2025 & 2033
- Figure 28: Asia Pacific Electric Propulsion Satellites Industry Revenue (billion), by End User 2025 & 2033
- Figure 29: Asia Pacific Electric Propulsion Satellites Industry Revenue Share (%), by End User 2025 & 2033
- Figure 30: Asia Pacific Electric Propulsion Satellites Industry Revenue (billion), by Country 2025 & 2033
- Figure 31: Asia Pacific Electric Propulsion Satellites Industry Revenue Share (%), by Country 2025 & 2033
List of Tables
- Table 1: Global Electric Propulsion Satellites Industry Revenue billion Forecast, by Propulsion Type 2020 & 2033
- Table 2: Global Electric Propulsion Satellites Industry Revenue billion Forecast, by End User 2020 & 2033
- Table 3: Global Electric Propulsion Satellites Industry Revenue billion Forecast, by Region 2020 & 2033
- Table 4: Global Electric Propulsion Satellites Industry Revenue billion Forecast, by Propulsion Type 2020 & 2033
- Table 5: Global Electric Propulsion Satellites Industry Revenue billion Forecast, by End User 2020 & 2033
- Table 6: Global Electric Propulsion Satellites Industry Revenue billion Forecast, by Country 2020 & 2033
- Table 7: United States Electric Propulsion Satellites Industry Revenue (billion) Forecast, by Application 2020 & 2033
- Table 8: Canada Electric Propulsion Satellites Industry Revenue (billion) Forecast, by Application 2020 & 2033
- Table 9: Mexico Electric Propulsion Satellites Industry Revenue (billion) Forecast, by Application 2020 & 2033
- Table 10: Global Electric Propulsion Satellites Industry Revenue billion Forecast, by Propulsion Type 2020 & 2033
- Table 11: Global Electric Propulsion Satellites Industry Revenue billion Forecast, by End User 2020 & 2033
- Table 12: Global Electric Propulsion Satellites Industry Revenue billion Forecast, by Country 2020 & 2033
- Table 13: Brazil Electric Propulsion Satellites Industry Revenue (billion) Forecast, by Application 2020 & 2033
- Table 14: Argentina Electric Propulsion Satellites Industry Revenue (billion) Forecast, by Application 2020 & 2033
- Table 15: Rest of South America Electric Propulsion Satellites Industry Revenue (billion) Forecast, by Application 2020 & 2033
- Table 16: Global Electric Propulsion Satellites Industry Revenue billion Forecast, by Propulsion Type 2020 & 2033
- Table 17: Global Electric Propulsion Satellites Industry Revenue billion Forecast, by End User 2020 & 2033
- Table 18: Global Electric Propulsion Satellites Industry Revenue billion Forecast, by Country 2020 & 2033
- Table 19: United Kingdom Electric Propulsion Satellites Industry Revenue (billion) Forecast, by Application 2020 & 2033
- Table 20: Germany Electric Propulsion Satellites Industry Revenue (billion) Forecast, by Application 2020 & 2033
- Table 21: France Electric Propulsion Satellites Industry Revenue (billion) Forecast, by Application 2020 & 2033
- Table 22: Italy Electric Propulsion Satellites Industry Revenue (billion) Forecast, by Application 2020 & 2033
- Table 23: Spain Electric Propulsion Satellites Industry Revenue (billion) Forecast, by Application 2020 & 2033
- Table 24: Russia Electric Propulsion Satellites Industry Revenue (billion) Forecast, by Application 2020 & 2033
- Table 25: Benelux Electric Propulsion Satellites Industry Revenue (billion) Forecast, by Application 2020 & 2033
- Table 26: Nordics Electric Propulsion Satellites Industry Revenue (billion) Forecast, by Application 2020 & 2033
- Table 27: Rest of Europe Electric Propulsion Satellites Industry Revenue (billion) Forecast, by Application 2020 & 2033
- Table 28: Global Electric Propulsion Satellites Industry Revenue billion Forecast, by Propulsion Type 2020 & 2033
- Table 29: Global Electric Propulsion Satellites Industry Revenue billion Forecast, by End User 2020 & 2033
- Table 30: Global Electric Propulsion Satellites Industry Revenue billion Forecast, by Country 2020 & 2033
- Table 31: Turkey Electric Propulsion Satellites Industry Revenue (billion) Forecast, by Application 2020 & 2033
- Table 32: Israel Electric Propulsion Satellites Industry Revenue (billion) Forecast, by Application 2020 & 2033
- Table 33: GCC Electric Propulsion Satellites Industry Revenue (billion) Forecast, by Application 2020 & 2033
- Table 34: North Africa Electric Propulsion Satellites Industry Revenue (billion) Forecast, by Application 2020 & 2033
- Table 35: South Africa Electric Propulsion Satellites Industry Revenue (billion) Forecast, by Application 2020 & 2033
- Table 36: Rest of Middle East & Africa Electric Propulsion Satellites Industry Revenue (billion) Forecast, by Application 2020 & 2033
- Table 37: Global Electric Propulsion Satellites Industry Revenue billion Forecast, by Propulsion Type 2020 & 2033
- Table 38: Global Electric Propulsion Satellites Industry Revenue billion Forecast, by End User 2020 & 2033
- Table 39: Global Electric Propulsion Satellites Industry Revenue billion Forecast, by Country 2020 & 2033
- Table 40: China Electric Propulsion Satellites Industry Revenue (billion) Forecast, by Application 2020 & 2033
- Table 41: India Electric Propulsion Satellites Industry Revenue (billion) Forecast, by Application 2020 & 2033
- Table 42: Japan Electric Propulsion Satellites Industry Revenue (billion) Forecast, by Application 2020 & 2033
- Table 43: South Korea Electric Propulsion Satellites Industry Revenue (billion) Forecast, by Application 2020 & 2033
- Table 44: ASEAN Electric Propulsion Satellites Industry Revenue (billion) Forecast, by Application 2020 & 2033
- Table 45: Oceania Electric Propulsion Satellites Industry Revenue (billion) Forecast, by Application 2020 & 2033
- Table 46: Rest of Asia Pacific Electric Propulsion Satellites Industry Revenue (billion) Forecast, by Application 2020 & 2033
Frequently Asked Questions
1. What is the projected Compound Annual Growth Rate (CAGR) of the Electric Propulsion Satellites Industry?
The projected CAGR is approximately 13.7%.
2. Which companies are prominent players in the Electric Propulsion Satellites Industry?
Key companies in the market include Accion Systems Inc, Airbus SE, The Boeing Compan, Ad Astra Rocket Company, Safran SA, Thales, Aerojet Rocketdyne Holdings Inc, Sitael S p A, Busek Co Inc, Northrop Grumman Corporation.
3. What are the main segments of the Electric Propulsion Satellites Industry?
The market segments include Propulsion Type, End User.
4. Can you provide details about the market size?
The market size is estimated to be USD 55.23 billion as of 2022.
5. What are some drivers contributing to market growth?
N/A
6. What are the notable trends driving market growth?
The growing interest of governments and private players in space exploration have fueled the expansion of this market.
7. Are there any restraints impacting market growth?
N/A
8. Can you provide examples of recent developments in the market?
N/A
9. What pricing options are available for accessing the report?
Pricing options include single-user, multi-user, and enterprise licenses priced at USD 3800, USD 4500, and USD 5800 respectively.
10. Is the market size provided in terms of value or volume?
The market size is provided in terms of value, measured in billion.
11. Are there any specific market keywords associated with the report?
Yes, the market keyword associated with the report is "Electric Propulsion Satellites Industry," which aids in identifying and referencing the specific market segment covered.
12. How do I determine which pricing option suits my needs best?
The pricing options vary based on user requirements and access needs. Individual users may opt for single-user licenses, while businesses requiring broader access may choose multi-user or enterprise licenses for cost-effective access to the report.
13. Are there any additional resources or data provided in the Electric Propulsion Satellites Industry report?
While the report offers comprehensive insights, it's advisable to review the specific contents or supplementary materials provided to ascertain if additional resources or data are available.
14. How can I stay updated on further developments or reports in the Electric Propulsion Satellites Industry?
To stay informed about further developments, trends, and reports in the Electric Propulsion Satellites Industry, consider subscribing to industry newsletters, following relevant companies and organizations, or regularly checking reputable industry news sources and publications.
Methodology
Step 1 - Identification of Relevant Samples Size from Population Database


Step 2 - Approaches for Defining Global Market Size (Value, Volume* & Price*)

Note*: In applicable scenarios
Step 3 - Data Sources
Primary Research
- Web Analytics
- Survey Reports
- Research Institute
- Latest Research Reports
- Opinion Leaders
Secondary Research
- Annual Reports
- White Paper
- Latest Press Release
- Industry Association
- Paid Database
- Investor Presentations

Step 4 - Data Triangulation
Involves using different sources of information in order to increase the validity of a study
These sources are likely to be stakeholders in a program - participants, other researchers, program staff, other community members, and so on.
Then we put all data in single framework & apply various statistical tools to find out the dynamic on the market.
During the analysis stage, feedback from the stakeholder groups would be compared to determine areas of agreement as well as areas of divergence