

Key Insights
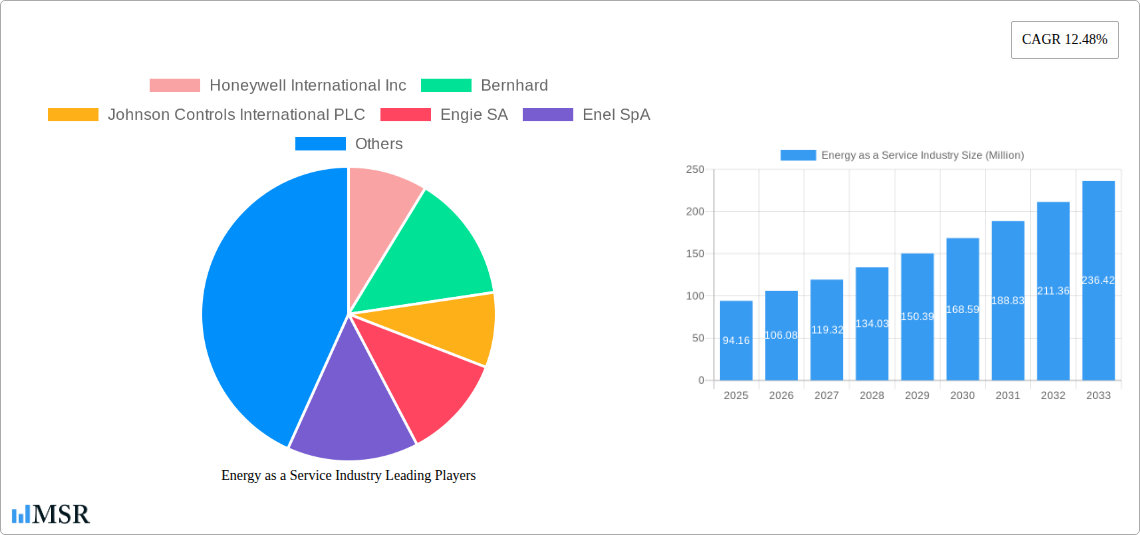
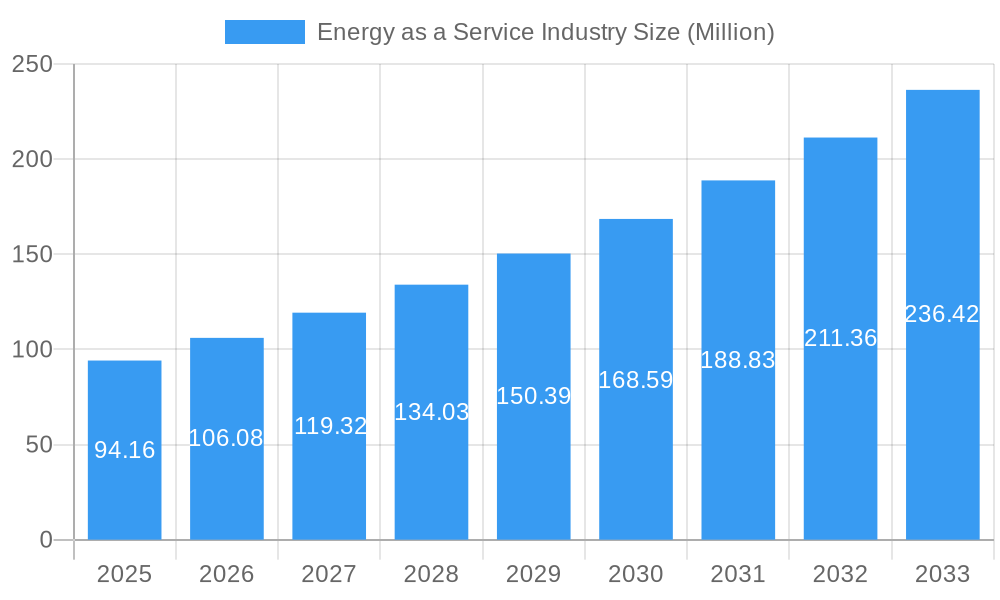
The Energy as a Service (EaaS) market, valued at $94.16 million in 2025, is experiencing robust growth, projected to expand at a Compound Annual Growth Rate (CAGR) of 12.48% from 2025 to 2033. This significant growth is fueled by several key factors. Increasing energy costs and a growing demand for energy efficiency are driving businesses and industries to adopt EaaS solutions, which offer predictable operational expenditure and reduced capital investment. Furthermore, the increasing adoption of renewable energy sources and smart technologies are creating opportunities for innovative EaaS offerings that integrate sustainability and efficiency. The market is segmented by end-user into commercial and industrial sectors, with the commercial sector currently holding a larger market share due to the high concentration of buildings requiring efficient energy management. However, the industrial sector is expected to witness faster growth in the forecast period driven by increasing industrial automation and the implementation of smart factories requiring reliable and optimized energy solutions. Key players like Honeywell, Johnson Controls, and Schneider Electric are strategically investing in research and development, mergers, and acquisitions to consolidate their market positions and expand their EaaS portfolio.
Energy as a Service Industry Market Size (In Million)
The geographical distribution of the EaaS market reflects the varying levels of energy consumption and technological advancements across regions. North America, particularly the United States, currently holds a significant market share due to the high adoption of advanced energy management systems and government initiatives promoting energy efficiency. However, the Asia-Pacific region, especially China and India, is expected to witness substantial growth during the forecast period driven by rapid urbanization, industrialization, and increasing government investments in renewable energy projects. Europe's EaaS market is also projected to grow steadily, fueled by stringent environmental regulations and a rising focus on decarbonization. The overall EaaS market landscape is characterized by intense competition, technological innovation, and strategic partnerships, making it a dynamic and rapidly evolving sector.
Energy as a Service Industry Company Market Share
Energy as a Service (EaaS) Industry Report: 2019-2033 Forecast
This comprehensive report provides an in-depth analysis of the Energy as a Service (EaaS) industry, projecting a market value exceeding $XX Million by 2033. The study covers the period 2019-2033, with 2025 as the base and estimated year. It offers actionable insights for stakeholders across the EaaS value chain, including key players like Honeywell International Inc, Bernhard, Johnson Controls International PLC, Engie SA, Enel SpA, Spark Community Investment Co, Schneider Electric SE, Veolia Environnement SA, and Electricite de France (EDF) SA. This report is meticulously crafted, requiring no further modification, and utilizes precise figures where available, or reasonable estimations where data is unavailable.
Energy as a Service Industry Market Concentration & Dynamics
This section analyzes the EaaS market's competitive landscape, encompassing market concentration, innovation, regulatory aspects, substitute products, end-user trends, and M&A activity. The study period (2019-2024) reveals a moderately concentrated market with a top 5 market share of approximately XX%. Significant M&A activity, totaling approximately XX deals during the historical period, indicates ongoing consolidation.
- Market Concentration: The EaaS market is characterized by a combination of large multinational corporations and specialized smaller players, leading to a moderately concentrated structure with significant opportunities for both organic growth and acquisitions.
- Innovation Ecosystems: Strong collaborations between technology providers, energy companies, and building management firms drive innovation, particularly in areas like AI-driven energy optimization and distributed generation technologies.
- Regulatory Frameworks: Government policies promoting renewable energy and energy efficiency significantly influence market growth and investment decisions. Variations in regulations across different regions pose both challenges and opportunities.
- Substitute Products: Traditional energy procurement models and on-site energy generation solutions represent primary substitutes, although EaaS models increasingly offer superior cost-effectiveness and environmental benefits.
- End-User Trends: A growing focus on sustainability, coupled with the rising demand for reliable and cost-effective energy solutions, fuels the adoption of EaaS among commercial and industrial end-users.
- M&A Activities: The XX M&A deals observed during the historical period signify strategic moves by major players to expand market share, acquire innovative technologies, and broaden service offerings.
Energy as a Service Industry Industry Insights & Trends
The Energy as a Service (EaaS) market is experiencing substantial expansion, fueled by a confluence of escalating energy expenses, increasingly stringent environmental mandates, and the widespread integration of intelligent technologies. While precise figures for 2025 are pending, the market was projected to reach an estimated value of $XX Million, with forecasts indicating a robust growth trajectory to $XX Million by 2033. This represents a projected Compound Annual Growth Rate (CAGR) of XX% across the 2025-2033 forecast period. Innovations, especially in the realms of the Internet of Things (IoT), Artificial Intelligence (AI), and the seamless integration of renewable energy sources, are fundamentally reshaping the industry's dynamics. A significant shift in consumer preference is evident, with a growing demand for adaptable, performance-driven energy solutions – the very essence of EaaS. This trend is further accelerated by supportive government initiatives and a proactive corporate commitment to sustainability. Collectively, these powerful drivers paint an optimistic picture for the continued ascent of the EaaS market.
Key Markets & Segments Leading Energy as a Service Industry
The commercial and industrial sectors stand as the primary architects of EaaS market expansion. The commercial landscape, while characterized by a multitude of smaller energy consumers, presents a fragmented yet exceptionally promising avenue for growth. Conversely, the industrial sector, though less fragmented, offers immense opportunities owing to its substantial energy consumption patterns.
- Commercial Segment Drivers:
- Sustained economic growth, which inherently amplifies the demand for energy-efficient solutions.
- Government incentives and evolving regulations that actively encourage energy conservation and the reduction of carbon emissions.
- The accelerating adoption of smart building technologies, facilitating more sophisticated and effective energy management strategies.
- Industrial Segment Drivers:
- High energy usage that translates directly into significant potential for cost savings and operational efficiencies.
- A strategic focus on optimizing operational performance and actively minimizing environmental impact.
- Substantial investments in automation and digitization, which create fertile ground for seamless EaaS integration.
The commercial segment's current leadership is largely attributed to its extensive customer base and the relative ease of implementing EaaS solutions in smaller-scale facilities, a contrast to the intricate challenges often associated with large industrial operations. Nevertheless, the industrial segment holds the potential for greater revenue generation and is anticipated to experience a more rapid growth rate throughout the forecast period.
Energy as a Service Industry Product Developments
Recent advancements in EaaS offerings highlight the integration of smart sensors, data analytics, and AI-powered optimization algorithms. This has led to the development of sophisticated energy management platforms that deliver real-time insights and automated control systems, resulting in substantial energy savings and improved operational efficiency. This also leads to a competitive advantage for providers who offer these advanced solutions.
Challenges in the Energy as a Service Industry Market
The EaaS market navigates a landscape marked by several hurdles. These include a degree of regulatory uncertainty across various geographical regions, potential disruptions within global supply chains that could impact the availability of critical components, and a highly competitive environment characterized by both established industry leaders and agile new entrants. These challenges can collectively contribute to project timelines extending beyond initial estimates, lead to increased project expenditures, and potentially diminish profit margins, potentially impacting overall market growth by an estimated XX% annually.
Forces Driving Energy as a Service Industry Growth
Technological advancements in renewable energy sources, increasing energy costs, and supportive government policies are accelerating EaaS adoption. For instance, the decreasing cost of solar and wind energy makes EaaS solutions even more attractive, fostering a positive feedback loop of growth and innovation. Economic benefits, including reduced upfront capital expenditure and predictable operating costs, are also significant drivers.
Long-Term Growth Catalysts in the Energy as a Service Industry
Long-term growth hinges on continuous technological innovation, strategic partnerships across the energy value chain, and expansion into new geographical markets. The development of next-generation energy storage technologies and advancements in AI-driven energy optimization will play a crucial role in further enhancing the appeal and market penetration of EaaS solutions.
Emerging Opportunities in Energy as a Service Industry
Emerging opportunities reside in underserved markets, such as microgrids and distributed energy resources, and the integration of EaaS with other smart building technologies. Increased consumer awareness of sustainability and demand for flexible energy solutions create additional growth opportunities. Expansion into developing economies also presents significant long-term market potential.
Leading Players in the Energy as a Service Industry Sector
- Honeywell International Inc
- Bernhard
- Johnson Controls International PLC
- Engie SA
- Enel SpA
- Spark Community Investment Co
- Schneider Electric SE
- Veolia Environnement SA
- Electricite de France (EDF) SA
Key Milestones in Energy as a Service Industry Industry
- March 2023: Honeywell's strategic investment in Redaptive significantly bolstered EaaS capabilities for commercial and industrial buildings, marking a pivotal moment in market expansion and technological advancement within the sector.
- April 2023: Capstone Green Energy secured an additional 3.6 MW microturbine contract, highlighting the escalating demand for EaaS solutions within the industrial sector, particularly in energy-intensive fields such as oil and gas. This milestone underscores the growing market acceptance and efficacy of the EaaS model in specialized industries.
Strategic Outlook for Energy as a Service Industry Market
The EaaS market is strategically positioned for substantial and sustained growth, propelled by ongoing technological innovations, increasingly supportive regulatory frameworks, and a noticeable evolution in consumer demand. To maintain a competitive advantage and fully harness the significant long-term growth potential of this dynamic and expanding industry, strategic alliances and dedicated investments in research and development will be paramount. A relentless focus on pioneering technological advancements and strategically expanding into new and emerging markets will be instrumental in unlocking the complete value proposition of the EaaS market.
Energy as a Service Industry Segmentation
-
1. End User
- 1.1. Commercial
- 1.2. Industrial
Energy as a Service Industry Segmentation By Geography
-
1. North America
- 1.1. United States
- 1.2. Canada
- 1.3. Rest of North America
-
2. Europe
- 2.1. Germany
- 2.2. France
- 2.3. United Kingdom
- 2.4. Rest of Europe
-
3. Asia Pacific
- 3.1. China
- 3.2. India
- 3.3. Japan
- 3.4. South Korea
- 3.5. Rest of Asia Pacific
-
4. South America
- 4.1. Brazil
- 4.2. Argentina
- 4.3. Rest of South America
-
5. Middle East and Africa
- 5.1. Saudi Arabia
- 5.2. United Arab Emirates
- 5.3. South Africa
- 5.4. Rest of Middle East and Africa
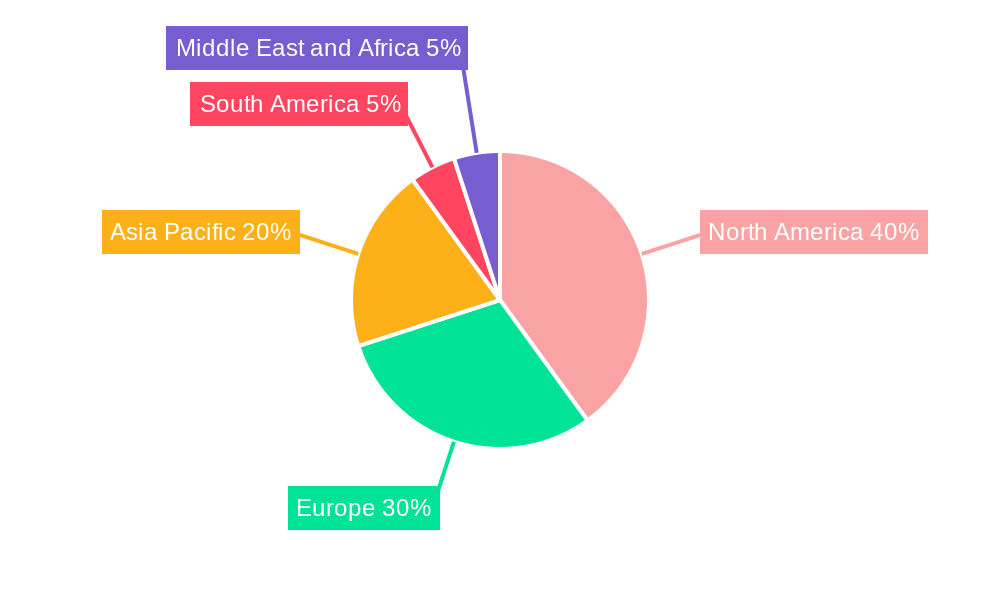
Energy as a Service Industry Regional Market Share
Geographic Coverage of Energy as a Service Industry
Energy as a Service Industry REPORT HIGHLIGHTS
| Aspects | Details |
|---|---|
| Study Period | 2020-2034 |
| Base Year | 2025 |
| Estimated Year | 2026 |
| Forecast Period | 2026-2034 |
| Historical Period | 2020-2025 |
| Growth Rate | CAGR of 12.48% from 2020-2034 |
| Segmentation |
|
Table of Contents
- 1. Introduction
- 1.1. Research Scope
- 1.2. Market Segmentation
- 1.3. Research Objective
- 1.4. Definitions and Assumptions
- 2. Executive Summary
- 2.1. Market Snapshot
- 3. Market Dynamics
- 3.1. Market Drivers
- 3.2. Market Restrains
- 3.3. Market Trends
- 3.4. Market Opportunities
- 4. Market Factor Analysis
- 4.1. Porters Five Forces
- 4.1.1. Bargaining Power of Suppliers
- 4.1.2. Bargaining Power of Buyers
- 4.1.3. Threat of New Entrants
- 4.1.4. Threat of Substitutes
- 4.1.5. Competitive Rivalry
- 4.2. PESTEL analysis
- 4.3. BCG Analysis
- 4.3.1. Stars (High Growth, High Market Share)
- 4.3.2. Cash Cows (Low Growth, High Market Share)
- 4.3.3. Question Mark (High Growth, Low Market Share)
- 4.3.4. Dogs (Low Growth, Low Market Share)
- 4.4. Ansoff Matrix Analysis
- 4.5. Supply Chain Analysis
- 4.6. Regulatory Landscape
- 4.7. Current Market Potential and Opportunity Assessment (TAM–SAM–SOM Framework)
- 4.8. MSR Analyst Note
- 4.1. Porters Five Forces
- 5. Market Analysis, Insights and Forecast 2021-2033
- 5.1. Market Analysis, Insights and Forecast - by End User
- 5.1.1. Commercial
- 5.1.2. Industrial
- 5.2. Market Analysis, Insights and Forecast - by Region
- 5.2.1. North America
- 5.2.2. Europe
- 5.2.3. Asia Pacific
- 5.2.4. South America
- 5.2.5. Middle East and Africa
- 5.1. Market Analysis, Insights and Forecast - by End User
- 6. Global Energy as a Service Industry Analysis, Insights and Forecast, 2021-2033
- 6.1. Market Analysis, Insights and Forecast - by End User
- 6.1.1. Commercial
- 6.1.2. Industrial
- 6.1. Market Analysis, Insights and Forecast - by End User
- 7. North America Energy as a Service Industry Analysis, Insights and Forecast, 2020-2032
- 7.1. Market Analysis, Insights and Forecast - by End User
- 7.1.1. Commercial
- 7.1.2. Industrial
- 7.1. Market Analysis, Insights and Forecast - by End User
- 8. Europe Energy as a Service Industry Analysis, Insights and Forecast, 2020-2032
- 8.1. Market Analysis, Insights and Forecast - by End User
- 8.1.1. Commercial
- 8.1.2. Industrial
- 8.1. Market Analysis, Insights and Forecast - by End User
- 9. Asia Pacific Energy as a Service Industry Analysis, Insights and Forecast, 2020-2032
- 9.1. Market Analysis, Insights and Forecast - by End User
- 9.1.1. Commercial
- 9.1.2. Industrial
- 9.1. Market Analysis, Insights and Forecast - by End User
- 10. South America Energy as a Service Industry Analysis, Insights and Forecast, 2020-2032
- 10.1. Market Analysis, Insights and Forecast - by End User
- 10.1.1. Commercial
- 10.1.2. Industrial
- 10.1. Market Analysis, Insights and Forecast - by End User
- 11. Middle East and Africa Energy as a Service Industry Analysis, Insights and Forecast, 2020-2032
- 11.1. Market Analysis, Insights and Forecast - by End User
- 11.1.1. Commercial
- 11.1.2. Industrial
- 11.1. Market Analysis, Insights and Forecast - by End User
- 12. Competitive Analysis
- 12.1. Company Profiles
- 12.1.1 Honeywell International Inc
- 12.1.1.1. Company Overview
- 12.1.1.2. Products
- 12.1.1.3. Company Financials
- 12.1.1.4. SWOT Analysis
- 12.1.2 Bernhard
- 12.1.2.1. Company Overview
- 12.1.2.2. Products
- 12.1.2.3. Company Financials
- 12.1.2.4. SWOT Analysis
- 12.1.3 Johnson Controls International PLC
- 12.1.3.1. Company Overview
- 12.1.3.2. Products
- 12.1.3.3. Company Financials
- 12.1.3.4. SWOT Analysis
- 12.1.4 Engie SA
- 12.1.4.1. Company Overview
- 12.1.4.2. Products
- 12.1.4.3. Company Financials
- 12.1.4.4. SWOT Analysis
- 12.1.5 Enel SpA
- 12.1.5.1. Company Overview
- 12.1.5.2. Products
- 12.1.5.3. Company Financials
- 12.1.5.4. SWOT Analysis
- 12.1.6 Spark Community Investment Co
- 12.1.6.1. Company Overview
- 12.1.6.2. Products
- 12.1.6.3. Company Financials
- 12.1.6.4. SWOT Analysis
- 12.1.7 Schneider Electric SE
- 12.1.7.1. Company Overview
- 12.1.7.2. Products
- 12.1.7.3. Company Financials
- 12.1.7.4. SWOT Analysis
- 12.1.8 Veolia Environnement SA
- 12.1.8.1. Company Overview
- 12.1.8.2. Products
- 12.1.8.3. Company Financials
- 12.1.8.4. SWOT Analysis
- 12.1.9 Electricite de France (EDF) SA
- 12.1.9.1. Company Overview
- 12.1.9.2. Products
- 12.1.9.3. Company Financials
- 12.1.9.4. SWOT Analysis
- 12.1.1 Honeywell International Inc
- 12.2. Market Entropy
- 12.2.1 Company's Key Areas Served
- 12.2.2 Recent Developments
- 12.3. Company Market Share Analysis 2025
- 12.3.1 Top 5 Companies Market Share Analysis
- 12.3.2 Top 3 Companies Market Share Analysis
- 12.4. List of Potential Customers
- 13. Research Methodology
List of Figures
- Figure 1: Global Energy as a Service Industry Revenue Breakdown (Million, %) by Region 2025 & 2033
- Figure 2: North America Energy as a Service Industry Revenue (Million), by End User 2025 & 2033
- Figure 3: North America Energy as a Service Industry Revenue Share (%), by End User 2025 & 2033
- Figure 4: North America Energy as a Service Industry Revenue (Million), by Country 2025 & 2033
- Figure 5: North America Energy as a Service Industry Revenue Share (%), by Country 2025 & 2033
- Figure 6: Europe Energy as a Service Industry Revenue (Million), by End User 2025 & 2033
- Figure 7: Europe Energy as a Service Industry Revenue Share (%), by End User 2025 & 2033
- Figure 8: Europe Energy as a Service Industry Revenue (Million), by Country 2025 & 2033
- Figure 9: Europe Energy as a Service Industry Revenue Share (%), by Country 2025 & 2033
- Figure 10: Asia Pacific Energy as a Service Industry Revenue (Million), by End User 2025 & 2033
- Figure 11: Asia Pacific Energy as a Service Industry Revenue Share (%), by End User 2025 & 2033
- Figure 12: Asia Pacific Energy as a Service Industry Revenue (Million), by Country 2025 & 2033
- Figure 13: Asia Pacific Energy as a Service Industry Revenue Share (%), by Country 2025 & 2033
- Figure 14: South America Energy as a Service Industry Revenue (Million), by End User 2025 & 2033
- Figure 15: South America Energy as a Service Industry Revenue Share (%), by End User 2025 & 2033
- Figure 16: South America Energy as a Service Industry Revenue (Million), by Country 2025 & 2033
- Figure 17: South America Energy as a Service Industry Revenue Share (%), by Country 2025 & 2033
- Figure 18: Middle East and Africa Energy as a Service Industry Revenue (Million), by End User 2025 & 2033
- Figure 19: Middle East and Africa Energy as a Service Industry Revenue Share (%), by End User 2025 & 2033
- Figure 20: Middle East and Africa Energy as a Service Industry Revenue (Million), by Country 2025 & 2033
- Figure 21: Middle East and Africa Energy as a Service Industry Revenue Share (%), by Country 2025 & 2033
List of Tables
- Table 1: Global Energy as a Service Industry Revenue Million Forecast, by End User 2020 & 2033
- Table 2: Global Energy as a Service Industry Revenue Million Forecast, by Region 2020 & 2033
- Table 3: Global Energy as a Service Industry Revenue Million Forecast, by End User 2020 & 2033
- Table 4: Global Energy as a Service Industry Revenue Million Forecast, by Country 2020 & 2033
- Table 5: United States Energy as a Service Industry Revenue (Million) Forecast, by Application 2020 & 2033
- Table 6: Canada Energy as a Service Industry Revenue (Million) Forecast, by Application 2020 & 2033
- Table 7: Rest of North America Energy as a Service Industry Revenue (Million) Forecast, by Application 2020 & 2033
- Table 8: Global Energy as a Service Industry Revenue Million Forecast, by End User 2020 & 2033
- Table 9: Global Energy as a Service Industry Revenue Million Forecast, by Country 2020 & 2033
- Table 10: Germany Energy as a Service Industry Revenue (Million) Forecast, by Application 2020 & 2033
- Table 11: France Energy as a Service Industry Revenue (Million) Forecast, by Application 2020 & 2033
- Table 12: United Kingdom Energy as a Service Industry Revenue (Million) Forecast, by Application 2020 & 2033
- Table 13: Rest of Europe Energy as a Service Industry Revenue (Million) Forecast, by Application 2020 & 2033
- Table 14: Global Energy as a Service Industry Revenue Million Forecast, by End User 2020 & 2033
- Table 15: Global Energy as a Service Industry Revenue Million Forecast, by Country 2020 & 2033
- Table 16: China Energy as a Service Industry Revenue (Million) Forecast, by Application 2020 & 2033
- Table 17: India Energy as a Service Industry Revenue (Million) Forecast, by Application 2020 & 2033
- Table 18: Japan Energy as a Service Industry Revenue (Million) Forecast, by Application 2020 & 2033
- Table 19: South Korea Energy as a Service Industry Revenue (Million) Forecast, by Application 2020 & 2033
- Table 20: Rest of Asia Pacific Energy as a Service Industry Revenue (Million) Forecast, by Application 2020 & 2033
- Table 21: Global Energy as a Service Industry Revenue Million Forecast, by End User 2020 & 2033
- Table 22: Global Energy as a Service Industry Revenue Million Forecast, by Country 2020 & 2033
- Table 23: Brazil Energy as a Service Industry Revenue (Million) Forecast, by Application 2020 & 2033
- Table 24: Argentina Energy as a Service Industry Revenue (Million) Forecast, by Application 2020 & 2033
- Table 25: Rest of South America Energy as a Service Industry Revenue (Million) Forecast, by Application 2020 & 2033
- Table 26: Global Energy as a Service Industry Revenue Million Forecast, by End User 2020 & 2033
- Table 27: Global Energy as a Service Industry Revenue Million Forecast, by Country 2020 & 2033
- Table 28: Saudi Arabia Energy as a Service Industry Revenue (Million) Forecast, by Application 2020 & 2033
- Table 29: United Arab Emirates Energy as a Service Industry Revenue (Million) Forecast, by Application 2020 & 2033
- Table 30: South Africa Energy as a Service Industry Revenue (Million) Forecast, by Application 2020 & 2033
- Table 31: Rest of Middle East and Africa Energy as a Service Industry Revenue (Million) Forecast, by Application 2020 & 2033
Frequently Asked Questions
1. What is the projected Compound Annual Growth Rate (CAGR) of the Energy as a Service Industry?
The projected CAGR is approximately 12.48%.
2. Which companies are prominent players in the Energy as a Service Industry?
Key companies in the market include Honeywell International Inc, Bernhard, Johnson Controls International PLC, Engie SA, Enel SpA, Spark Community Investment Co, Schneider Electric SE, Veolia Environnement SA, Electricite de France (EDF) SA.
3. What are the main segments of the Energy as a Service Industry?
The market segments include End User.
4. Can you provide details about the market size?
The market size is estimated to be USD 94.16 Million as of 2022.
5. What are some drivers contributing to market growth?
4.; Growing Demand for Energy As A Service4.; Increasing Adoption of Distributed Energy Generation in Commercial and Industrial Sectors.
6. What are the notable trends driving market growth?
Commercial Segment to Dominate the Market.
7. Are there any restraints impacting market growth?
4.; Lack of Awareness in Developing Economies and High Technological Costs.
8. Can you provide examples of recent developments in the market?
April 2023: Capstone Green Energy Corporation announced that its southern U.S. distributor, Lone Star Power Solutions, contracted with a large West Texas energy company to deliver an additional C800S Signature Series microturbine following Energy-as-a-Service (EaaS) for 3.6 MW contract earlier this year.
9. What pricing options are available for accessing the report?
Pricing options include single-user, multi-user, and enterprise licenses priced at USD 4750, USD 5250, and USD 8750 respectively.
10. Is the market size provided in terms of value or volume?
The market size is provided in terms of value, measured in Million.
11. Are there any specific market keywords associated with the report?
Yes, the market keyword associated with the report is "Energy as a Service Industry," which aids in identifying and referencing the specific market segment covered.
12. How do I determine which pricing option suits my needs best?
The pricing options vary based on user requirements and access needs. Individual users may opt for single-user licenses, while businesses requiring broader access may choose multi-user or enterprise licenses for cost-effective access to the report.
13. Are there any additional resources or data provided in the Energy as a Service Industry report?
While the report offers comprehensive insights, it's advisable to review the specific contents or supplementary materials provided to ascertain if additional resources or data are available.
14. How can I stay updated on further developments or reports in the Energy as a Service Industry?
To stay informed about further developments, trends, and reports in the Energy as a Service Industry, consider subscribing to industry newsletters, following relevant companies and organizations, or regularly checking reputable industry news sources and publications.
Methodology
Step 1 - Identification of Relevant Samples Size from Population Database


Step 2 - Approaches for Defining Global Market Size (Value, Volume* & Price*)

Note*: In applicable scenarios
Step 3 - Data Sources
Primary Research
- Web Analytics
- Survey Reports
- Research Institute
- Latest Research Reports
- Opinion Leaders
Secondary Research
- Annual Reports
- White Paper
- Latest Press Release
- Industry Association
- Paid Database
- Investor Presentations

Step 4 - Data Triangulation
Involves using different sources of information in order to increase the validity of a study
These sources are likely to be stakeholders in a program - participants, other researchers, program staff, other community members, and so on.
Then we put all data in single framework & apply various statistical tools to find out the dynamic on the market.
During the analysis stage, feedback from the stakeholder groups would be compared to determine areas of agreement as well as areas of divergence