

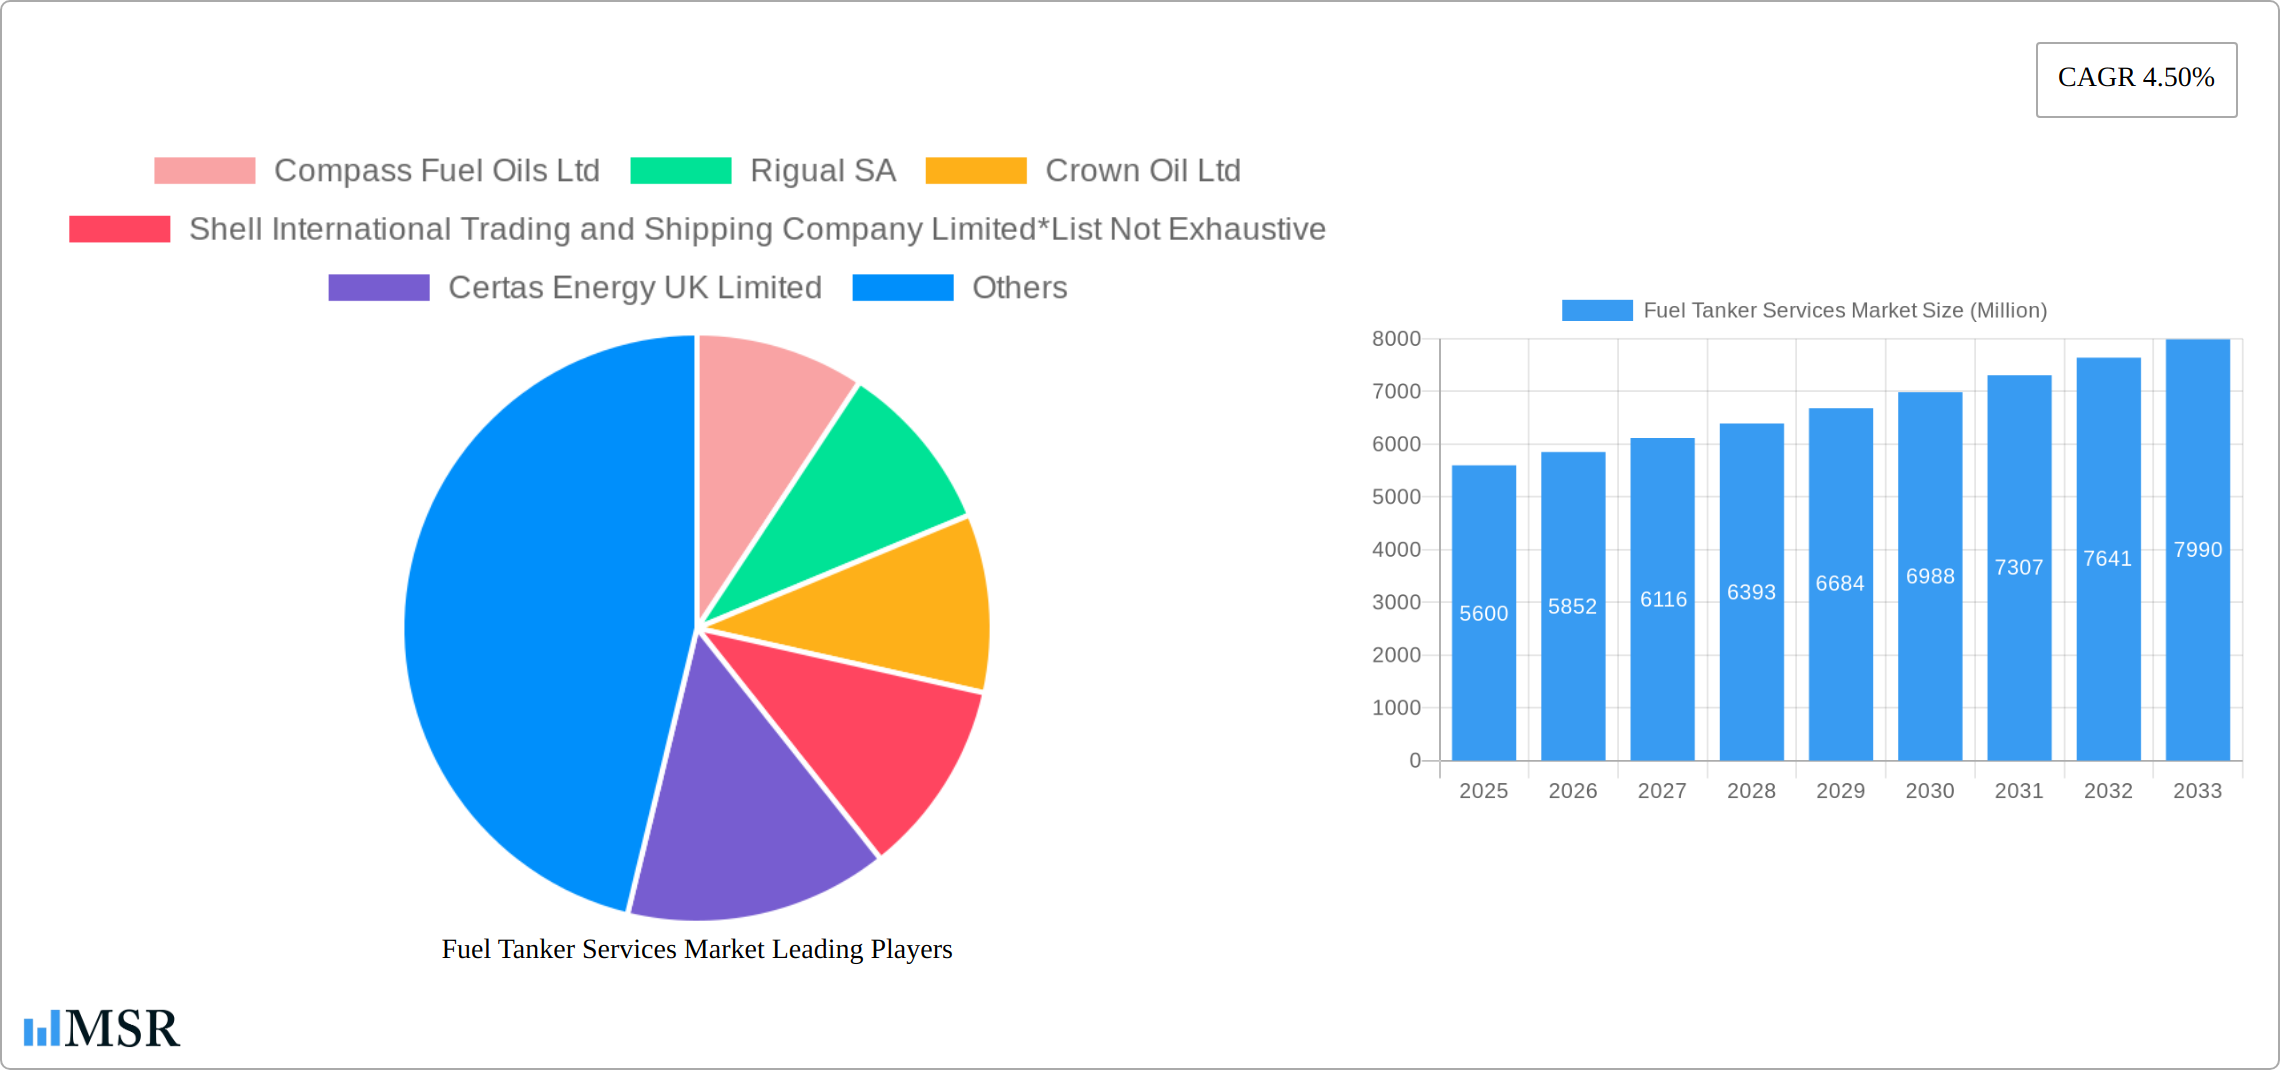
Key Insights
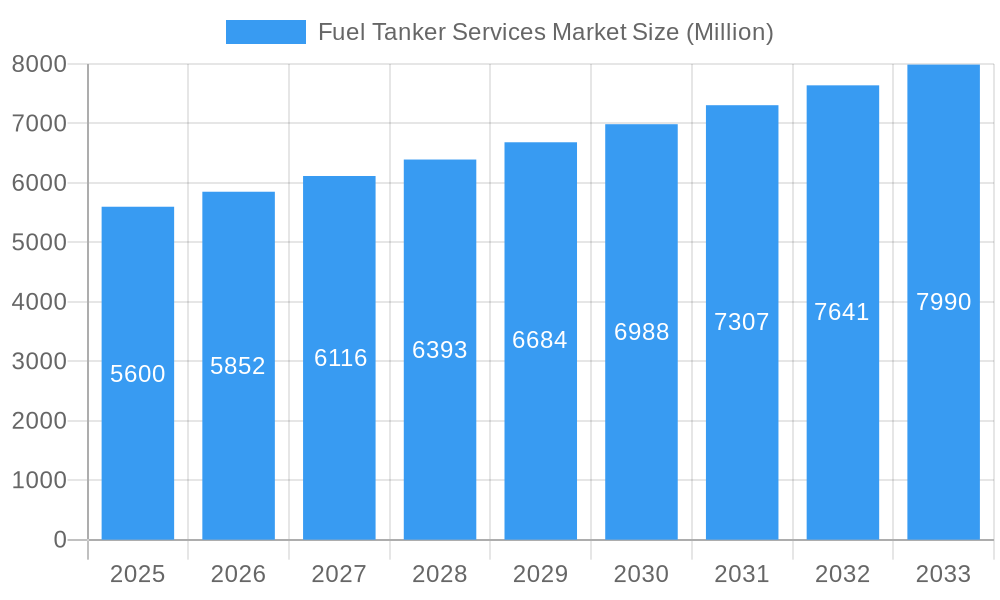
The global Fuel Tanker Services market, valued at $5.60 billion in 2025, is projected to experience robust growth, driven by increasing global fuel demand, expanding infrastructure projects, and the rise of e-commerce and related logistics needs. A compound annual growth rate (CAGR) of 4.50% from 2025 to 2033 signifies a significant market expansion. Key growth drivers include the burgeoning energy sector, particularly in developing economies experiencing rapid industrialization. The increasing adoption of LNG as a cleaner fuel source further fuels market expansion, particularly within the maritime and heavy transportation segments. Market segmentation reveals considerable potential across various capacity categories, fuel types, and operator types. Retail petrol companies dominate the operator segment, although refineries and other specialized operators are also significant contributors. Material type preferences largely depend on fuel type and regulatory requirements, with carbon steel, stainless steel, and aluminum alloys finding widespread application. Geographic distribution shows strong market concentration in North America and Europe, driven by established economies and extensive transportation networks. However, the Asia-Pacific region is expected to witness the fastest growth due to rapid urbanization and industrialization. Market restraints include stringent environmental regulations, fluctuating fuel prices, and potential disruptions in global supply chains.
Fuel Tanker Services Market Market Size (In Billion)
The competitive landscape is moderately consolidated, with key players such as Compass Fuel Oils Ltd, Rigual SA, Crown Oil Ltd, Shell International Trading and Shipping Company Limited, and Certas Energy UK Limited holding substantial market share. However, the market also exhibits considerable opportunities for smaller, specialized service providers. Future growth hinges on technological advancements in fuel tanker design, improved logistics efficiency, and investments in sustainable transport solutions. The projected growth underscores the need for industry players to adapt to evolving regulatory landscapes and optimize operational strategies to navigate the challenges and fully leverage the potential for growth within this dynamic market. The market's robust growth trajectory is expected to continue, supported by long-term trends in global energy consumption and infrastructure development.
Fuel Tanker Services Market Company Market Share
Fuel Tanker Services Market: A Comprehensive Report (2019-2033)
This insightful report provides a detailed analysis of the Fuel Tanker Services Market, offering a comprehensive overview of market dynamics, key segments, leading players, and future growth prospects. With a study period spanning 2019-2033, a base year of 2025, and a forecast period of 2025-2033, this report is an essential resource for industry stakeholders, investors, and strategic decision-makers. The report covers key segments including capacity (Below 20000 Liters, 30000-40000 Liters, Above 40000 Liters), fuel type (Petrol, LNG, Other Fuels), operator (Retail Petrol Companies, Refineries), and material type (Carbon Steel, Stainless Steel, Aluminum Alloy). Leading companies such as Compass Fuel Oils Ltd, Rigual SA, Crown Oil Ltd, Shell International Trading and Shipping Company Limited, and Certas Energy UK Limited are profiled, providing a comprehensive competitive landscape analysis. The report's detailed market sizing and CAGR projections offer invaluable insights into the trajectory of this dynamic sector.
Fuel Tanker Services Market Market Concentration & Dynamics
The Fuel Tanker Services Market presents a moderately concentrated landscape, dominated by a few key players commanding substantial market share. However, a significant number of smaller, regional operators also contribute to the market's vibrancy. Our analysis reveals that the top five players collectively control approximately [Insert Specific Percentage]% of the total market revenue (2025 estimate). Market innovation is fueled by advancements in materials science (e.g., lighter, high-strength alloys for enhanced fuel efficiency), sophisticated telematics for optimized fleet management, and the burgeoning adoption of alternative fuels like LNG and biofuels. The regulatory environment, particularly concerning safety, emissions, and hazardous materials transportation, profoundly impacts market operations and necessitates ongoing compliance efforts. Substitute transportation methods, such as pipelines and rail, exert competitive pressure, especially for long-haul transportation. Furthermore, end-user demand for sustainability and efficient logistics is driving the adoption of larger-capacity, technologically advanced tankers equipped with features like improved fuel efficiency and reduced emissions. Mergers and acquisitions (M&A) activity within the sector has been moderate in recent years, with an estimated [Insert Specific Number] M&A deals finalized between 2019 and 2024.
- Market Share (2025 Estimate): Top 5 players: [Insert Specific Percentage]%
- M&A Deal Count (2019-2024): [Insert Specific Number]
Fuel Tanker Services Market Industry Insights & Trends
The Fuel Tanker Services Market is poised for robust growth throughout the forecast period (2025-2033), propelled by several key factors. The market size in 2025 is estimated at $[Insert Specific Dollar Amount] Million, with a projected Compound Annual Growth Rate (CAGR) of [Insert Specific Percentage]% from 2025 to 2033. This growth is fueled by the increasing global energy demand, particularly in rapidly developing economies, which directly stimulates the fuel transportation sector. The expansion of global trade and industrial activities necessitates efficient and reliable fuel delivery systems, further bolstering demand for fuel tanker services. Technological advancements, encompassing improved tanker designs, fuel-efficient engines, and cutting-edge tracking systems, enhance operational efficiency and contribute to cost reductions. Evolving consumer preferences, notably a growing preference for cleaner fuels and sustainable transportation solutions, are driving the adoption of LNG tankers and stimulating the development of greener technologies within the industry. The intensifying focus on environmental regulations and the increasing adoption of sustainable practices within the logistics sector are also significant growth drivers. The ongoing transition towards cleaner fuel sources such as LNG and biofuels, coupled with stringent environmental regulations, is reshaping the market landscape and demanding adaptability from market participants.
Key Markets & Segments Leading Fuel Tanker Services Market
The Fuel Tanker Services Market shows strong regional concentration in [Insert Dominant Region/Country]. This dominance is attributed to factors including:
- Drivers in [Dominant Region/Country]:
- Robust economic growth leading to increased energy demand.
- Extensive road and rail infrastructure facilitating efficient transportation.
- High levels of industrial activity and manufacturing.
Segment Analysis:
- Capacity: The segment of fuel tankers with capacity above 40,000 Liters dominates the market due to its higher efficiency in long-haul transportation. The "Below 20000 Liters" segment is primarily driven by regional and local deliveries.
- Fuel Type: Petrol remains the most dominant fuel type, although LNG is showing substantial growth due to environmental concerns and government incentives.
- Operator: Refineries and large-scale fuel distributors represent the most significant portion of the operator segment due to their volume of fuel transportation requirements.
- Material Type: Carbon Steel continues to dominate as the primary material for fuel tankers, owing to its cost-effectiveness. However, Stainless Steel and Aluminum Alloy are witnessing increased usage in specialized applications requiring higher corrosion resistance and lighter weight, respectively.
Fuel Tanker Services Market Product Developments
Recent product innovations focus on enhancing safety, efficiency, and environmental performance. Advancements include the development of lighter and stronger materials for fuel tankers, improved telematics systems for real-time tracking and monitoring, and the introduction of LNG-compatible tankers. These innovations offer operators cost savings, enhanced safety features, and improved operational efficiency, contributing to a competitive advantage in the market.
Challenges in the Fuel Tanker Services Market Market
The Fuel Tanker Services Market faces several challenges including stringent safety and environmental regulations increasing operational costs. Supply chain disruptions, particularly in the procurement of specialized materials and components, impact production and delivery timelines. Intense competition from other modes of fuel transportation, such as pipelines and rail, limits pricing power and profit margins. These factors collectively reduce market attractiveness and limit growth potential. The fluctuating prices of raw materials, particularly steel, pose a significant challenge to the industry's profitability.
Forces Driving Fuel Tanker Services Market Growth
The market is propelled by increasing global energy consumption, particularly in emerging economies. Government initiatives promoting infrastructure development and efficient logistics enhance market prospects. Technological advancements in fuel tanker design, materials, and telematics systems optimize operational efficiency. The shift toward sustainable transportation solutions and the growing adoption of LNG as a fuel source also represent significant growth drivers.
Challenges in the Fuel Tanker Services Market Market
Long-term growth will be significantly influenced by strategic partnerships fostering innovation and expanding into new markets. The development of new technologies, such as autonomous driving systems and advanced materials, will enhance operational efficiency and reduce costs, further driving growth. The increasing adoption of cleaner fuels will also reshape the market landscape, creating opportunities for businesses adapting to this trend.
Emerging Opportunities in Fuel Tanker Services Market
The burgeoning demand for LNG transportation presents significant opportunities. Expansion into new markets with growing energy needs offers substantial growth potential. The adoption of digital technologies and advanced analytics for fleet management presents opportunities to enhance efficiency and optimize operations. A focus on sustainability and the integration of green technologies in fuel tanker operations will attract environmentally conscious clients.
Leading Players in the Fuel Tanker Services Market Sector
- Compass Fuel Oils Ltd
- Rigual SA
- Crown Oil Ltd
- Shell International Trading and Shipping Company Limited
- Certas Energy UK Limited
Key Milestones in Fuel Tanker Services Market Industry
- January 2024: Compass Fuel Oils Ltd announced the acquisition of a new Arctic fuel tanker, expanding its capacity and enhancing its cold-climate operational capabilities.
- December 2023: ReFuels commenced construction of a new CNG refueling facility, contributing to the growth of sustainable transportation solutions.
Strategic Outlook for Fuel Tanker Services Market Market
The Fuel Tanker Services Market holds significant future potential, driven by sustained global energy demand and ongoing technological advancements. Strategic partnerships, technological innovation, and expansion into new markets will be crucial for businesses to capitalize on emerging opportunities and maintain a competitive edge. The market is poised for significant growth, presenting attractive investment prospects for players who can adapt to evolving market dynamics and effectively address challenges.
Fuel Tanker Services Market Segmentation
-
1. Material Type
- 1.1. Carbon Steel
- 1.2. Stainless Steel
- 1.3. Aluminum Alloy
-
2. Capacity
- 2.1. Below 20000 Liters
- 2.2. 30000 - 40000 Liters
- 2.3. Above 40000 Liters
-
3. Fuel Type
- 3.1. Petrol
- 3.2. LNG
- 3.3. Other Fuels
-
4. Operator
- 4.1. Retail Petrol Companies
- 4.2. Refineries
Fuel Tanker Services Market Segmentation By Geography
-
1. North America
- 1.1. United States
- 1.2. Canada
- 1.3. Rest of North America
-
2. Europe
- 2.1. Germany
- 2.2. France
- 2.3. United Kingdom
- 2.4. Italy
- 2.5. Spain
- 2.6. NORDIC
- 2.7. Russia
- 2.8. Rest of Europe
-
3. Asia Pacific
- 3.1. China
- 3.2. India
- 3.3. Australia
- 3.4. Malaysia
- 3.5. Indonesia
- 3.6. Thailand
- 3.7. Vietnam
- 3.8. Rest of Asia Pacific
-
4. Middle East and Africa
- 4.1. Saudi Arabia
- 4.2. United Arab Emirates
- 4.3. South Africa
- 4.4. Nigeria
- 4.5. Rest of Middle East and Africa
- 4.6. Egypt
-
5. South America
- 5.1. Brazil
- 5.2. Argentina
- 5.3. Colombia
- 5.4. Rest of South America
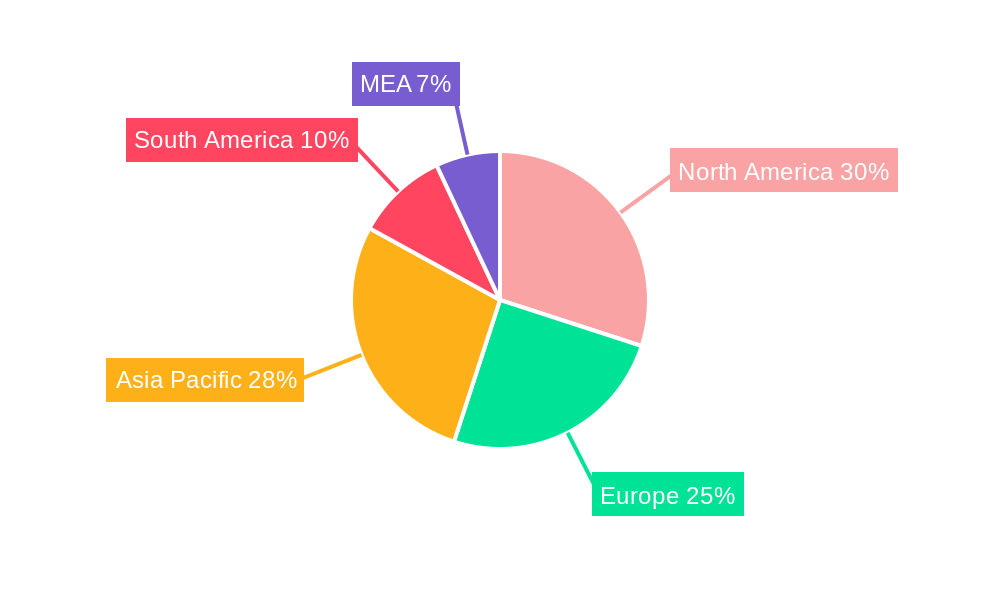
Fuel Tanker Services Market Regional Market Share
Geographic Coverage of Fuel Tanker Services Market
Fuel Tanker Services Market REPORT HIGHLIGHTS
| Aspects | Details |
|---|---|
| Study Period | 2020-2034 |
| Base Year | 2025 |
| Estimated Year | 2026 |
| Forecast Period | 2026-2034 |
| Historical Period | 2020-2025 |
| Growth Rate | CAGR of 4.50% from 2020-2034 |
| Segmentation |
|
Table of Contents
- 1. Introduction
- 1.1. Research Scope
- 1.2. Market Segmentation
- 1.3. Research Objective
- 1.4. Definitions and Assumptions
- 2. Executive Summary
- 2.1. Market Snapshot
- 3. Market Dynamics
- 3.1. Market Drivers
- 3.2. Market Restrains
- 3.3. Market Trends
- 3.4. Market Opportunities
- 4. Market Factor Analysis
- 4.1. Porters Five Forces
- 4.1.1. Bargaining Power of Suppliers
- 4.1.2. Bargaining Power of Buyers
- 4.1.3. Threat of New Entrants
- 4.1.4. Threat of Substitutes
- 4.1.5. Competitive Rivalry
- 4.2. PESTEL analysis
- 4.3. BCG Analysis
- 4.3.1. Stars (High Growth, High Market Share)
- 4.3.2. Cash Cows (Low Growth, High Market Share)
- 4.3.3. Question Mark (High Growth, Low Market Share)
- 4.3.4. Dogs (Low Growth, Low Market Share)
- 4.4. Ansoff Matrix Analysis
- 4.5. Supply Chain Analysis
- 4.6. Regulatory Landscape
- 4.7. Current Market Potential and Opportunity Assessment (TAM–SAM–SOM Framework)
- 4.8. MSR Analyst Note
- 4.1. Porters Five Forces
- 5. Market Analysis, Insights and Forecast 2021-2033
- 5.1. Market Analysis, Insights and Forecast - by Material Type
- 5.1.1. Carbon Steel
- 5.1.2. Stainless Steel
- 5.1.3. Aluminum Alloy
- 5.2. Market Analysis, Insights and Forecast - by Capacity
- 5.2.1. Below 20000 Liters
- 5.2.2. 30000 - 40000 Liters
- 5.2.3. Above 40000 Liters
- 5.3. Market Analysis, Insights and Forecast - by Fuel Type
- 5.3.1. Petrol
- 5.3.2. LNG
- 5.3.3. Other Fuels
- 5.4. Market Analysis, Insights and Forecast - by Operator
- 5.4.1. Retail Petrol Companies
- 5.4.2. Refineries
- 5.5. Market Analysis, Insights and Forecast - by Region
- 5.5.1. North America
- 5.5.2. Europe
- 5.5.3. Asia Pacific
- 5.5.4. Middle East and Africa
- 5.5.5. South America
- 5.1. Market Analysis, Insights and Forecast - by Material Type
- 6. Global Fuel Tanker Services Market Analysis, Insights and Forecast, 2021-2033
- 6.1. Market Analysis, Insights and Forecast - by Material Type
- 6.1.1. Carbon Steel
- 6.1.2. Stainless Steel
- 6.1.3. Aluminum Alloy
- 6.2. Market Analysis, Insights and Forecast - by Capacity
- 6.2.1. Below 20000 Liters
- 6.2.2. 30000 - 40000 Liters
- 6.2.3. Above 40000 Liters
- 6.3. Market Analysis, Insights and Forecast - by Fuel Type
- 6.3.1. Petrol
- 6.3.2. LNG
- 6.3.3. Other Fuels
- 6.4. Market Analysis, Insights and Forecast - by Operator
- 6.4.1. Retail Petrol Companies
- 6.4.2. Refineries
- 6.1. Market Analysis, Insights and Forecast - by Material Type
- 7. North America Fuel Tanker Services Market Analysis, Insights and Forecast, 2020-2032
- 7.1. Market Analysis, Insights and Forecast - by Material Type
- 7.1.1. Carbon Steel
- 7.1.2. Stainless Steel
- 7.1.3. Aluminum Alloy
- 7.2. Market Analysis, Insights and Forecast - by Capacity
- 7.2.1. Below 20000 Liters
- 7.2.2. 30000 - 40000 Liters
- 7.2.3. Above 40000 Liters
- 7.3. Market Analysis, Insights and Forecast - by Fuel Type
- 7.3.1. Petrol
- 7.3.2. LNG
- 7.3.3. Other Fuels
- 7.4. Market Analysis, Insights and Forecast - by Operator
- 7.4.1. Retail Petrol Companies
- 7.4.2. Refineries
- 7.1. Market Analysis, Insights and Forecast - by Material Type
- 8. Europe Fuel Tanker Services Market Analysis, Insights and Forecast, 2020-2032
- 8.1. Market Analysis, Insights and Forecast - by Material Type
- 8.1.1. Carbon Steel
- 8.1.2. Stainless Steel
- 8.1.3. Aluminum Alloy
- 8.2. Market Analysis, Insights and Forecast - by Capacity
- 8.2.1. Below 20000 Liters
- 8.2.2. 30000 - 40000 Liters
- 8.2.3. Above 40000 Liters
- 8.3. Market Analysis, Insights and Forecast - by Fuel Type
- 8.3.1. Petrol
- 8.3.2. LNG
- 8.3.3. Other Fuels
- 8.4. Market Analysis, Insights and Forecast - by Operator
- 8.4.1. Retail Petrol Companies
- 8.4.2. Refineries
- 8.1. Market Analysis, Insights and Forecast - by Material Type
- 9. Asia Pacific Fuel Tanker Services Market Analysis, Insights and Forecast, 2020-2032
- 9.1. Market Analysis, Insights and Forecast - by Material Type
- 9.1.1. Carbon Steel
- 9.1.2. Stainless Steel
- 9.1.3. Aluminum Alloy
- 9.2. Market Analysis, Insights and Forecast - by Capacity
- 9.2.1. Below 20000 Liters
- 9.2.2. 30000 - 40000 Liters
- 9.2.3. Above 40000 Liters
- 9.3. Market Analysis, Insights and Forecast - by Fuel Type
- 9.3.1. Petrol
- 9.3.2. LNG
- 9.3.3. Other Fuels
- 9.4. Market Analysis, Insights and Forecast - by Operator
- 9.4.1. Retail Petrol Companies
- 9.4.2. Refineries
- 9.1. Market Analysis, Insights and Forecast - by Material Type
- 10. Middle East and Africa Fuel Tanker Services Market Analysis, Insights and Forecast, 2020-2032
- 10.1. Market Analysis, Insights and Forecast - by Material Type
- 10.1.1. Carbon Steel
- 10.1.2. Stainless Steel
- 10.1.3. Aluminum Alloy
- 10.2. Market Analysis, Insights and Forecast - by Capacity
- 10.2.1. Below 20000 Liters
- 10.2.2. 30000 - 40000 Liters
- 10.2.3. Above 40000 Liters
- 10.3. Market Analysis, Insights and Forecast - by Fuel Type
- 10.3.1. Petrol
- 10.3.2. LNG
- 10.3.3. Other Fuels
- 10.4. Market Analysis, Insights and Forecast - by Operator
- 10.4.1. Retail Petrol Companies
- 10.4.2. Refineries
- 10.1. Market Analysis, Insights and Forecast - by Material Type
- 11. South America Fuel Tanker Services Market Analysis, Insights and Forecast, 2020-2032
- 11.1. Market Analysis, Insights and Forecast - by Material Type
- 11.1.1. Carbon Steel
- 11.1.2. Stainless Steel
- 11.1.3. Aluminum Alloy
- 11.2. Market Analysis, Insights and Forecast - by Capacity
- 11.2.1. Below 20000 Liters
- 11.2.2. 30000 - 40000 Liters
- 11.2.3. Above 40000 Liters
- 11.3. Market Analysis, Insights and Forecast - by Fuel Type
- 11.3.1. Petrol
- 11.3.2. LNG
- 11.3.3. Other Fuels
- 11.4. Market Analysis, Insights and Forecast - by Operator
- 11.4.1. Retail Petrol Companies
- 11.4.2. Refineries
- 11.1. Market Analysis, Insights and Forecast - by Material Type
- 12. Competitive Analysis
- 12.1. Company Profiles
- 12.1.1 Compass Fuel Oils Ltd
- 12.1.1.1. Company Overview
- 12.1.1.2. Products
- 12.1.1.3. Company Financials
- 12.1.1.4. SWOT Analysis
- 12.1.2 Rigual SA
- 12.1.2.1. Company Overview
- 12.1.2.2. Products
- 12.1.2.3. Company Financials
- 12.1.2.4. SWOT Analysis
- 12.1.3 Crown Oil Ltd
- 12.1.3.1. Company Overview
- 12.1.3.2. Products
- 12.1.3.3. Company Financials
- 12.1.3.4. SWOT Analysis
- 12.1.4 Shell International Trading and Shipping Company Limited*List Not Exhaustive
- 12.1.4.1. Company Overview
- 12.1.4.2. Products
- 12.1.4.3. Company Financials
- 12.1.4.4. SWOT Analysis
- 12.1.5 Certas Energy UK Limited
- 12.1.5.1. Company Overview
- 12.1.5.2. Products
- 12.1.5.3. Company Financials
- 12.1.5.4. SWOT Analysis
- 12.1.1 Compass Fuel Oils Ltd
- 12.2. Market Entropy
- 12.2.1 Company's Key Areas Served
- 12.2.2 Recent Developments
- 12.3. Company Market Share Analysis 2025
- 12.3.1 Top 5 Companies Market Share Analysis
- 12.3.2 Top 3 Companies Market Share Analysis
- 12.4. List of Potential Customers
- 13. Research Methodology
List of Figures
- Figure 1: Global Fuel Tanker Services Market Revenue Breakdown (Million, %) by Region 2025 & 2033
- Figure 2: North America Fuel Tanker Services Market Revenue (Million), by Material Type 2025 & 2033
- Figure 3: North America Fuel Tanker Services Market Revenue Share (%), by Material Type 2025 & 2033
- Figure 4: North America Fuel Tanker Services Market Revenue (Million), by Capacity 2025 & 2033
- Figure 5: North America Fuel Tanker Services Market Revenue Share (%), by Capacity 2025 & 2033
- Figure 6: North America Fuel Tanker Services Market Revenue (Million), by Fuel Type 2025 & 2033
- Figure 7: North America Fuel Tanker Services Market Revenue Share (%), by Fuel Type 2025 & 2033
- Figure 8: North America Fuel Tanker Services Market Revenue (Million), by Operator 2025 & 2033
- Figure 9: North America Fuel Tanker Services Market Revenue Share (%), by Operator 2025 & 2033
- Figure 10: North America Fuel Tanker Services Market Revenue (Million), by Country 2025 & 2033
- Figure 11: North America Fuel Tanker Services Market Revenue Share (%), by Country 2025 & 2033
- Figure 12: Europe Fuel Tanker Services Market Revenue (Million), by Material Type 2025 & 2033
- Figure 13: Europe Fuel Tanker Services Market Revenue Share (%), by Material Type 2025 & 2033
- Figure 14: Europe Fuel Tanker Services Market Revenue (Million), by Capacity 2025 & 2033
- Figure 15: Europe Fuel Tanker Services Market Revenue Share (%), by Capacity 2025 & 2033
- Figure 16: Europe Fuel Tanker Services Market Revenue (Million), by Fuel Type 2025 & 2033
- Figure 17: Europe Fuel Tanker Services Market Revenue Share (%), by Fuel Type 2025 & 2033
- Figure 18: Europe Fuel Tanker Services Market Revenue (Million), by Operator 2025 & 2033
- Figure 19: Europe Fuel Tanker Services Market Revenue Share (%), by Operator 2025 & 2033
- Figure 20: Europe Fuel Tanker Services Market Revenue (Million), by Country 2025 & 2033
- Figure 21: Europe Fuel Tanker Services Market Revenue Share (%), by Country 2025 & 2033
- Figure 22: Asia Pacific Fuel Tanker Services Market Revenue (Million), by Material Type 2025 & 2033
- Figure 23: Asia Pacific Fuel Tanker Services Market Revenue Share (%), by Material Type 2025 & 2033
- Figure 24: Asia Pacific Fuel Tanker Services Market Revenue (Million), by Capacity 2025 & 2033
- Figure 25: Asia Pacific Fuel Tanker Services Market Revenue Share (%), by Capacity 2025 & 2033
- Figure 26: Asia Pacific Fuel Tanker Services Market Revenue (Million), by Fuel Type 2025 & 2033
- Figure 27: Asia Pacific Fuel Tanker Services Market Revenue Share (%), by Fuel Type 2025 & 2033
- Figure 28: Asia Pacific Fuel Tanker Services Market Revenue (Million), by Operator 2025 & 2033
- Figure 29: Asia Pacific Fuel Tanker Services Market Revenue Share (%), by Operator 2025 & 2033
- Figure 30: Asia Pacific Fuel Tanker Services Market Revenue (Million), by Country 2025 & 2033
- Figure 31: Asia Pacific Fuel Tanker Services Market Revenue Share (%), by Country 2025 & 2033
- Figure 32: Middle East and Africa Fuel Tanker Services Market Revenue (Million), by Material Type 2025 & 2033
- Figure 33: Middle East and Africa Fuel Tanker Services Market Revenue Share (%), by Material Type 2025 & 2033
- Figure 34: Middle East and Africa Fuel Tanker Services Market Revenue (Million), by Capacity 2025 & 2033
- Figure 35: Middle East and Africa Fuel Tanker Services Market Revenue Share (%), by Capacity 2025 & 2033
- Figure 36: Middle East and Africa Fuel Tanker Services Market Revenue (Million), by Fuel Type 2025 & 2033
- Figure 37: Middle East and Africa Fuel Tanker Services Market Revenue Share (%), by Fuel Type 2025 & 2033
- Figure 38: Middle East and Africa Fuel Tanker Services Market Revenue (Million), by Operator 2025 & 2033
- Figure 39: Middle East and Africa Fuel Tanker Services Market Revenue Share (%), by Operator 2025 & 2033
- Figure 40: Middle East and Africa Fuel Tanker Services Market Revenue (Million), by Country 2025 & 2033
- Figure 41: Middle East and Africa Fuel Tanker Services Market Revenue Share (%), by Country 2025 & 2033
- Figure 42: South America Fuel Tanker Services Market Revenue (Million), by Material Type 2025 & 2033
- Figure 43: South America Fuel Tanker Services Market Revenue Share (%), by Material Type 2025 & 2033
- Figure 44: South America Fuel Tanker Services Market Revenue (Million), by Capacity 2025 & 2033
- Figure 45: South America Fuel Tanker Services Market Revenue Share (%), by Capacity 2025 & 2033
- Figure 46: South America Fuel Tanker Services Market Revenue (Million), by Fuel Type 2025 & 2033
- Figure 47: South America Fuel Tanker Services Market Revenue Share (%), by Fuel Type 2025 & 2033
- Figure 48: South America Fuel Tanker Services Market Revenue (Million), by Operator 2025 & 2033
- Figure 49: South America Fuel Tanker Services Market Revenue Share (%), by Operator 2025 & 2033
- Figure 50: South America Fuel Tanker Services Market Revenue (Million), by Country 2025 & 2033
- Figure 51: South America Fuel Tanker Services Market Revenue Share (%), by Country 2025 & 2033
List of Tables
- Table 1: Global Fuel Tanker Services Market Revenue Million Forecast, by Material Type 2020 & 2033
- Table 2: Global Fuel Tanker Services Market Revenue Million Forecast, by Capacity 2020 & 2033
- Table 3: Global Fuel Tanker Services Market Revenue Million Forecast, by Fuel Type 2020 & 2033
- Table 4: Global Fuel Tanker Services Market Revenue Million Forecast, by Operator 2020 & 2033
- Table 5: Global Fuel Tanker Services Market Revenue Million Forecast, by Region 2020 & 2033
- Table 6: Global Fuel Tanker Services Market Revenue Million Forecast, by Material Type 2020 & 2033
- Table 7: Global Fuel Tanker Services Market Revenue Million Forecast, by Capacity 2020 & 2033
- Table 8: Global Fuel Tanker Services Market Revenue Million Forecast, by Fuel Type 2020 & 2033
- Table 9: Global Fuel Tanker Services Market Revenue Million Forecast, by Operator 2020 & 2033
- Table 10: Global Fuel Tanker Services Market Revenue Million Forecast, by Country 2020 & 2033
- Table 11: United States Fuel Tanker Services Market Revenue (Million) Forecast, by Application 2020 & 2033
- Table 12: Canada Fuel Tanker Services Market Revenue (Million) Forecast, by Application 2020 & 2033
- Table 13: Rest of North America Fuel Tanker Services Market Revenue (Million) Forecast, by Application 2020 & 2033
- Table 14: Global Fuel Tanker Services Market Revenue Million Forecast, by Material Type 2020 & 2033
- Table 15: Global Fuel Tanker Services Market Revenue Million Forecast, by Capacity 2020 & 2033
- Table 16: Global Fuel Tanker Services Market Revenue Million Forecast, by Fuel Type 2020 & 2033
- Table 17: Global Fuel Tanker Services Market Revenue Million Forecast, by Operator 2020 & 2033
- Table 18: Global Fuel Tanker Services Market Revenue Million Forecast, by Country 2020 & 2033
- Table 19: Germany Fuel Tanker Services Market Revenue (Million) Forecast, by Application 2020 & 2033
- Table 20: France Fuel Tanker Services Market Revenue (Million) Forecast, by Application 2020 & 2033
- Table 21: United Kingdom Fuel Tanker Services Market Revenue (Million) Forecast, by Application 2020 & 2033
- Table 22: Italy Fuel Tanker Services Market Revenue (Million) Forecast, by Application 2020 & 2033
- Table 23: Spain Fuel Tanker Services Market Revenue (Million) Forecast, by Application 2020 & 2033
- Table 24: NORDIC Fuel Tanker Services Market Revenue (Million) Forecast, by Application 2020 & 2033
- Table 25: Russia Fuel Tanker Services Market Revenue (Million) Forecast, by Application 2020 & 2033
- Table 26: Rest of Europe Fuel Tanker Services Market Revenue (Million) Forecast, by Application 2020 & 2033
- Table 27: Global Fuel Tanker Services Market Revenue Million Forecast, by Material Type 2020 & 2033
- Table 28: Global Fuel Tanker Services Market Revenue Million Forecast, by Capacity 2020 & 2033
- Table 29: Global Fuel Tanker Services Market Revenue Million Forecast, by Fuel Type 2020 & 2033
- Table 30: Global Fuel Tanker Services Market Revenue Million Forecast, by Operator 2020 & 2033
- Table 31: Global Fuel Tanker Services Market Revenue Million Forecast, by Country 2020 & 2033
- Table 32: China Fuel Tanker Services Market Revenue (Million) Forecast, by Application 2020 & 2033
- Table 33: India Fuel Tanker Services Market Revenue (Million) Forecast, by Application 2020 & 2033
- Table 34: Australia Fuel Tanker Services Market Revenue (Million) Forecast, by Application 2020 & 2033
- Table 35: Malaysia Fuel Tanker Services Market Revenue (Million) Forecast, by Application 2020 & 2033
- Table 36: Indonesia Fuel Tanker Services Market Revenue (Million) Forecast, by Application 2020 & 2033
- Table 37: Thailand Fuel Tanker Services Market Revenue (Million) Forecast, by Application 2020 & 2033
- Table 38: Vietnam Fuel Tanker Services Market Revenue (Million) Forecast, by Application 2020 & 2033
- Table 39: Rest of Asia Pacific Fuel Tanker Services Market Revenue (Million) Forecast, by Application 2020 & 2033
- Table 40: Global Fuel Tanker Services Market Revenue Million Forecast, by Material Type 2020 & 2033
- Table 41: Global Fuel Tanker Services Market Revenue Million Forecast, by Capacity 2020 & 2033
- Table 42: Global Fuel Tanker Services Market Revenue Million Forecast, by Fuel Type 2020 & 2033
- Table 43: Global Fuel Tanker Services Market Revenue Million Forecast, by Operator 2020 & 2033
- Table 44: Global Fuel Tanker Services Market Revenue Million Forecast, by Country 2020 & 2033
- Table 45: Saudi Arabia Fuel Tanker Services Market Revenue (Million) Forecast, by Application 2020 & 2033
- Table 46: United Arab Emirates Fuel Tanker Services Market Revenue (Million) Forecast, by Application 2020 & 2033
- Table 47: South Africa Fuel Tanker Services Market Revenue (Million) Forecast, by Application 2020 & 2033
- Table 48: Nigeria Fuel Tanker Services Market Revenue (Million) Forecast, by Application 2020 & 2033
- Table 49: Rest of Middle East and Africa Fuel Tanker Services Market Revenue (Million) Forecast, by Application 2020 & 2033
- Table 50: Egypt Fuel Tanker Services Market Revenue (Million) Forecast, by Application 2020 & 2033
- Table 51: Global Fuel Tanker Services Market Revenue Million Forecast, by Material Type 2020 & 2033
- Table 52: Global Fuel Tanker Services Market Revenue Million Forecast, by Capacity 2020 & 2033
- Table 53: Global Fuel Tanker Services Market Revenue Million Forecast, by Fuel Type 2020 & 2033
- Table 54: Global Fuel Tanker Services Market Revenue Million Forecast, by Operator 2020 & 2033
- Table 55: Global Fuel Tanker Services Market Revenue Million Forecast, by Country 2020 & 2033
- Table 56: Brazil Fuel Tanker Services Market Revenue (Million) Forecast, by Application 2020 & 2033
- Table 57: Argentina Fuel Tanker Services Market Revenue (Million) Forecast, by Application 2020 & 2033
- Table 58: Colombia Fuel Tanker Services Market Revenue (Million) Forecast, by Application 2020 & 2033
- Table 59: Rest of South America Fuel Tanker Services Market Revenue (Million) Forecast, by Application 2020 & 2033
Frequently Asked Questions
1. What is the projected Compound Annual Growth Rate (CAGR) of the Fuel Tanker Services Market?
The projected CAGR is approximately 4.50%.
2. Which companies are prominent players in the Fuel Tanker Services Market?
Key companies in the market include Compass Fuel Oils Ltd, Rigual SA, Crown Oil Ltd, Shell International Trading and Shipping Company Limited*List Not Exhaustive, Certas Energy UK Limited.
3. What are the main segments of the Fuel Tanker Services Market?
The market segments include Material Type, Capacity, Fuel Type, Operator.
4. Can you provide details about the market size?
The market size is estimated to be USD 5.60 Million as of 2022.
5. What are some drivers contributing to market growth?
4.; Increasing Demand for Sales of Commercial Vehicles4.; Increasing Deployment of Retail Fuel Outlets Across Various Countries.
6. What are the notable trends driving market growth?
The LNG Segment is Expected to Dominate the Market.
7. Are there any restraints impacting market growth?
4.; Growing Penetration and Demand for Electric Vehicles.
8. Can you provide examples of recent developments in the market?
January 2024: Compass Fuel Oils Ltd announced the acquisition of a new Arctic fuel tanker, marking a significant addition to their expanding fleet at their headquarters in Preston, United Kingdom. This latest addition underscores the company’s commitment to enhancing its capacity.
9. What pricing options are available for accessing the report?
Pricing options include single-user, multi-user, and enterprise licenses priced at USD 4750, USD 5250, and USD 8750 respectively.
10. Is the market size provided in terms of value or volume?
The market size is provided in terms of value, measured in Million.
11. Are there any specific market keywords associated with the report?
Yes, the market keyword associated with the report is "Fuel Tanker Services Market," which aids in identifying and referencing the specific market segment covered.
12. How do I determine which pricing option suits my needs best?
The pricing options vary based on user requirements and access needs. Individual users may opt for single-user licenses, while businesses requiring broader access may choose multi-user or enterprise licenses for cost-effective access to the report.
13. Are there any additional resources or data provided in the Fuel Tanker Services Market report?
While the report offers comprehensive insights, it's advisable to review the specific contents or supplementary materials provided to ascertain if additional resources or data are available.
14. How can I stay updated on further developments or reports in the Fuel Tanker Services Market?
To stay informed about further developments, trends, and reports in the Fuel Tanker Services Market, consider subscribing to industry newsletters, following relevant companies and organizations, or regularly checking reputable industry news sources and publications.
Methodology
Step 1 - Identification of Relevant Samples Size from Population Database


Step 2 - Approaches for Defining Global Market Size (Value, Volume* & Price*)

Note*: In applicable scenarios
Step 3 - Data Sources
Primary Research
- Web Analytics
- Survey Reports
- Research Institute
- Latest Research Reports
- Opinion Leaders
Secondary Research
- Annual Reports
- White Paper
- Latest Press Release
- Industry Association
- Paid Database
- Investor Presentations

Step 4 - Data Triangulation
Involves using different sources of information in order to increase the validity of a study
These sources are likely to be stakeholders in a program - participants, other researchers, program staff, other community members, and so on.
Then we put all data in single framework & apply various statistical tools to find out the dynamic on the market.
During the analysis stage, feedback from the stakeholder groups would be compared to determine areas of agreement as well as areas of divergence