

Key Insights
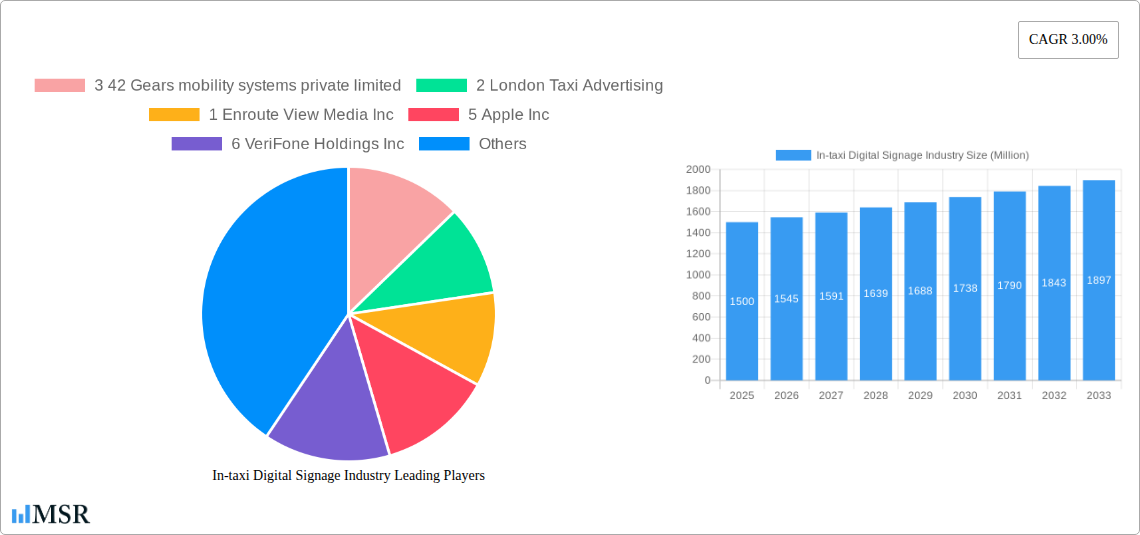
The In-taxi Digital Signage market is experiencing steady growth, projected at a CAGR of 3.00% from 2025 to 2033. This expansion is fueled by several key factors. Firstly, the increasing adoption of smart technologies within the taxi industry creates a ripe environment for digital advertising. Luxury and premium taxi services are leading the adoption, offering high-quality displays (LCD and LED) that provide engaging advertising opportunities to brands targeting affluent demographics. Secondly, the growing number of ride-hailing services and connected vehicles presents a broader reach for advertisers. This provides opportunities to target diverse audiences based on location, demographics, and ride preferences. Furthermore, advancements in display technology and the development of more sophisticated software for targeted advertising are further boosting market growth. This includes features like location-based ads and interactive campaigns which allow for highly customized brand experiences.
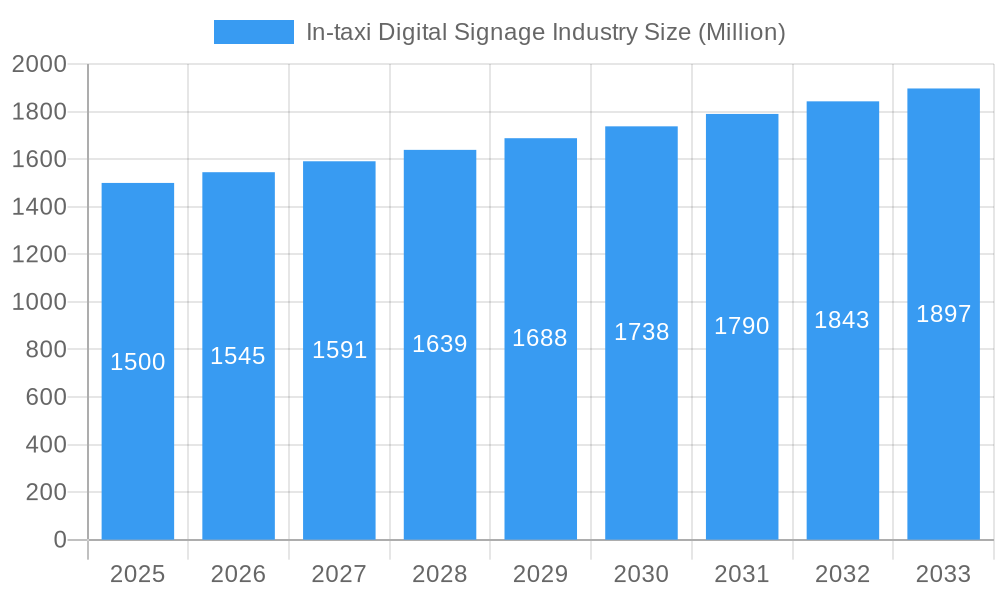
In-taxi Digital Signage Industry Market Size (In Billion)
However, the market faces certain restraints. High initial investment costs for implementing in-taxi digital signage systems can be a barrier to entry for smaller taxi operators. Furthermore, maintaining and updating the technology requires ongoing expenditure. The effectiveness of in-taxi advertising also depends on factors such as ad creative, placement, and audience engagement. Therefore, success hinges on the ability of advertisers and technology providers to create compelling and non-intrusive ads, and for taxi companies to effectively manage the technology and optimize ad revenue streams. The market segmentation reveals a clear preference for higher-quality displays (LCD and LED) amongst premium taxi services, while economy taxis may gradually adopt the technology as costs decrease. Geographic regions such as North America and Europe are expected to lead the market due to higher taxi density and higher consumer spending, although growth is anticipated across all regions as the technology matures. The competitive landscape is characterized by a mix of established advertising technology providers, device manufacturers, and software companies, each playing a critical role in the ecosystem.
In-taxi Digital Signage Industry Company Market Share
In-taxi Digital Signage Industry: A Comprehensive Market Report (2019-2033)
This comprehensive report provides an in-depth analysis of the In-taxi Digital Signage industry, projecting a market value exceeding $XX Million by 2033. The study covers the period 2019-2033, with a focus on the base year 2025 and a forecast period of 2025-2033. Gain actionable insights into market dynamics, key players, emerging trends, and future growth opportunities. This report is essential for industry stakeholders, investors, and businesses seeking to understand and capitalize on the potential of this rapidly evolving market.
In-taxi Digital Signage Industry Market Concentration & Dynamics
The In-taxi Digital Signage market exhibits a moderately concentrated landscape, with a handful of major players commanding significant market share. The top five companies—Apple Inc., VeriFone Holdings Inc., Samsung Electronics Co Ltd., 42Gears Mobility Systems Pvt Ltd., and BillboardsIn—collectively hold an estimated xx% of the market share in 2025. However, the market is characterized by significant dynamism, driven by several factors:
- Innovation Ecosystems: Rapid technological advancements in display technology (LCD, LED), software solutions (advertising management, content delivery), and mobile payment integration are fueling innovation.
- Regulatory Frameworks: Varying regulations across different regions concerning data privacy, advertising standards, and in-vehicle technology integration impact market growth and penetration.
- Substitute Products: Competition exists from other in-vehicle advertising mediums and alternative passenger engagement strategies, impacting the market share of In-taxi Digital Signage.
- End-User Trends: Growing passenger expectations for enhanced in-taxi entertainment and information access are driving demand for sophisticated digital signage solutions.
- M&A Activities: The industry has witnessed xx M&A deals in the historical period (2019-2024), signaling consolidation and a drive towards increased market control.
In-taxi Digital Signage Industry Industry Insights & Trends
The In-taxi Digital Signage market is experiencing robust growth, with a projected Compound Annual Growth Rate (CAGR) of xx% during the forecast period (2025-2033). The market size is estimated to reach $XX Million in 2025. Several key factors contribute to this growth:
The market's expansion is fueled by the increasing adoption of smart city initiatives, rising urbanization, and a surge in ride-sharing services. Technological advancements, such as the integration of high-resolution displays and interactive functionalities, are enhancing passenger experiences and boosting advertising effectiveness. Changing consumer behaviors, marked by increased reliance on mobile devices and a preference for personalized experiences, are also driving demand. This evolving landscape presents both opportunities and challenges for industry players as they navigate technological disruptions and adapt to changing consumer preferences. The integration of 5G and the rise of connected vehicles are significant catalysts, creating avenues for targeted advertising and improved data analytics. The ongoing shift towards digital advertising, combined with the increasing availability of data-driven insights, is further enhancing the attractiveness of the In-taxi Digital Signage market for advertisers.
Key Markets & Segments Leading In-taxi Digital Signage Industry
The North American region is currently the dominant market for In-taxi Digital Signage, driven by strong economic growth, well-developed infrastructure, and a high density of taxis and ride-sharing services. However, Asia-Pacific is projected to experience the fastest growth during the forecast period, fueled by rapid urbanization and rising disposable incomes.
Vehicle Type: The Luxury/Premium Taxi segment currently holds a larger market share due to higher advertising rates and better technological integration capabilities. However, the Economy/Budget Taxi segment shows high growth potential given the sheer volume of vehicles.
Display Type: LCD displays currently dominate the market due to their cost-effectiveness and wide availability. However, LED displays are gaining traction due to their superior image quality and energy efficiency.
Drivers for Growth:
- Economic Growth: Strong economic conditions in key markets translate to higher advertising spending.
- Infrastructure Development: Improved transportation infrastructure supports the expansion of taxi and ride-sharing services.
- Technological Advancements: Innovation in display technology and software solutions enhances user experience and advertising effectiveness.
- Government Regulations: Favorable regulatory frameworks can stimulate market growth.
In-taxi Digital Signage Industry Product Developments
Recent product innovations focus on improving display quality, enhancing interactivity through touchscreens and mobile integration, and providing advanced data analytics capabilities for advertisers. These advancements are creating competitive edges by offering more engaging content and targeted advertising options, leading to increased revenue generation for both signage providers and advertisers.
Challenges in the In-taxi Digital Signage Industry Market
The In-taxi Digital Signage market faces challenges including:
- Regulatory hurdles: Varying and sometimes conflicting regulations across different jurisdictions concerning data privacy, advertising content, and in-vehicle technology integration.
- Supply chain issues: Global supply chain disruptions can impact the availability and cost of components, potentially affecting production and delivery timelines.
- Competitive pressures: Intense competition among existing and emerging players requires continuous innovation and strategic adjustments to maintain market share.
Forces Driving In-taxi Digital Signage Industry Growth
Several factors are driving the growth of the In-taxi Digital Signage market, including:
- Technological advancements: The development of higher-resolution displays, improved software solutions, and the integration of mobile technologies enhance passenger experience and advertising effectiveness.
- Economic growth: Strong economic performance in key markets increases advertising spending and consumer willingness to engage with in-taxi advertisements.
- Regulatory support: Favorable regulatory frameworks in certain regions stimulate market growth by reducing barriers to entry and promoting innovation.
Long-Term Growth Catalysts in the In-taxi Digital Signage Industry
Long-term growth will be driven by continuous innovation in display technology, the development of more sophisticated data analytics capabilities, the expansion into new geographic markets, and strategic partnerships with ride-sharing companies and advertisers. This collaborative approach will unlock new revenue streams and expand market reach.
Emerging Opportunities in In-taxi Digital Signage Industry
Emerging opportunities include expansion into developing markets, integration with advanced technologies like AI and IoT, the personalization of advertising messages based on passenger preferences, and the creation of interactive experiences to enhance engagement. The focus on enhancing passenger safety and convenience is also an emerging opportunity, presenting opportunities for incorporating safety information or emergency response features.
Leading Players in the In-taxi Digital Signage Industry Sector
- 42Gears Mobility Systems Pvt Ltd (3)
- London Taxi Advertising (2)
- Enroute View Media Inc (1)
- Apple Inc (5)
- VeriFone Holdings Inc (6)
- Samsung Electronics Co Ltd (4)
- Clear Vision Advertisement (1)
- Blue Line Media (4)
- Swipe Technologies (3)
- Curb Mobility LLC (4)
- Cabby Tabby Technologies (5)
- BillboardsIn (6)
- Bona Phandle Media
Key Milestones in In-taxi Digital Signage Industry Industry
- 2020: Increased adoption of contactless payment systems within taxis.
- 2021: Launch of several new interactive digital signage solutions with improved user experience.
- 2022: Significant investment in R&D to improve data analytics and targeted advertising capabilities.
- 2023: Major partnerships formed between digital signage providers and ride-sharing companies.
- 2024: Several mergers and acquisitions consolidate the market landscape.
Strategic Outlook for In-taxi Digital Signage Industry Market
The In-taxi Digital Signage market holds immense future potential, driven by technological innovation and the increasing adoption of digital advertising. Strategic opportunities include focusing on personalization, data-driven insights, and the expansion into emerging markets. Companies that successfully adapt to the evolving market dynamics and adopt innovative strategies will be best positioned for long-term growth and success.
In-taxi Digital Signage Industry Segmentation
-
1. Vehicle Type
- 1.1. Luxury/Premium Taxi
- 1.2. Economy/Budget Taxi
-
2. Display Type
- 2.1. LCD
- 2.2. LED
In-taxi Digital Signage Industry Segmentation By Geography
-
1. North America
- 1.1. United States
- 1.2. Canada
- 1.3. Rest of North America
-
2. Europe
- 2.1. United Kingdom
- 2.2. Germany
- 2.3. France
- 2.4. Spain
- 2.5. Rest of Europe
-
3. Asia Pacific
- 3.1. China
- 3.2. Japan
- 3.3. India
- 3.4. Rest of Asia Pacific
-
4. Rest of the World
- 4.1. Saudi Arabia
- 4.2. Brazil
- 4.3. Other Countries
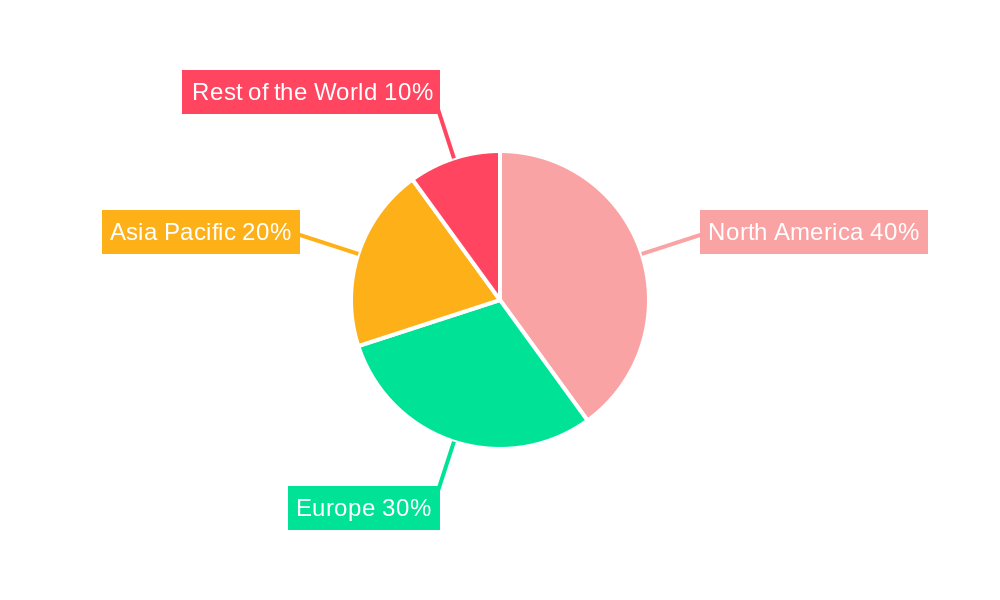
In-taxi Digital Signage Industry Regional Market Share
Geographic Coverage of In-taxi Digital Signage Industry
In-taxi Digital Signage Industry REPORT HIGHLIGHTS
| Aspects | Details |
|---|---|
| Study Period | 2020-2034 |
| Base Year | 2025 |
| Estimated Year | 2026 |
| Forecast Period | 2026-2034 |
| Historical Period | 2020-2025 |
| Growth Rate | CAGR of 4.5% from 2020-2034 |
| Segmentation |
|
Table of Contents
- 1. Introduction
- 1.1. Research Scope
- 1.2. Market Segmentation
- 1.3. Research Objective
- 1.4. Definitions and Assumptions
- 2. Executive Summary
- 2.1. Market Snapshot
- 3. Market Dynamics
- 3.1. Market Drivers
- 3.2. Market Restrains
- 3.3. Market Trends
- 3.4. Market Opportunities
- 4. Market Factor Analysis
- 4.1. Porters Five Forces
- 4.1.1. Bargaining Power of Suppliers
- 4.1.2. Bargaining Power of Buyers
- 4.1.3. Threat of New Entrants
- 4.1.4. Threat of Substitutes
- 4.1.5. Competitive Rivalry
- 4.2. PESTEL analysis
- 4.3. BCG Analysis
- 4.3.1. Stars (High Growth, High Market Share)
- 4.3.2. Cash Cows (Low Growth, High Market Share)
- 4.3.3. Question Mark (High Growth, Low Market Share)
- 4.3.4. Dogs (Low Growth, Low Market Share)
- 4.4. Ansoff Matrix Analysis
- 4.5. Supply Chain Analysis
- 4.6. Regulatory Landscape
- 4.7. Current Market Potential and Opportunity Assessment (TAM–SAM–SOM Framework)
- 4.8. MSR Analyst Note
- 4.1. Porters Five Forces
- 5. Market Analysis, Insights and Forecast 2021-2033
- 5.1. Market Analysis, Insights and Forecast - by Vehicle Type
- 5.1.1. Luxury/Premium Taxi
- 5.1.2. Economy/Budget Taxi
- 5.2. Market Analysis, Insights and Forecast - by Display Type
- 5.2.1. LCD
- 5.2.2. LED
- 5.3. Market Analysis, Insights and Forecast - by Region
- 5.3.1. North America
- 5.3.2. Europe
- 5.3.3. Asia Pacific
- 5.3.4. Rest of the World
- 5.1. Market Analysis, Insights and Forecast - by Vehicle Type
- 6. Global In-taxi Digital Signage Industry Analysis, Insights and Forecast, 2021-2033
- 6.1. Market Analysis, Insights and Forecast - by Vehicle Type
- 6.1.1. Luxury/Premium Taxi
- 6.1.2. Economy/Budget Taxi
- 6.2. Market Analysis, Insights and Forecast - by Display Type
- 6.2.1. LCD
- 6.2.2. LED
- 6.1. Market Analysis, Insights and Forecast - by Vehicle Type
- 7. North America In-taxi Digital Signage Industry Analysis, Insights and Forecast, 2020-2032
- 7.1. Market Analysis, Insights and Forecast - by Vehicle Type
- 7.1.1. Luxury/Premium Taxi
- 7.1.2. Economy/Budget Taxi
- 7.2. Market Analysis, Insights and Forecast - by Display Type
- 7.2.1. LCD
- 7.2.2. LED
- 7.1. Market Analysis, Insights and Forecast - by Vehicle Type
- 8. Europe In-taxi Digital Signage Industry Analysis, Insights and Forecast, 2020-2032
- 8.1. Market Analysis, Insights and Forecast - by Vehicle Type
- 8.1.1. Luxury/Premium Taxi
- 8.1.2. Economy/Budget Taxi
- 8.2. Market Analysis, Insights and Forecast - by Display Type
- 8.2.1. LCD
- 8.2.2. LED
- 8.1. Market Analysis, Insights and Forecast - by Vehicle Type
- 9. Asia Pacific In-taxi Digital Signage Industry Analysis, Insights and Forecast, 2020-2032
- 9.1. Market Analysis, Insights and Forecast - by Vehicle Type
- 9.1.1. Luxury/Premium Taxi
- 9.1.2. Economy/Budget Taxi
- 9.2. Market Analysis, Insights and Forecast - by Display Type
- 9.2.1. LCD
- 9.2.2. LED
- 9.1. Market Analysis, Insights and Forecast - by Vehicle Type
- 10. Rest of the World In-taxi Digital Signage Industry Analysis, Insights and Forecast, 2020-2032
- 10.1. Market Analysis, Insights and Forecast - by Vehicle Type
- 10.1.1. Luxury/Premium Taxi
- 10.1.2. Economy/Budget Taxi
- 10.2. Market Analysis, Insights and Forecast - by Display Type
- 10.2.1. LCD
- 10.2.2. LED
- 10.1. Market Analysis, Insights and Forecast - by Vehicle Type
- 11. Competitive Analysis
- 11.1. Company Profiles
- 11.1.1 3 42 Gears mobility systems private limited
- 11.1.1.1. Company Overview
- 11.1.1.2. Products
- 11.1.1.3. Company Financials
- 11.1.1.4. SWOT Analysis
- 11.1.2 2 London Taxi Advertising
- 11.1.2.1. Company Overview
- 11.1.2.2. Products
- 11.1.2.3. Company Financials
- 11.1.2.4. SWOT Analysis
- 11.1.3 1 Enroute View Media Inc
- 11.1.3.1. Company Overview
- 11.1.3.2. Products
- 11.1.3.3. Company Financials
- 11.1.3.4. SWOT Analysis
- 11.1.4 5 Apple Inc
- 11.1.4.1. Company Overview
- 11.1.4.2. Products
- 11.1.4.3. Company Financials
- 11.1.4.4. SWOT Analysis
- 11.1.5 6 VeriFone Holdings Inc
- 11.1.5.1. Company Overview
- 11.1.5.2. Products
- 11.1.5.3. Company Financials
- 11.1.5.4. SWOT Analysis
- 11.1.6 4 Samsung Electronics Co Ltd
- 11.1.6.1. Company Overview
- 11.1.6.2. Products
- 11.1.6.3. Company Financials
- 11.1.6.4. SWOT Analysis
- 11.1.7 1 Clear Vision Advertisement
- 11.1.7.1. Company Overview
- 11.1.7.2. Products
- 11.1.7.3. Company Financials
- 11.1.7.4. SWOT Analysis
- 11.1.8 4 Blue Line Media
- 11.1.8.1. Company Overview
- 11.1.8.2. Products
- 11.1.8.3. Company Financials
- 11.1.8.4. SWOT Analysis
- 11.1.9 1 Swipe Technologies
- 11.1.9.1. Company Overview
- 11.1.9.2. Products
- 11.1.9.3. Company Financials
- 11.1.9.4. SWOT Analysis
- 11.1.10 3 Curb Mobility LLC
- 11.1.10.1. Company Overview
- 11.1.10.2. Products
- 11.1.10.3. Company Financials
- 11.1.10.4. SWOT Analysis
- 11.1.11 2 Curb Mobility LLC
- 11.1.11.1. Company Overview
- 11.1.11.2. Products
- 11.1.11.3. Company Financials
- 11.1.11.4. SWOT Analysis
- 11.1.12 2 Cabby Tabby Technologies
- 11.1.12.1. Company Overview
- 11.1.12.2. Products
- 11.1.12.3. Company Financials
- 11.1.12.4. SWOT Analysis
- 11.1.13 5 BillboardsIn
- 11.1.13.1. Company Overview
- 11.1.13.2. Products
- 11.1.13.3. Company Financials
- 11.1.13.4. SWOT Analysis
- 11.1.14 6 Bona Phandle Media
- 11.1.14.1. Company Overview
- 11.1.14.2. Products
- 11.1.14.3. Company Financials
- 11.1.14.4. SWOT Analysis
- 11.1.15 Advertising Service Providers
- 11.1.15.1. Company Overview
- 11.1.15.2. Products
- 11.1.15.3. Company Financials
- 11.1.15.4. SWOT Analysis
- 11.1.16 Software Providers
- 11.1.16.1. Company Overview
- 11.1.16.2. Products
- 11.1.16.3. Company Financials
- 11.1.16.4. SWOT Analysis
- 11.1.17 3 42Gears Mobility Systems Pvt Ltd
- 11.1.17.1. Company Overview
- 11.1.17.2. Products
- 11.1.17.3. Company Financials
- 11.1.17.4. SWOT Analysis
- 11.1.18 Device Manufacturers
- 11.1.18.1. Company Overview
- 11.1.18.2. Products
- 11.1.18.3. Company Financials
- 11.1.18.4. SWOT Analysis
- 11.1.1 3 42 Gears mobility systems private limited
- 11.2. Market Entropy
- 11.2.1 Company's Key Areas Served
- 11.2.2 Recent Developments
- 11.3. Company Market Share Analysis 2025
- 11.3.1 Top 5 Companies Market Share Analysis
- 11.3.2 Top 3 Companies Market Share Analysis
- 11.4. List of Potential Customers
- 12. Research Methodology
List of Figures
- Figure 1: Global In-taxi Digital Signage Industry Revenue Breakdown (undefined, %) by Region 2025 & 2033
- Figure 2: North America In-taxi Digital Signage Industry Revenue (undefined), by Vehicle Type 2025 & 2033
- Figure 3: North America In-taxi Digital Signage Industry Revenue Share (%), by Vehicle Type 2025 & 2033
- Figure 4: North America In-taxi Digital Signage Industry Revenue (undefined), by Display Type 2025 & 2033
- Figure 5: North America In-taxi Digital Signage Industry Revenue Share (%), by Display Type 2025 & 2033
- Figure 6: North America In-taxi Digital Signage Industry Revenue (undefined), by Country 2025 & 2033
- Figure 7: North America In-taxi Digital Signage Industry Revenue Share (%), by Country 2025 & 2033
- Figure 8: Europe In-taxi Digital Signage Industry Revenue (undefined), by Vehicle Type 2025 & 2033
- Figure 9: Europe In-taxi Digital Signage Industry Revenue Share (%), by Vehicle Type 2025 & 2033
- Figure 10: Europe In-taxi Digital Signage Industry Revenue (undefined), by Display Type 2025 & 2033
- Figure 11: Europe In-taxi Digital Signage Industry Revenue Share (%), by Display Type 2025 & 2033
- Figure 12: Europe In-taxi Digital Signage Industry Revenue (undefined), by Country 2025 & 2033
- Figure 13: Europe In-taxi Digital Signage Industry Revenue Share (%), by Country 2025 & 2033
- Figure 14: Asia Pacific In-taxi Digital Signage Industry Revenue (undefined), by Vehicle Type 2025 & 2033
- Figure 15: Asia Pacific In-taxi Digital Signage Industry Revenue Share (%), by Vehicle Type 2025 & 2033
- Figure 16: Asia Pacific In-taxi Digital Signage Industry Revenue (undefined), by Display Type 2025 & 2033
- Figure 17: Asia Pacific In-taxi Digital Signage Industry Revenue Share (%), by Display Type 2025 & 2033
- Figure 18: Asia Pacific In-taxi Digital Signage Industry Revenue (undefined), by Country 2025 & 2033
- Figure 19: Asia Pacific In-taxi Digital Signage Industry Revenue Share (%), by Country 2025 & 2033
- Figure 20: Rest of the World In-taxi Digital Signage Industry Revenue (undefined), by Vehicle Type 2025 & 2033
- Figure 21: Rest of the World In-taxi Digital Signage Industry Revenue Share (%), by Vehicle Type 2025 & 2033
- Figure 22: Rest of the World In-taxi Digital Signage Industry Revenue (undefined), by Display Type 2025 & 2033
- Figure 23: Rest of the World In-taxi Digital Signage Industry Revenue Share (%), by Display Type 2025 & 2033
- Figure 24: Rest of the World In-taxi Digital Signage Industry Revenue (undefined), by Country 2025 & 2033
- Figure 25: Rest of the World In-taxi Digital Signage Industry Revenue Share (%), by Country 2025 & 2033
List of Tables
- Table 1: Global In-taxi Digital Signage Industry Revenue undefined Forecast, by Vehicle Type 2020 & 2033
- Table 2: Global In-taxi Digital Signage Industry Revenue undefined Forecast, by Display Type 2020 & 2033
- Table 3: Global In-taxi Digital Signage Industry Revenue undefined Forecast, by Region 2020 & 2033
- Table 4: Global In-taxi Digital Signage Industry Revenue undefined Forecast, by Vehicle Type 2020 & 2033
- Table 5: Global In-taxi Digital Signage Industry Revenue undefined Forecast, by Display Type 2020 & 2033
- Table 6: Global In-taxi Digital Signage Industry Revenue undefined Forecast, by Country 2020 & 2033
- Table 7: United States In-taxi Digital Signage Industry Revenue (undefined) Forecast, by Application 2020 & 2033
- Table 8: Canada In-taxi Digital Signage Industry Revenue (undefined) Forecast, by Application 2020 & 2033
- Table 9: Rest of North America In-taxi Digital Signage Industry Revenue (undefined) Forecast, by Application 2020 & 2033
- Table 10: Global In-taxi Digital Signage Industry Revenue undefined Forecast, by Vehicle Type 2020 & 2033
- Table 11: Global In-taxi Digital Signage Industry Revenue undefined Forecast, by Display Type 2020 & 2033
- Table 12: Global In-taxi Digital Signage Industry Revenue undefined Forecast, by Country 2020 & 2033
- Table 13: United Kingdom In-taxi Digital Signage Industry Revenue (undefined) Forecast, by Application 2020 & 2033
- Table 14: Germany In-taxi Digital Signage Industry Revenue (undefined) Forecast, by Application 2020 & 2033
- Table 15: France In-taxi Digital Signage Industry Revenue (undefined) Forecast, by Application 2020 & 2033
- Table 16: Spain In-taxi Digital Signage Industry Revenue (undefined) Forecast, by Application 2020 & 2033
- Table 17: Rest of Europe In-taxi Digital Signage Industry Revenue (undefined) Forecast, by Application 2020 & 2033
- Table 18: Global In-taxi Digital Signage Industry Revenue undefined Forecast, by Vehicle Type 2020 & 2033
- Table 19: Global In-taxi Digital Signage Industry Revenue undefined Forecast, by Display Type 2020 & 2033
- Table 20: Global In-taxi Digital Signage Industry Revenue undefined Forecast, by Country 2020 & 2033
- Table 21: China In-taxi Digital Signage Industry Revenue (undefined) Forecast, by Application 2020 & 2033
- Table 22: Japan In-taxi Digital Signage Industry Revenue (undefined) Forecast, by Application 2020 & 2033
- Table 23: India In-taxi Digital Signage Industry Revenue (undefined) Forecast, by Application 2020 & 2033
- Table 24: Rest of Asia Pacific In-taxi Digital Signage Industry Revenue (undefined) Forecast, by Application 2020 & 2033
- Table 25: Global In-taxi Digital Signage Industry Revenue undefined Forecast, by Vehicle Type 2020 & 2033
- Table 26: Global In-taxi Digital Signage Industry Revenue undefined Forecast, by Display Type 2020 & 2033
- Table 27: Global In-taxi Digital Signage Industry Revenue undefined Forecast, by Country 2020 & 2033
- Table 28: Saudi Arabia In-taxi Digital Signage Industry Revenue (undefined) Forecast, by Application 2020 & 2033
- Table 29: Brazil In-taxi Digital Signage Industry Revenue (undefined) Forecast, by Application 2020 & 2033
- Table 30: Other Countries In-taxi Digital Signage Industry Revenue (undefined) Forecast, by Application 2020 & 2033
Frequently Asked Questions
1. What is the projected Compound Annual Growth Rate (CAGR) of the In-taxi Digital Signage Industry?
The projected CAGR is approximately 4.5%.
2. Which companies are prominent players in the In-taxi Digital Signage Industry?
Key companies in the market include 3 42 Gears mobility systems private limited, 2 London Taxi Advertising, 1 Enroute View Media Inc, 5 Apple Inc, 6 VeriFone Holdings Inc, 4 Samsung Electronics Co Ltd, 1 Clear Vision Advertisement, 4 Blue Line Media, 1 Swipe Technologies, 3 Curb Mobility LLC, 2 Curb Mobility LLC, 2 Cabby Tabby Technologies, 5 BillboardsIn, 6 Bona Phandle Media, Advertising Service Providers, Software Providers, 3 42Gears Mobility Systems Pvt Ltd, Device Manufacturers.
3. What are the main segments of the In-taxi Digital Signage Industry?
The market segments include Vehicle Type, Display Type.
4. Can you provide details about the market size?
The market size is estimated to be USD XXX N/A as of 2022.
5. What are some drivers contributing to market growth?
Exponential Increase in Automotive Sector.
6. What are the notable trends driving market growth?
Growing Adoption of Entertainment Devices in Luxury Taxis.
7. Are there any restraints impacting market growth?
Digitization of R&D Operations in Automotive Sector.
8. Can you provide examples of recent developments in the market?
N/A
9. What pricing options are available for accessing the report?
Pricing options include single-user, multi-user, and enterprise licenses priced at USD 4750, USD 5250, and USD 8750 respectively.
10. Is the market size provided in terms of value or volume?
The market size is provided in terms of value, measured in N/A.
11. Are there any specific market keywords associated with the report?
Yes, the market keyword associated with the report is "In-taxi Digital Signage Industry," which aids in identifying and referencing the specific market segment covered.
12. How do I determine which pricing option suits my needs best?
The pricing options vary based on user requirements and access needs. Individual users may opt for single-user licenses, while businesses requiring broader access may choose multi-user or enterprise licenses for cost-effective access to the report.
13. Are there any additional resources or data provided in the In-taxi Digital Signage Industry report?
While the report offers comprehensive insights, it's advisable to review the specific contents or supplementary materials provided to ascertain if additional resources or data are available.
14. How can I stay updated on further developments or reports in the In-taxi Digital Signage Industry?
To stay informed about further developments, trends, and reports in the In-taxi Digital Signage Industry, consider subscribing to industry newsletters, following relevant companies and organizations, or regularly checking reputable industry news sources and publications.
Methodology
Step 1 - Identification of Relevant Samples Size from Population Database


Step 2 - Approaches for Defining Global Market Size (Value, Volume* & Price*)

Note*: In applicable scenarios
Step 3 - Data Sources
Primary Research
- Web Analytics
- Survey Reports
- Research Institute
- Latest Research Reports
- Opinion Leaders
Secondary Research
- Annual Reports
- White Paper
- Latest Press Release
- Industry Association
- Paid Database
- Investor Presentations

Step 4 - Data Triangulation
Involves using different sources of information in order to increase the validity of a study
These sources are likely to be stakeholders in a program - participants, other researchers, program staff, other community members, and so on.
Then we put all data in single framework & apply various statistical tools to find out the dynamic on the market.
During the analysis stage, feedback from the stakeholder groups would be compared to determine areas of agreement as well as areas of divergence