

Key Insights
The global Liquefied Petroleum Gas (LPG) market is poised for significant expansion, fueled by escalating energy requirements in developing regions and the increasing preference for cleaner fuel alternatives. The market, valued at $123.14 billion in 2024, is projected to achieve a Compound Annual Growth Rate (CAGR) of 3.9%. Key growth catalysts include the expanding use of LPG for residential and commercial purposes in emerging economies, particularly across Asia-Pacific and the Middle East & Africa, where it serves as an essential cooking and heating fuel. The global transition towards sustainable energy solutions, coupled with stringent environmental mandates and supportive government policies, further propels market growth. While price fluctuations in crude oil present a consideration, the industry is actively diversifying production sources, incorporating Natural Gas Liquids (NGLs) to enhance price stability and supply chain resilience. The competitive arena features prominent multinational corporations and agile regional entities, reflecting a dynamic and evolving market landscape. Application-wise, autogas and industrial sectors demonstrate substantial contributions, complementing residential demand. Ongoing advancements in LPG infrastructure and technology are critical for sustaining this positive growth trajectory.
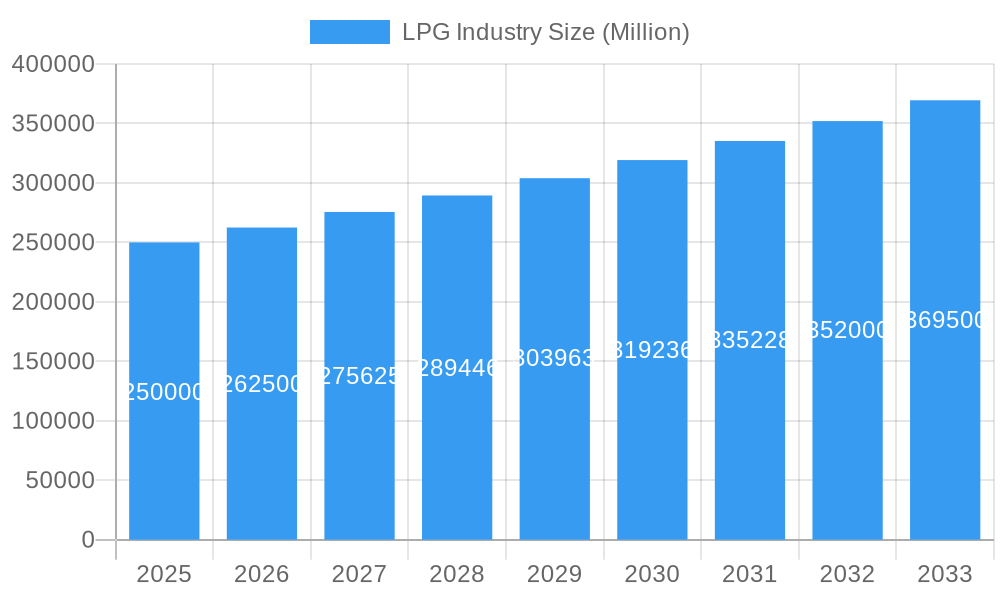
LPG Industry Market Size (In Billion)
Regional dynamics significantly influence LPG consumption patterns. Mature markets in North America and Europe are expected to exhibit steady but more moderate growth compared to the accelerated development anticipated in Asia-Pacific and the Middle East & Africa. China and India are identified as primary drivers of global LPG demand, propelled by robust population increases and rapid urbanization. The market's sustained success relies on strategic infrastructure development, optimized distribution channels, and the implementation of sustainable practices throughout the value chain. Government initiatives that encourage LPG adoption and address safety protocols will be instrumental in fostering long-term market expansion and ensuring broad access to this vital energy resource.
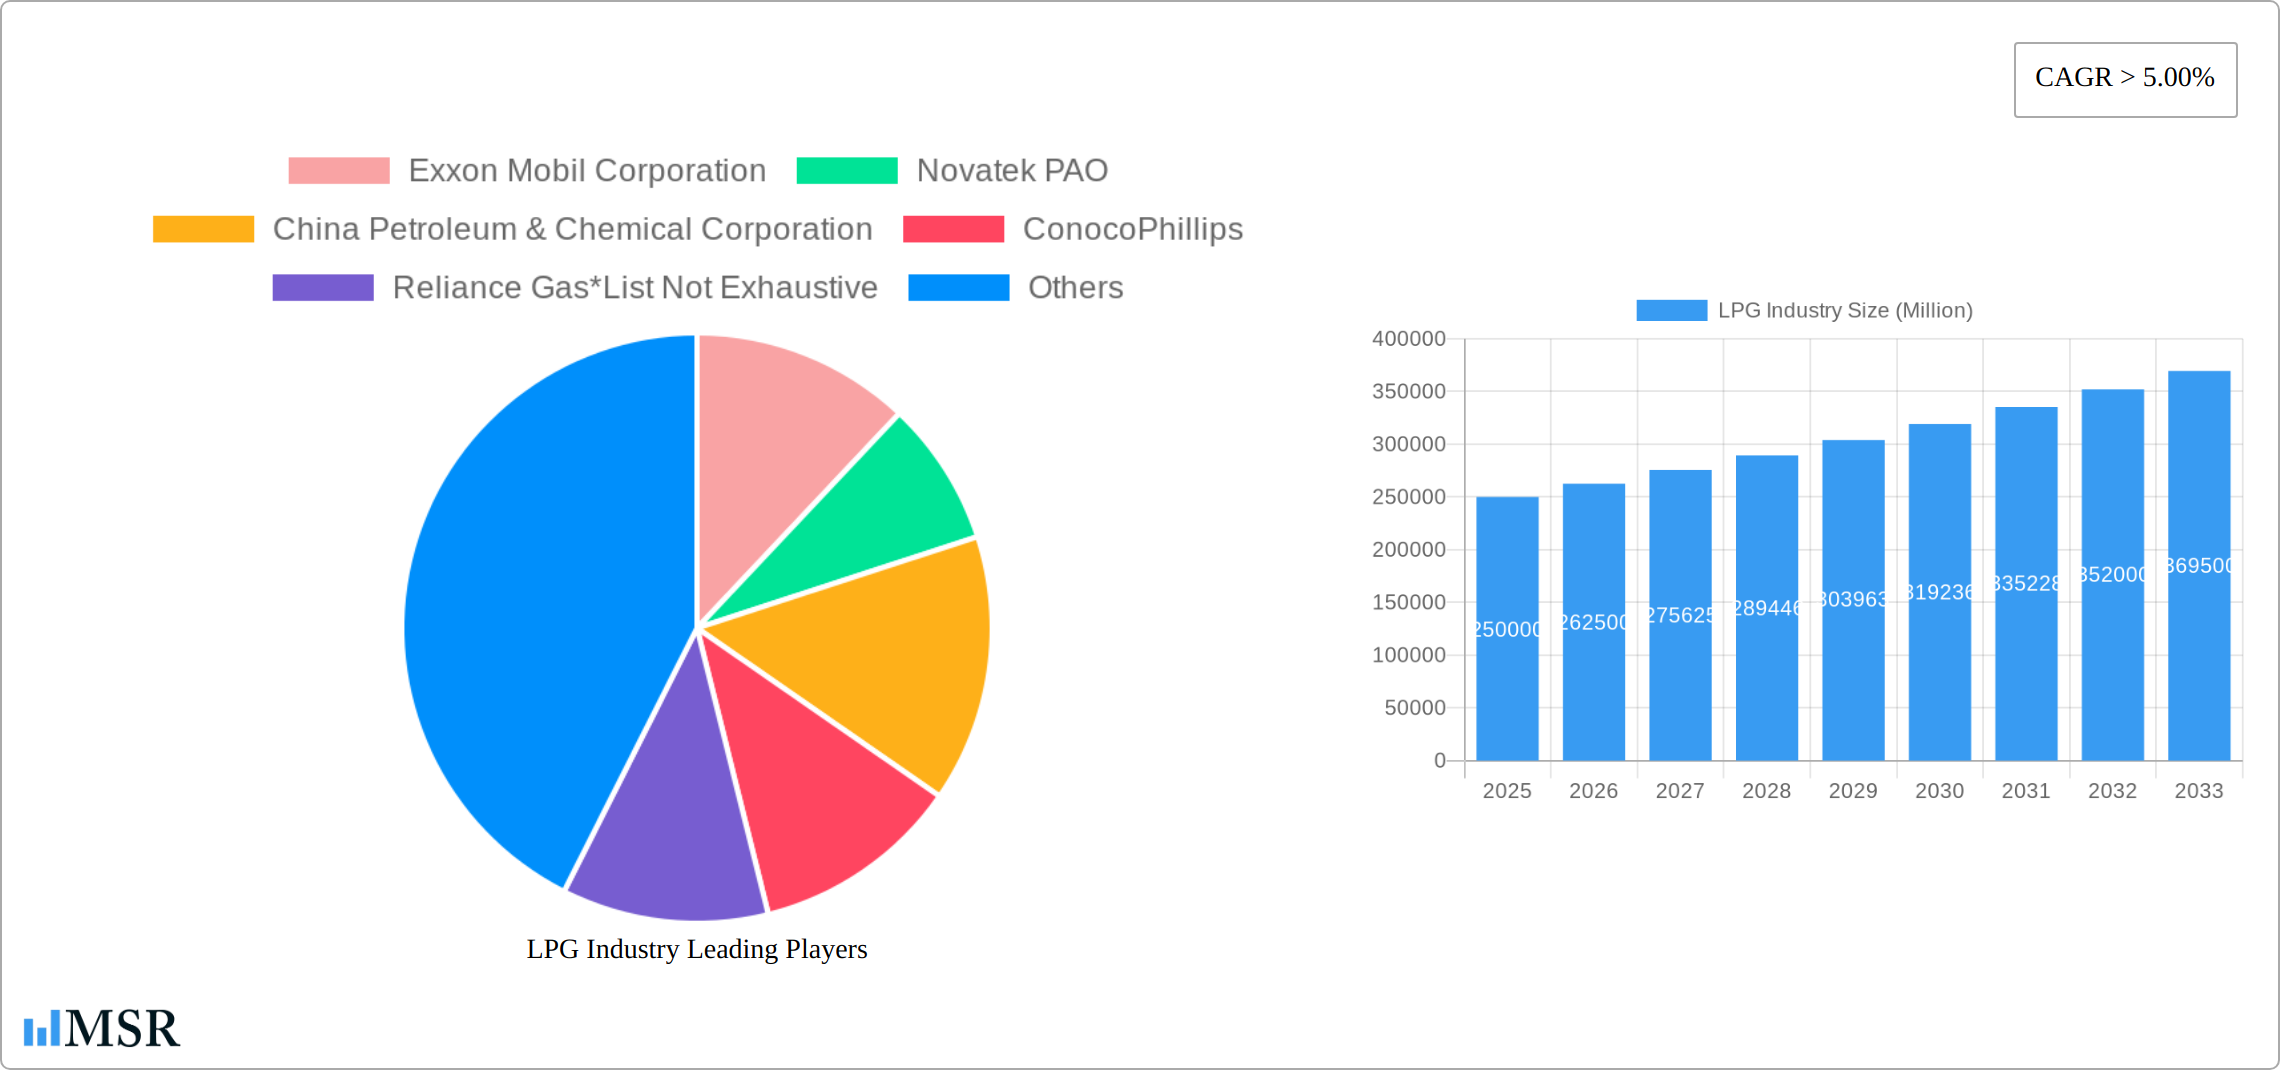
LPG Industry Company Market Share
LPG Industry Market Report: 2019-2033 Forecast
This comprehensive report provides a detailed analysis of the global Liquefied Petroleum Gas (LPG) industry, offering invaluable insights for investors, industry stakeholders, and strategic decision-makers. With a study period spanning 2019-2033, a base year of 2025, and a forecast period of 2025-2033, this report leverages historical data (2019-2024) to paint a clear picture of current market dynamics and future trends. The report covers key market segments, leading players, and emerging opportunities, making it an indispensable resource for navigating the complexities of this dynamic sector. The global LPG market size is estimated at $XX Million in 2025, with a Compound Annual Growth Rate (CAGR) of XX% projected for the forecast period.
LPG Industry Market Concentration & Dynamics
The global LPG market exhibits a moderately concentrated structure, with several major players commanding significant market share. Exxon Mobil Corporation, Novatek PAO, China Petroleum & Chemical Corporation, ConocoPhillips, Reliance Gas, QatarEnergy, BP PLC, Indian Oil Corporation Ltd, Gazprom PJSC, and Abu Dhabi National Oil Company (ADNOC) are among the leading companies shaping the industry landscape. However, the presence of numerous smaller players and regional distributors contributes to a dynamic competitive environment.
Market Share: The top 10 players hold an estimated XX% market share, with the largest single player holding approximately XX%. The remaining share is distributed among numerous smaller players.
Innovation Ecosystems: Innovation in the LPG industry centers on improving efficiency across the value chain, encompassing exploration and production, transportation, storage, and distribution. This involves advancements in technologies like automation, data analytics, and sustainable practices.
Regulatory Frameworks: Government regulations play a crucial role, especially regarding safety standards, environmental protection, and pricing mechanisms. These regulations vary significantly across different regions, impacting market dynamics.
Substitute Products: Competition comes from alternative fuels like natural gas, biogas, and electricity, particularly in residential and commercial sectors. The competitiveness of these substitutes depends on factors like price, availability, and government incentives.
End-User Trends: The residential sector remains the largest LPG consumer globally. However, growing industrialization and increasing vehicle usage are driving demand in the commercial and autofuel segments.
M&A Activities: The LPG industry has seen a moderate level of mergers and acquisitions (M&A) activity in recent years, with approximately XX deals recorded between 2019 and 2024. These activities primarily aim to expand market reach, enhance production capacity, and integrate value chains.
LPG Industry Industry Insights & Trends
The LPG market is a dynamic landscape shaped by fluctuating crude oil prices, global supply and demand imbalances, and geopolitical events. Technological advancements are revolutionizing the industry, enhancing safety, efficiency, and sustainability across the entire value chain. This includes automation in production facilities, the development of sophisticated storage and transportation systems, and the growing adoption of cleaner technologies to mitigate emissions and environmental impact. Consumer preferences are increasingly leaning towards environmentally responsible choices, fueling demand for sustainable LPG solutions and prompting innovation in this area. Key market growth drivers include the escalating energy demands of developing economies, rapid urbanization, and the expansion of the middle class, all leading to significantly increased energy consumption. The LPG market size is projected to reach $XX Million by 2033, driven by consistent growth across key end-use sectors. This growth, however, faces challenges including price volatility and the need for continued investment in sustainable practices.
Key Markets & Segments Leading LPG Industry
The Asia-Pacific region holds a dominant position in the global LPG market, fueled by its large population base, rapid economic expansion, and surging energy consumption. Within this region, India and China stand out as major LPG consumers.
Sources of LPG Production:
- Crude Oil Refining: Crude oil remains a primary source of LPG, particularly in regions with significant oil production capabilities.
- Natural Gas Liquids (NGLs): NGLs are increasingly becoming a crucial source of LPG, driven by the expansion of natural gas extraction and processing activities.
Key Applications of LPG:
- Residential Sector: Globally, the residential sector constitutes the largest consumer of LPG, primarily for cooking and heating applications, reflecting rising household incomes and energy needs.
- Commercial & Industrial Sectors: Commercial and industrial entities utilize LPG for diverse purposes, including heating, cooking, and various industrial processes requiring reliable and efficient fuel sources.
- Automotive Fuel: LPG serves as an autofuel in select regions, offering advantages such as reduced emissions compared to gasoline, although its market share in this segment varies geographically.
- Petrochemical Feedstock & Specialized Uses: LPG also finds applications as a petrochemical feedstock and in specialized industrial processes, highlighting its versatility.
Factors Driving Regional Dominance:
- Asia-Pacific: Rapid economic growth, urbanization, and the associated increase in energy demand are the primary drivers of robust growth in this region.
- India: Strong domestic demand coupled with government initiatives aimed at promoting LPG adoption are key contributors to India's significant LPG consumption.
- China: China's vast population and the expansive growth of its industrial sector are major factors driving high LPG consumption within the country.
LPG Industry Product Developments
Recent product innovations focus on enhancing safety features, improving efficiency in LPG appliances, and developing sustainable solutions. This involves developing more efficient and environmentally friendly LPG storage and dispensing systems, as well as promoting the use of LPG as a cleaner alternative fuel. The market relevance of these innovations lies in their ability to meet growing consumer demands for safety, efficiency, and environmental sustainability.
Challenges in the LPG Industry Market
The LPG industry confronts several challenges, including the inherent price volatility tied to crude oil prices, geopolitical instability that disrupts supply chains, and increasingly stringent environmental regulations necessitating significant investments in cleaner technologies. These factors collectively contribute to fluctuations in profitability and operational complexities. Furthermore, competition from alternative fuels adds to the pressure on the industry. The estimated impact of these challenges on industry growth is a projected reduction of approximately XX% from the initial growth rate.
Forces Driving LPG Industry Growth
Key growth drivers include rising energy demand in developing economies, increasing urbanization leading to higher household energy needs, and the expansion of LPG infrastructure in underserved areas. Government policies promoting cleaner fuels and investments in LPG infrastructure further fuel market expansion. Technological advancements, including improved storage and transportation, enhance efficiency and reduce environmental impact.
Long-Term Growth Catalysts
Long-term growth will be driven by ongoing technological innovations leading to safer and more efficient LPG systems, strategic partnerships to expand distribution networks, and market expansion into new geographical areas with growing energy needs. These factors will support sustained growth and market diversification.
Emerging Opportunities in LPG Industry
Emerging opportunities include the expansion of LPG use in the transportation sector (autogas), the development of new applications for LPG in industrial processes, and the growing interest in renewable LPG sources and carbon capture technologies to reduce the environmental impact.
Leading Players in the LPG Industry Sector
Key Milestones in LPG Industry Industry
- October 2022: Maire Tecnimont S.p.A. secured a USD 380 million EPC contract for constructing an LPG extraction plant in Algeria. This significant investment underscores the ongoing commitment to expanding LPG infrastructure and production capacity.
- February 2022: Indian Oil Corp. (IOC) announced plans to invest USD 43-46 million in new LPG bottling plants, demonstrating a strategic focus on meeting the growing domestic demand within the Indian market.
- Add more recent milestones here. Include details such as company names, investment amounts, and a brief description of the milestone's significance.
Strategic Outlook for LPG Industry Market
The LPG industry is projected to experience continued growth, propelled by the escalating global energy demand, particularly in developing economies. Key strategic opportunities lie in expanding LPG infrastructure to meet growing needs, developing innovative technologies to enhance efficiency and sustainability, and exploring new and diversified applications for LPG. Companies that successfully adapt to the evolving market dynamics, embrace technological progress, and prioritize sustainability initiatives will be optimally positioned for long-term success and market leadership.
LPG Industry Segmentation
-
1. Source of Production
- 1.1. Crude Oil
- 1.2. Natural Gas Liquids
-
2. Application
- 2.1. Residential
- 2.2. Commercial & Industrial
- 2.3. Autofuels
- 2.4. Other Applications
LPG Industry Segmentation By Geography
-
1. North America
- 1.1. United States
- 1.2. Canada
- 1.3. Rest of North America
-
2. Europe
- 2.1. Norway
- 2.2. Netherlands
- 2.3. United Kingdom
- 2.4. Germany
- 2.5. Rest of Europe
-
3. Asia Pacific
- 3.1. China
- 3.2. India
- 3.3. South Korea
- 3.4. Japan
- 3.5. Rest of Asia Pacific
-
4. Middle East and Africa
- 4.1. Saudi Arabia
- 4.2. Qatar
- 4.3. South Africa
- 4.4. Rest of Middle East and Africa
-
5. South America
- 5.1. Brazil
- 5.2. Argentina
- 5.3. Chile
- 5.4. Rest of South America
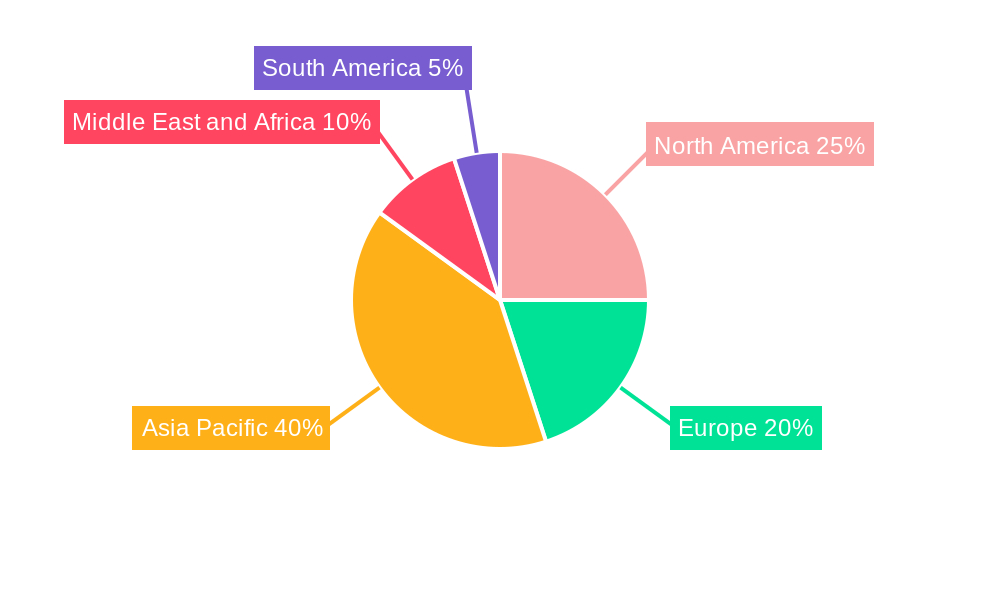
LPG Industry Regional Market Share
Geographic Coverage of LPG Industry
LPG Industry REPORT HIGHLIGHTS
| Aspects | Details |
|---|---|
| Study Period | 2020-2034 |
| Base Year | 2025 |
| Estimated Year | 2026 |
| Forecast Period | 2026-2034 |
| Historical Period | 2020-2025 |
| Growth Rate | CAGR of 3.9% from 2020-2034 |
| Segmentation |
|
Table of Contents
- 1. Introduction
- 1.1. Research Scope
- 1.2. Market Segmentation
- 1.3. Research Objective
- 1.4. Definitions and Assumptions
- 2. Executive Summary
- 2.1. Market Snapshot
- 3. Market Dynamics
- 3.1. Market Drivers
- 3.2. Market Restrains
- 3.3. Market Trends
- 3.4. Market Opportunities
- 4. Market Factor Analysis
- 4.1. Porters Five Forces
- 4.1.1. Bargaining Power of Suppliers
- 4.1.2. Bargaining Power of Buyers
- 4.1.3. Threat of New Entrants
- 4.1.4. Threat of Substitutes
- 4.1.5. Competitive Rivalry
- 4.2. PESTEL analysis
- 4.3. BCG Analysis
- 4.3.1. Stars (High Growth, High Market Share)
- 4.3.2. Cash Cows (Low Growth, High Market Share)
- 4.3.3. Question Mark (High Growth, Low Market Share)
- 4.3.4. Dogs (Low Growth, Low Market Share)
- 4.4. Ansoff Matrix Analysis
- 4.5. Supply Chain Analysis
- 4.6. Regulatory Landscape
- 4.7. Current Market Potential and Opportunity Assessment (TAM–SAM–SOM Framework)
- 4.8. MSR Analyst Note
- 4.1. Porters Five Forces
- 5. Market Analysis, Insights and Forecast 2021-2033
- 5.1. Market Analysis, Insights and Forecast - by Source of Production
- 5.1.1. Crude Oil
- 5.1.2. Natural Gas Liquids
- 5.2. Market Analysis, Insights and Forecast - by Application
- 5.2.1. Residential
- 5.2.2. Commercial & Industrial
- 5.2.3. Autofuels
- 5.2.4. Other Applications
- 5.3. Market Analysis, Insights and Forecast - by Region
- 5.3.1. North America
- 5.3.2. Europe
- 5.3.3. Asia Pacific
- 5.3.4. Middle East and Africa
- 5.3.5. South America
- 5.1. Market Analysis, Insights and Forecast - by Source of Production
- 6. Global LPG Industry Analysis, Insights and Forecast, 2021-2033
- 6.1. Market Analysis, Insights and Forecast - by Source of Production
- 6.1.1. Crude Oil
- 6.1.2. Natural Gas Liquids
- 6.2. Market Analysis, Insights and Forecast - by Application
- 6.2.1. Residential
- 6.2.2. Commercial & Industrial
- 6.2.3. Autofuels
- 6.2.4. Other Applications
- 6.1. Market Analysis, Insights and Forecast - by Source of Production
- 7. North America LPG Industry Analysis, Insights and Forecast, 2020-2032
- 7.1. Market Analysis, Insights and Forecast - by Source of Production
- 7.1.1. Crude Oil
- 7.1.2. Natural Gas Liquids
- 7.2. Market Analysis, Insights and Forecast - by Application
- 7.2.1. Residential
- 7.2.2. Commercial & Industrial
- 7.2.3. Autofuels
- 7.2.4. Other Applications
- 7.1. Market Analysis, Insights and Forecast - by Source of Production
- 8. Europe LPG Industry Analysis, Insights and Forecast, 2020-2032
- 8.1. Market Analysis, Insights and Forecast - by Source of Production
- 8.1.1. Crude Oil
- 8.1.2. Natural Gas Liquids
- 8.2. Market Analysis, Insights and Forecast - by Application
- 8.2.1. Residential
- 8.2.2. Commercial & Industrial
- 8.2.3. Autofuels
- 8.2.4. Other Applications
- 8.1. Market Analysis, Insights and Forecast - by Source of Production
- 9. Asia Pacific LPG Industry Analysis, Insights and Forecast, 2020-2032
- 9.1. Market Analysis, Insights and Forecast - by Source of Production
- 9.1.1. Crude Oil
- 9.1.2. Natural Gas Liquids
- 9.2. Market Analysis, Insights and Forecast - by Application
- 9.2.1. Residential
- 9.2.2. Commercial & Industrial
- 9.2.3. Autofuels
- 9.2.4. Other Applications
- 9.1. Market Analysis, Insights and Forecast - by Source of Production
- 10. Middle East and Africa LPG Industry Analysis, Insights and Forecast, 2020-2032
- 10.1. Market Analysis, Insights and Forecast - by Source of Production
- 10.1.1. Crude Oil
- 10.1.2. Natural Gas Liquids
- 10.2. Market Analysis, Insights and Forecast - by Application
- 10.2.1. Residential
- 10.2.2. Commercial & Industrial
- 10.2.3. Autofuels
- 10.2.4. Other Applications
- 10.1. Market Analysis, Insights and Forecast - by Source of Production
- 11. South America LPG Industry Analysis, Insights and Forecast, 2020-2032
- 11.1. Market Analysis, Insights and Forecast - by Source of Production
- 11.1.1. Crude Oil
- 11.1.2. Natural Gas Liquids
- 11.2. Market Analysis, Insights and Forecast - by Application
- 11.2.1. Residential
- 11.2.2. Commercial & Industrial
- 11.2.3. Autofuels
- 11.2.4. Other Applications
- 11.1. Market Analysis, Insights and Forecast - by Source of Production
- 12. Competitive Analysis
- 12.1. Company Profiles
- 12.1.1 Exxon Mobil Corporation
- 12.1.1.1. Company Overview
- 12.1.1.2. Products
- 12.1.1.3. Company Financials
- 12.1.1.4. SWOT Analysis
- 12.1.2 Novatek PAO
- 12.1.2.1. Company Overview
- 12.1.2.2. Products
- 12.1.2.3. Company Financials
- 12.1.2.4. SWOT Analysis
- 12.1.3 China Petroleum & Chemical Corporation
- 12.1.3.1. Company Overview
- 12.1.3.2. Products
- 12.1.3.3. Company Financials
- 12.1.3.4. SWOT Analysis
- 12.1.4 ConocoPhillips
- 12.1.4.1. Company Overview
- 12.1.4.2. Products
- 12.1.4.3. Company Financials
- 12.1.4.4. SWOT Analysis
- 12.1.5 Reliance Gas*List Not Exhaustive
- 12.1.5.1. Company Overview
- 12.1.5.2. Products
- 12.1.5.3. Company Financials
- 12.1.5.4. SWOT Analysis
- 12.1.6 QatarEnergy
- 12.1.6.1. Company Overview
- 12.1.6.2. Products
- 12.1.6.3. Company Financials
- 12.1.6.4. SWOT Analysis
- 12.1.7 BP PLC
- 12.1.7.1. Company Overview
- 12.1.7.2. Products
- 12.1.7.3. Company Financials
- 12.1.7.4. SWOT Analysis
- 12.1.8 Indian Oil Corporation Ltd
- 12.1.8.1. Company Overview
- 12.1.8.2. Products
- 12.1.8.3. Company Financials
- 12.1.8.4. SWOT Analysis
- 12.1.9 Gazprom PJSC
- 12.1.9.1. Company Overview
- 12.1.9.2. Products
- 12.1.9.3. Company Financials
- 12.1.9.4. SWOT Analysis
- 12.1.10 Abu Dhabi National Oil Company (ADNOC)
- 12.1.10.1. Company Overview
- 12.1.10.2. Products
- 12.1.10.3. Company Financials
- 12.1.10.4. SWOT Analysis
- 12.1.1 Exxon Mobil Corporation
- 12.2. Market Entropy
- 12.2.1 Company's Key Areas Served
- 12.2.2 Recent Developments
- 12.3. Company Market Share Analysis 2025
- 12.3.1 Top 5 Companies Market Share Analysis
- 12.3.2 Top 3 Companies Market Share Analysis
- 12.4. List of Potential Customers
- 13. Research Methodology
List of Figures
- Figure 1: Global LPG Industry Revenue Breakdown (billion, %) by Region 2025 & 2033
- Figure 2: North America LPG Industry Revenue (billion), by Source of Production 2025 & 2033
- Figure 3: North America LPG Industry Revenue Share (%), by Source of Production 2025 & 2033
- Figure 4: North America LPG Industry Revenue (billion), by Application 2025 & 2033
- Figure 5: North America LPG Industry Revenue Share (%), by Application 2025 & 2033
- Figure 6: North America LPG Industry Revenue (billion), by Country 2025 & 2033
- Figure 7: North America LPG Industry Revenue Share (%), by Country 2025 & 2033
- Figure 8: Europe LPG Industry Revenue (billion), by Source of Production 2025 & 2033
- Figure 9: Europe LPG Industry Revenue Share (%), by Source of Production 2025 & 2033
- Figure 10: Europe LPG Industry Revenue (billion), by Application 2025 & 2033
- Figure 11: Europe LPG Industry Revenue Share (%), by Application 2025 & 2033
- Figure 12: Europe LPG Industry Revenue (billion), by Country 2025 & 2033
- Figure 13: Europe LPG Industry Revenue Share (%), by Country 2025 & 2033
- Figure 14: Asia Pacific LPG Industry Revenue (billion), by Source of Production 2025 & 2033
- Figure 15: Asia Pacific LPG Industry Revenue Share (%), by Source of Production 2025 & 2033
- Figure 16: Asia Pacific LPG Industry Revenue (billion), by Application 2025 & 2033
- Figure 17: Asia Pacific LPG Industry Revenue Share (%), by Application 2025 & 2033
- Figure 18: Asia Pacific LPG Industry Revenue (billion), by Country 2025 & 2033
- Figure 19: Asia Pacific LPG Industry Revenue Share (%), by Country 2025 & 2033
- Figure 20: Middle East and Africa LPG Industry Revenue (billion), by Source of Production 2025 & 2033
- Figure 21: Middle East and Africa LPG Industry Revenue Share (%), by Source of Production 2025 & 2033
- Figure 22: Middle East and Africa LPG Industry Revenue (billion), by Application 2025 & 2033
- Figure 23: Middle East and Africa LPG Industry Revenue Share (%), by Application 2025 & 2033
- Figure 24: Middle East and Africa LPG Industry Revenue (billion), by Country 2025 & 2033
- Figure 25: Middle East and Africa LPG Industry Revenue Share (%), by Country 2025 & 2033
- Figure 26: South America LPG Industry Revenue (billion), by Source of Production 2025 & 2033
- Figure 27: South America LPG Industry Revenue Share (%), by Source of Production 2025 & 2033
- Figure 28: South America LPG Industry Revenue (billion), by Application 2025 & 2033
- Figure 29: South America LPG Industry Revenue Share (%), by Application 2025 & 2033
- Figure 30: South America LPG Industry Revenue (billion), by Country 2025 & 2033
- Figure 31: South America LPG Industry Revenue Share (%), by Country 2025 & 2033
List of Tables
- Table 1: Global LPG Industry Revenue billion Forecast, by Source of Production 2020 & 2033
- Table 2: Global LPG Industry Revenue billion Forecast, by Application 2020 & 2033
- Table 3: Global LPG Industry Revenue billion Forecast, by Region 2020 & 2033
- Table 4: Global LPG Industry Revenue billion Forecast, by Source of Production 2020 & 2033
- Table 5: Global LPG Industry Revenue billion Forecast, by Application 2020 & 2033
- Table 6: Global LPG Industry Revenue billion Forecast, by Country 2020 & 2033
- Table 7: United States LPG Industry Revenue (billion) Forecast, by Application 2020 & 2033
- Table 8: Canada LPG Industry Revenue (billion) Forecast, by Application 2020 & 2033
- Table 9: Rest of North America LPG Industry Revenue (billion) Forecast, by Application 2020 & 2033
- Table 10: Global LPG Industry Revenue billion Forecast, by Source of Production 2020 & 2033
- Table 11: Global LPG Industry Revenue billion Forecast, by Application 2020 & 2033
- Table 12: Global LPG Industry Revenue billion Forecast, by Country 2020 & 2033
- Table 13: Norway LPG Industry Revenue (billion) Forecast, by Application 2020 & 2033
- Table 14: Netherlands LPG Industry Revenue (billion) Forecast, by Application 2020 & 2033
- Table 15: United Kingdom LPG Industry Revenue (billion) Forecast, by Application 2020 & 2033
- Table 16: Germany LPG Industry Revenue (billion) Forecast, by Application 2020 & 2033
- Table 17: Rest of Europe LPG Industry Revenue (billion) Forecast, by Application 2020 & 2033
- Table 18: Global LPG Industry Revenue billion Forecast, by Source of Production 2020 & 2033
- Table 19: Global LPG Industry Revenue billion Forecast, by Application 2020 & 2033
- Table 20: Global LPG Industry Revenue billion Forecast, by Country 2020 & 2033
- Table 21: China LPG Industry Revenue (billion) Forecast, by Application 2020 & 2033
- Table 22: India LPG Industry Revenue (billion) Forecast, by Application 2020 & 2033
- Table 23: South Korea LPG Industry Revenue (billion) Forecast, by Application 2020 & 2033
- Table 24: Japan LPG Industry Revenue (billion) Forecast, by Application 2020 & 2033
- Table 25: Rest of Asia Pacific LPG Industry Revenue (billion) Forecast, by Application 2020 & 2033
- Table 26: Global LPG Industry Revenue billion Forecast, by Source of Production 2020 & 2033
- Table 27: Global LPG Industry Revenue billion Forecast, by Application 2020 & 2033
- Table 28: Global LPG Industry Revenue billion Forecast, by Country 2020 & 2033
- Table 29: Saudi Arabia LPG Industry Revenue (billion) Forecast, by Application 2020 & 2033
- Table 30: Qatar LPG Industry Revenue (billion) Forecast, by Application 2020 & 2033
- Table 31: South Africa LPG Industry Revenue (billion) Forecast, by Application 2020 & 2033
- Table 32: Rest of Middle East and Africa LPG Industry Revenue (billion) Forecast, by Application 2020 & 2033
- Table 33: Global LPG Industry Revenue billion Forecast, by Source of Production 2020 & 2033
- Table 34: Global LPG Industry Revenue billion Forecast, by Application 2020 & 2033
- Table 35: Global LPG Industry Revenue billion Forecast, by Country 2020 & 2033
- Table 36: Brazil LPG Industry Revenue (billion) Forecast, by Application 2020 & 2033
- Table 37: Argentina LPG Industry Revenue (billion) Forecast, by Application 2020 & 2033
- Table 38: Chile LPG Industry Revenue (billion) Forecast, by Application 2020 & 2033
- Table 39: Rest of South America LPG Industry Revenue (billion) Forecast, by Application 2020 & 2033
Frequently Asked Questions
1. What is the projected Compound Annual Growth Rate (CAGR) of the LPG Industry?
The projected CAGR is approximately 3.9%.
2. Which companies are prominent players in the LPG Industry?
Key companies in the market include Exxon Mobil Corporation, Novatek PAO, China Petroleum & Chemical Corporation, ConocoPhillips, Reliance Gas*List Not Exhaustive, QatarEnergy, BP PLC, Indian Oil Corporation Ltd, Gazprom PJSC, Abu Dhabi National Oil Company (ADNOC).
3. What are the main segments of the LPG Industry?
The market segments include Source of Production, Application.
4. Can you provide details about the market size?
The market size is estimated to be USD 123.14 billion as of 2022.
5. What are some drivers contributing to market growth?
4.; Increasing Demand for Gasoline and Diesel Across the Globe4.; Rapid Expansion of Automotive Industry.
6. What are the notable trends driving market growth?
LPG Extracted from Natural Gas Liquids to Dominate the Market.
7. Are there any restraints impacting market growth?
4.; Strict Mandates by the Global Organizations on VGO Composition.
8. Can you provide examples of recent developments in the market?
In October 2022, Maire Tecnimont S.p.A. announced that its principal subsidiary, Tecnimont S.p.A., was awarded an EPC contract by SONATRACH's Direction Centrale Engineering & Project Management for the execution of an LPG extraction plant within the existing Rhourde El Baguel oil and gas treatment complex in northeastern Algeria. The total contract value is around USD 380 million.
9. What pricing options are available for accessing the report?
Pricing options include single-user, multi-user, and enterprise licenses priced at USD 4750, USD 5250, and USD 8750 respectively.
10. Is the market size provided in terms of value or volume?
The market size is provided in terms of value, measured in billion.
11. Are there any specific market keywords associated with the report?
Yes, the market keyword associated with the report is "LPG Industry," which aids in identifying and referencing the specific market segment covered.
12. How do I determine which pricing option suits my needs best?
The pricing options vary based on user requirements and access needs. Individual users may opt for single-user licenses, while businesses requiring broader access may choose multi-user or enterprise licenses for cost-effective access to the report.
13. Are there any additional resources or data provided in the LPG Industry report?
While the report offers comprehensive insights, it's advisable to review the specific contents or supplementary materials provided to ascertain if additional resources or data are available.
14. How can I stay updated on further developments or reports in the LPG Industry?
To stay informed about further developments, trends, and reports in the LPG Industry, consider subscribing to industry newsletters, following relevant companies and organizations, or regularly checking reputable industry news sources and publications.
Methodology
Step 1 - Identification of Relevant Samples Size from Population Database


Step 2 - Approaches for Defining Global Market Size (Value, Volume* & Price*)

Note*: In applicable scenarios
Step 3 - Data Sources
Primary Research
- Web Analytics
- Survey Reports
- Research Institute
- Latest Research Reports
- Opinion Leaders
Secondary Research
- Annual Reports
- White Paper
- Latest Press Release
- Industry Association
- Paid Database
- Investor Presentations

Step 4 - Data Triangulation
Involves using different sources of information in order to increase the validity of a study
These sources are likely to be stakeholders in a program - participants, other researchers, program staff, other community members, and so on.
Then we put all data in single framework & apply various statistical tools to find out the dynamic on the market.
During the analysis stage, feedback from the stakeholder groups would be compared to determine areas of agreement as well as areas of divergence