

Key Insights
The Molten Salt Thermal Energy Storage (MSTES) market is experiencing robust expansion, driven by the increasing adoption of renewable energy and the critical need for dependable energy storage solutions. With a projected Compound Annual Growth Rate (CAGR) of 9.8%, the market is set to grow from an estimated 2.22 billion in the base year of 2025. Key market drivers include the inherent intermittency of solar and wind power, which necessitates effective energy storage for grid stability and uninterrupted power supply. Government incentives and supportive policies further accelerate MSTES market penetration. Technological advancements in parabolic troughs, Fresnel reflectors, and power tower technologies are enhancing efficiency and reducing costs, contributing to market growth. While initial capital expenditure is a consideration, the long-term economic advantages of MSTES, such as reduced fossil fuel dependency and improved grid reliability, present a compelling case. Regional market dynamics reflect diverse renewable energy landscapes and varying levels of governmental support. North America, led by the United States, is expected to maintain a leading position due to significant investments in renewable infrastructure and advanced technology adoption. Europe and Asia-Pacific are also poised for substantial growth, driven by ambitious renewable energy targets and escalating energy storage demands. Leading entities such as SCHOTT AG, SolarReserve LLC, and Engie SA are instrumental in shaping the market through innovation and strategic alliances.
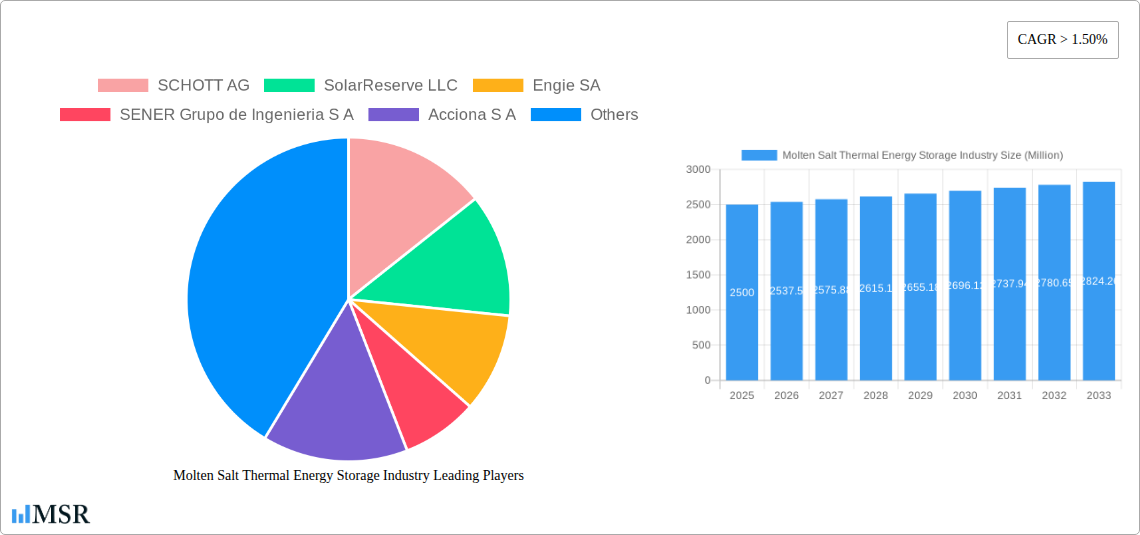
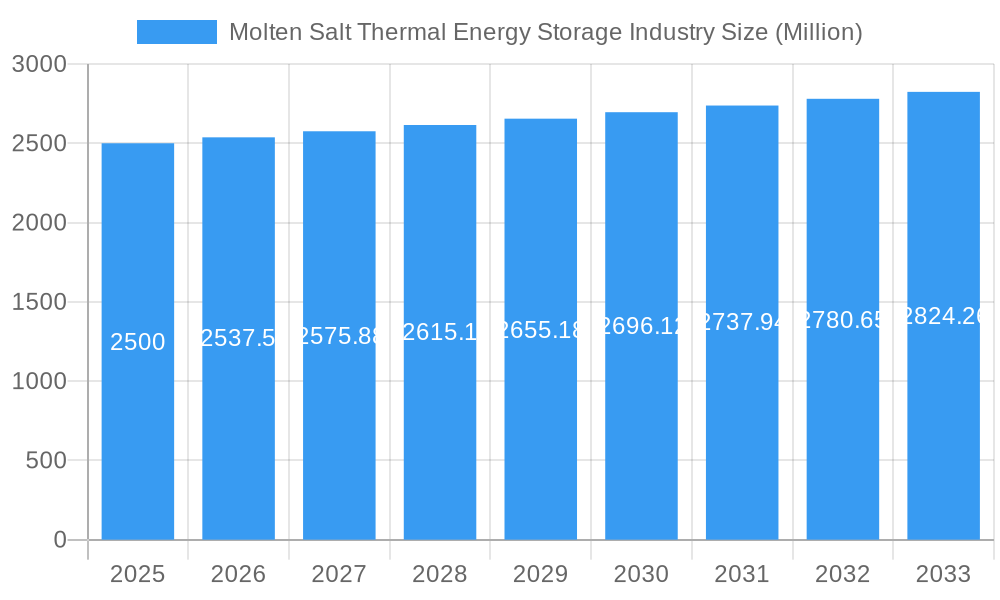
Molten Salt Thermal Energy Storage Industry Market Size (In Billion)
Market segmentation highlights significant opportunities across various MSTES technologies. Parabolic trough systems currently dominate market share, but Fresnel reflectors and power tower technologies are gaining momentum due to their potential for enhanced efficiency and scalability. Geographic distribution indicates concentrated activity in regions with established renewable energy sectors. Future market expansion hinges on addressing challenges such as high initial investment costs and the requirement for advanced materials to improve system longevity and performance. Continuous innovation in materials science, system design, and integration with renewable energy sources will be pivotal for sustained market development. The global shift towards decarbonization and the imperative to reduce fossil fuel reliance firmly position MSTES as a vital component of a sustainable energy future. This necessitates a collaborative strategy among governments, researchers, and industry stakeholders to overcome existing hurdles and fully leverage the potential of this transformative technology.
Molten Salt Thermal Energy Storage Industry Company Market Share
Molten Salt Thermal Energy Storage Industry: A Comprehensive Market Report (2019-2033)
This comprehensive report provides an in-depth analysis of the Molten Salt Thermal Energy Storage (MSTE) industry, offering valuable insights for stakeholders, investors, and industry professionals. With a study period spanning 2019-2033, a base year of 2025, and a forecast period of 2025-2033, this report meticulously examines market dynamics, technological advancements, and future growth potential. The global market size is estimated at $XX Million in 2025, projected to reach $XX Million by 2033, exhibiting a CAGR of XX%.
Molten Salt Thermal Energy Storage Industry Market Concentration & Dynamics
The Molten Salt Thermal Energy Storage (MSTE) market exhibits a moderately concentrated landscape, with key players like SCHOTT AG, SolarReserve LLC, Engie SA, SENER Grupo de Ingenieria S A, Acciona S A, Abengoa SA, Yara International ASA, and BrightSource Energy Inc. holding significant market share. However, the emergence of innovative startups and technological advancements is fostering increased competition.
Market share distribution in 2025 is estimated as follows: SCHOTT AG (XX%), SolarReserve LLC (XX%), Engie SA (XX%), SENER Grupo de Ingenieria S A (XX%), Acciona S A (XX%), Abengoa SA (XX%), Yara International ASA (XX%), and BrightSource Energy Inc (XX%). The remaining market share is distributed amongst smaller players and emerging companies.
- Innovation Ecosystems: Active research and development in materials science, thermal engineering, and control systems are driving innovation.
- Regulatory Frameworks: Government policies promoting renewable energy integration and carbon emission reduction are positively impacting market growth. Subsidies and tax incentives are playing a significant role.
- Substitute Products: Other energy storage technologies, such as pumped hydro and battery storage, pose competitive challenges. However, MSTE’s unique advantages in terms of long-duration storage and high-temperature applications offer a distinct competitive edge.
- End-User Trends: The increasing demand for reliable and efficient energy storage solutions from various sectors, including power generation, industrial processes, and district heating, is fueling market growth.
- M&A Activities: The MSTE sector has witnessed a moderate level of merger and acquisition (M&A) activity in recent years, with approximately XX deals recorded between 2019 and 2024. These activities indicate consolidation and expansion strategies within the industry.
Molten Salt Thermal Energy Storage Industry Industry Insights & Trends
The MSTE industry is experiencing significant growth driven by factors such as the increasing need for grid stability in renewable energy systems, the rising demand for long-duration energy storage, and stringent environmental regulations. Technological advancements, including improved molten salt materials and enhanced thermal management systems, are contributing to increased efficiency and reduced costs. Consumer behaviors are shifting towards sustainable energy solutions, creating a favorable environment for MSTE adoption. The market size is estimated at $XX Million in 2025, projected to reach $XX Million by 2033, exhibiting a CAGR of XX%. This growth is fueled by several factors including:
- Increased renewable energy penetration: The growing adoption of solar and wind power necessitates effective energy storage solutions to address intermittency issues.
- Government policies and incentives: Supportive government policies and financial incentives are promoting the development and deployment of MSTE technologies.
- Technological advancements: Ongoing research and development efforts are leading to improvements in efficiency, cost-effectiveness, and safety of MSTE systems.
- Cost reduction: The declining cost of molten salt materials and manufacturing processes is making MSTE more competitive compared to other energy storage technologies.
Key Markets & Segments Leading Molten Salt Thermal Energy Storage Industry
The MSTE market is geographically diverse, with significant adoption across various regions. However, [Dominant Region/Country - e.g., North America, China, or Europe] currently holds a leading position, driven by strong government support for renewable energy integration and substantial investments in energy infrastructure.
Technology Segmentation:
- Parabolic Troughs: This technology is currently the most mature and widely deployed, benefiting from established supply chains and economies of scale. The high temperature heat obtained from parabolic troughs is a suitable energy source for several industries.
- Fresnel Reflector: Fresnel reflector systems offer potential for cost reduction through simplified designs, but face challenges related to efficiency and operational reliability.
- Power Tower: Power tower systems boast higher potential efficiencies but remain more capital-intensive and technically complex, leading to fewer deployments than parabolic troughs.
Drivers for Dominance in [Dominant Region/Country]:
- Strong government policies supporting renewable energy integration.
- Significant investments in grid modernization and infrastructure development.
- Abundant solar resources and favorable climatic conditions.
- Growing industrial demand for high-temperature thermal energy storage.
Molten Salt Thermal Energy Storage Industry Product Developments
Recent product innovations focus on improving the efficiency, safety, and cost-effectiveness of MSTE systems. Advancements in molten salt materials, improved thermal management technologies, and enhanced control systems are enhancing the performance and reliability of these systems. These developments provide significant competitive advantages, particularly in terms of extended operational life, higher energy density, and reduced maintenance requirements. The development of next-generation molten salt materials with enhanced thermal properties is a key area of focus.
Challenges in the Molten Salt Thermal Energy Storage Industry Market
Several challenges hinder the widespread adoption of MSTE technology, including:
- High initial capital costs: The high upfront investment required for MSTE systems can be a barrier for many potential users.
- Material availability and cost: The availability and cost of specialized molten salts can impact the overall cost-effectiveness of the technology.
- Thermal management complexity: Managing the high temperatures and thermal stresses associated with molten salt systems requires sophisticated engineering solutions.
- Safety concerns: Addressing safety concerns associated with handling molten salts is crucial for widespread acceptance.
Forces Driving Molten Salt Thermal Energy Storage Industry Growth
The MSTE industry's growth is propelled by several key factors, such as:
- Increased renewable energy adoption: The rising adoption of solar and wind power necessitates efficient energy storage solutions.
- Government incentives and policies: Supportive government policies and financial incentives are accelerating market growth.
- Technological advancements: Improvements in molten salt materials and system designs are enhancing efficiency and reducing costs.
- Falling costs: The declining cost of components and manufacturing is making MSTE more affordable.
Challenges in the Molten Salt Thermal Energy Storage Industry Market
Long-term growth catalysts include:
Continued research and development leading to improved efficiency and cost reductions, strategic partnerships between technology providers and energy companies, expansion into new market segments such as industrial process heat and district heating, and increasing awareness and acceptance among consumers and businesses regarding the benefits of sustainable energy solutions.
Emerging Opportunities in Molten Salt Thermal Energy Storage Industry
Emerging opportunities include:
Expansion into new geographic markets, development of hybrid energy storage systems integrating MSTE with other technologies, application in industrial process heat and district heating, and the growing adoption of MSTE in microgrids and off-grid power systems.
Leading Players in the Molten Salt Thermal Energy Storage Industry Sector
- SCHOTT AG
- SolarReserve LLC
- Engie SA
- SENER Grupo de Ingenieria S A
- Acciona S A
- Abengoa SA
- Yara International ASA
- BrightSource Energy Inc
Key Milestones in Molten Salt Thermal Energy Storage Industry Industry
- November 2022: Hyme Energy ApS partnered with Bornholms Energi & Forsyning (BEOF) to build a 1 MW/20 MWh molten salt thermal energy storage demonstrator in Denmark, scheduled for completion in 2024. This project highlights the growing interest in smaller-scale MSTE deployments and its potential for providing multiple energy services.
Strategic Outlook for Molten Salt Thermal Energy Storage Industry Market
The future of the MSTE market looks promising, with substantial growth potential driven by increasing renewable energy adoption, supportive government policies, and continuous technological advancements. Strategic partnerships and collaborations will play a key role in accelerating market penetration and driving innovation. The focus on cost reduction, improved safety, and enhanced efficiency will be critical in ensuring the long-term success and wider adoption of MSTE technology.
Molten Salt Thermal Energy Storage Industry Segmentation
-
1. Technology
- 1.1. Parabolic Troughs
- 1.2. Fresnel Reflector
- 1.3. Power Tower
Molten Salt Thermal Energy Storage Industry Segmentation By Geography
- 1. North America
- 2. Asia Pacific
- 3. Europe
- 4. South America
- 5. Middle East and Africa
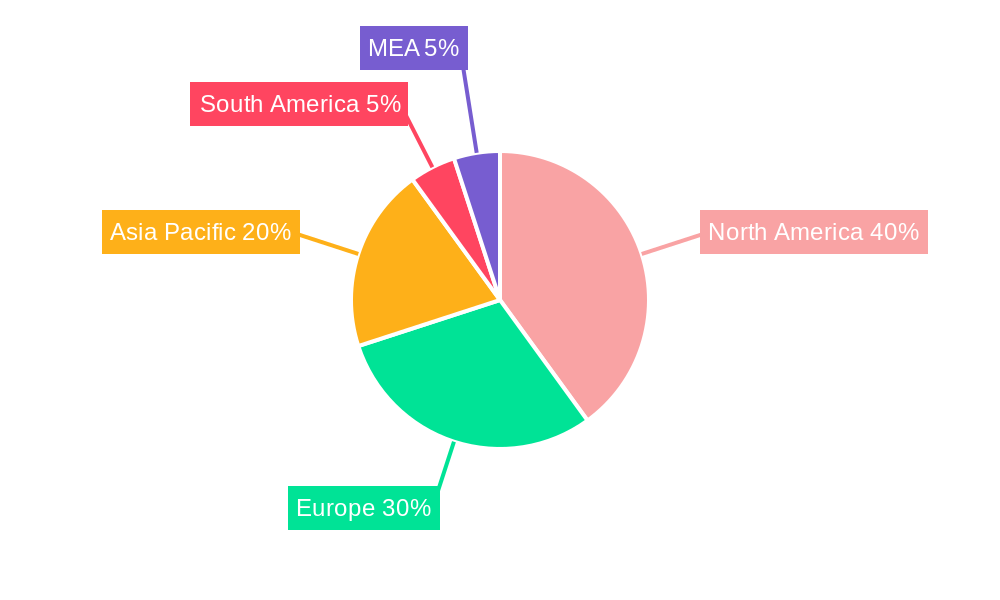
Molten Salt Thermal Energy Storage Industry Regional Market Share
Geographic Coverage of Molten Salt Thermal Energy Storage Industry
Molten Salt Thermal Energy Storage Industry REPORT HIGHLIGHTS
| Aspects | Details |
|---|---|
| Study Period | 2020-2034 |
| Base Year | 2025 |
| Estimated Year | 2026 |
| Forecast Period | 2026-2034 |
| Historical Period | 2020-2025 |
| Growth Rate | CAGR of 9.8% from 2020-2034 |
| Segmentation |
|
Table of Contents
- 1. Introduction
- 1.1. Research Scope
- 1.2. Market Segmentation
- 1.3. Research Objective
- 1.4. Definitions and Assumptions
- 2. Executive Summary
- 2.1. Market Snapshot
- 3. Market Dynamics
- 3.1. Market Drivers
- 3.2. Market Restrains
- 3.3. Market Trends
- 3.4. Market Opportunities
- 4. Market Factor Analysis
- 4.1. Porters Five Forces
- 4.1.1. Bargaining Power of Suppliers
- 4.1.2. Bargaining Power of Buyers
- 4.1.3. Threat of New Entrants
- 4.1.4. Threat of Substitutes
- 4.1.5. Competitive Rivalry
- 4.2. PESTEL analysis
- 4.3. BCG Analysis
- 4.3.1. Stars (High Growth, High Market Share)
- 4.3.2. Cash Cows (Low Growth, High Market Share)
- 4.3.3. Question Mark (High Growth, Low Market Share)
- 4.3.4. Dogs (Low Growth, Low Market Share)
- 4.4. Ansoff Matrix Analysis
- 4.5. Supply Chain Analysis
- 4.6. Regulatory Landscape
- 4.7. Current Market Potential and Opportunity Assessment (TAM–SAM–SOM Framework)
- 4.8. MSR Analyst Note
- 4.1. Porters Five Forces
- 5. Market Analysis, Insights and Forecast 2021-2033
- 5.1. Market Analysis, Insights and Forecast - by Technology
- 5.1.1. Parabolic Troughs
- 5.1.2. Fresnel Reflector
- 5.1.3. Power Tower
- 5.2. Market Analysis, Insights and Forecast - by Region
- 5.2.1. North America
- 5.2.2. Asia Pacific
- 5.2.3. Europe
- 5.2.4. South America
- 5.2.5. Middle East and Africa
- 5.1. Market Analysis, Insights and Forecast - by Technology
- 6. Global Molten Salt Thermal Energy Storage Industry Analysis, Insights and Forecast, 2021-2033
- 6.1. Market Analysis, Insights and Forecast - by Technology
- 6.1.1. Parabolic Troughs
- 6.1.2. Fresnel Reflector
- 6.1.3. Power Tower
- 6.1. Market Analysis, Insights and Forecast - by Technology
- 7. North America Molten Salt Thermal Energy Storage Industry Analysis, Insights and Forecast, 2020-2032
- 7.1. Market Analysis, Insights and Forecast - by Technology
- 7.1.1. Parabolic Troughs
- 7.1.2. Fresnel Reflector
- 7.1.3. Power Tower
- 7.1. Market Analysis, Insights and Forecast - by Technology
- 8. Asia Pacific Molten Salt Thermal Energy Storage Industry Analysis, Insights and Forecast, 2020-2032
- 8.1. Market Analysis, Insights and Forecast - by Technology
- 8.1.1. Parabolic Troughs
- 8.1.2. Fresnel Reflector
- 8.1.3. Power Tower
- 8.1. Market Analysis, Insights and Forecast - by Technology
- 9. Europe Molten Salt Thermal Energy Storage Industry Analysis, Insights and Forecast, 2020-2032
- 9.1. Market Analysis, Insights and Forecast - by Technology
- 9.1.1. Parabolic Troughs
- 9.1.2. Fresnel Reflector
- 9.1.3. Power Tower
- 9.1. Market Analysis, Insights and Forecast - by Technology
- 10. South America Molten Salt Thermal Energy Storage Industry Analysis, Insights and Forecast, 2020-2032
- 10.1. Market Analysis, Insights and Forecast - by Technology
- 10.1.1. Parabolic Troughs
- 10.1.2. Fresnel Reflector
- 10.1.3. Power Tower
- 10.1. Market Analysis, Insights and Forecast - by Technology
- 11. Middle East and Africa Molten Salt Thermal Energy Storage Industry Analysis, Insights and Forecast, 2020-2032
- 11.1. Market Analysis, Insights and Forecast - by Technology
- 11.1.1. Parabolic Troughs
- 11.1.2. Fresnel Reflector
- 11.1.3. Power Tower
- 11.1. Market Analysis, Insights and Forecast - by Technology
- 12. Competitive Analysis
- 12.1. Company Profiles
- 12.1.1 SCHOTT AG
- 12.1.1.1. Company Overview
- 12.1.1.2. Products
- 12.1.1.3. Company Financials
- 12.1.1.4. SWOT Analysis
- 12.1.2 SolarReserve LLC
- 12.1.2.1. Company Overview
- 12.1.2.2. Products
- 12.1.2.3. Company Financials
- 12.1.2.4. SWOT Analysis
- 12.1.3 Engie SA
- 12.1.3.1. Company Overview
- 12.1.3.2. Products
- 12.1.3.3. Company Financials
- 12.1.3.4. SWOT Analysis
- 12.1.4 SENER Grupo de Ingenieria S A
- 12.1.4.1. Company Overview
- 12.1.4.2. Products
- 12.1.4.3. Company Financials
- 12.1.4.4. SWOT Analysis
- 12.1.5 Acciona S A
- 12.1.5.1. Company Overview
- 12.1.5.2. Products
- 12.1.5.3. Company Financials
- 12.1.5.4. SWOT Analysis
- 12.1.6 Abengoa SA
- 12.1.6.1. Company Overview
- 12.1.6.2. Products
- 12.1.6.3. Company Financials
- 12.1.6.4. SWOT Analysis
- 12.1.7 Yara International ASA
- 12.1.7.1. Company Overview
- 12.1.7.2. Products
- 12.1.7.3. Company Financials
- 12.1.7.4. SWOT Analysis
- 12.1.8 BrightSource Energy Inc
- 12.1.8.1. Company Overview
- 12.1.8.2. Products
- 12.1.8.3. Company Financials
- 12.1.8.4. SWOT Analysis
- 12.1.1 SCHOTT AG
- 12.2. Market Entropy
- 12.2.1 Company's Key Areas Served
- 12.2.2 Recent Developments
- 12.3. Company Market Share Analysis 2025
- 12.3.1 Top 5 Companies Market Share Analysis
- 12.3.2 Top 3 Companies Market Share Analysis
- 12.4. List of Potential Customers
- 13. Research Methodology
List of Figures
- Figure 1: Global Molten Salt Thermal Energy Storage Industry Revenue Breakdown (billion, %) by Region 2025 & 2033
- Figure 2: North America Molten Salt Thermal Energy Storage Industry Revenue (billion), by Technology 2025 & 2033
- Figure 3: North America Molten Salt Thermal Energy Storage Industry Revenue Share (%), by Technology 2025 & 2033
- Figure 4: North America Molten Salt Thermal Energy Storage Industry Revenue (billion), by Country 2025 & 2033
- Figure 5: North America Molten Salt Thermal Energy Storage Industry Revenue Share (%), by Country 2025 & 2033
- Figure 6: Asia Pacific Molten Salt Thermal Energy Storage Industry Revenue (billion), by Technology 2025 & 2033
- Figure 7: Asia Pacific Molten Salt Thermal Energy Storage Industry Revenue Share (%), by Technology 2025 & 2033
- Figure 8: Asia Pacific Molten Salt Thermal Energy Storage Industry Revenue (billion), by Country 2025 & 2033
- Figure 9: Asia Pacific Molten Salt Thermal Energy Storage Industry Revenue Share (%), by Country 2025 & 2033
- Figure 10: Europe Molten Salt Thermal Energy Storage Industry Revenue (billion), by Technology 2025 & 2033
- Figure 11: Europe Molten Salt Thermal Energy Storage Industry Revenue Share (%), by Technology 2025 & 2033
- Figure 12: Europe Molten Salt Thermal Energy Storage Industry Revenue (billion), by Country 2025 & 2033
- Figure 13: Europe Molten Salt Thermal Energy Storage Industry Revenue Share (%), by Country 2025 & 2033
- Figure 14: South America Molten Salt Thermal Energy Storage Industry Revenue (billion), by Technology 2025 & 2033
- Figure 15: South America Molten Salt Thermal Energy Storage Industry Revenue Share (%), by Technology 2025 & 2033
- Figure 16: South America Molten Salt Thermal Energy Storage Industry Revenue (billion), by Country 2025 & 2033
- Figure 17: South America Molten Salt Thermal Energy Storage Industry Revenue Share (%), by Country 2025 & 2033
- Figure 18: Middle East and Africa Molten Salt Thermal Energy Storage Industry Revenue (billion), by Technology 2025 & 2033
- Figure 19: Middle East and Africa Molten Salt Thermal Energy Storage Industry Revenue Share (%), by Technology 2025 & 2033
- Figure 20: Middle East and Africa Molten Salt Thermal Energy Storage Industry Revenue (billion), by Country 2025 & 2033
- Figure 21: Middle East and Africa Molten Salt Thermal Energy Storage Industry Revenue Share (%), by Country 2025 & 2033
List of Tables
- Table 1: Global Molten Salt Thermal Energy Storage Industry Revenue billion Forecast, by Technology 2020 & 2033
- Table 2: Global Molten Salt Thermal Energy Storage Industry Revenue billion Forecast, by Region 2020 & 2033
- Table 3: Global Molten Salt Thermal Energy Storage Industry Revenue billion Forecast, by Technology 2020 & 2033
- Table 4: Global Molten Salt Thermal Energy Storage Industry Revenue billion Forecast, by Country 2020 & 2033
- Table 5: Global Molten Salt Thermal Energy Storage Industry Revenue billion Forecast, by Technology 2020 & 2033
- Table 6: Global Molten Salt Thermal Energy Storage Industry Revenue billion Forecast, by Country 2020 & 2033
- Table 7: Global Molten Salt Thermal Energy Storage Industry Revenue billion Forecast, by Technology 2020 & 2033
- Table 8: Global Molten Salt Thermal Energy Storage Industry Revenue billion Forecast, by Country 2020 & 2033
- Table 9: Global Molten Salt Thermal Energy Storage Industry Revenue billion Forecast, by Technology 2020 & 2033
- Table 10: Global Molten Salt Thermal Energy Storage Industry Revenue billion Forecast, by Country 2020 & 2033
- Table 11: Global Molten Salt Thermal Energy Storage Industry Revenue billion Forecast, by Technology 2020 & 2033
- Table 12: Global Molten Salt Thermal Energy Storage Industry Revenue billion Forecast, by Country 2020 & 2033
Frequently Asked Questions
1. What is the projected Compound Annual Growth Rate (CAGR) of the Molten Salt Thermal Energy Storage Industry?
The projected CAGR is approximately 9.8%.
2. Which companies are prominent players in the Molten Salt Thermal Energy Storage Industry?
Key companies in the market include SCHOTT AG, SolarReserve LLC, Engie SA, SENER Grupo de Ingenieria S A, Acciona S A, Abengoa SA, Yara International ASA, BrightSource Energy Inc.
3. What are the main segments of the Molten Salt Thermal Energy Storage Industry?
The market segments include Technology.
4. Can you provide details about the market size?
The market size is estimated to be USD 2.22 billion as of 2022.
5. What are some drivers contributing to market growth?
4.; Increasing Investments in Offshore Wind Power Projects4.; Supportive Government Policies.
6. What are the notable trends driving market growth?
Parabolic Trough Segment to Dominate the Market.
7. Are there any restraints impacting market growth?
4.; Increasing Adopting of Alternative Clean Energy Sources (Ex: Solar. Hydro).
8. Can you provide examples of recent developments in the market?
November 2022: Hyme Energy ApS announced that the company is partnering with Bornholms Energi & Forsyning (BEOF) to build its first molten salt thermal energy storage demonstrator on the Danish island of Bornholm. The storage facility is scheduled for completion in 2024 and will have a capacity of 1 MW/20 MWh. It will provide heat, power, and ancillary services to the local network.
9. What pricing options are available for accessing the report?
Pricing options include single-user, multi-user, and enterprise licenses priced at USD 4750, USD 5250, and USD 8750 respectively.
10. Is the market size provided in terms of value or volume?
The market size is provided in terms of value, measured in billion.
11. Are there any specific market keywords associated with the report?
Yes, the market keyword associated with the report is "Molten Salt Thermal Energy Storage Industry," which aids in identifying and referencing the specific market segment covered.
12. How do I determine which pricing option suits my needs best?
The pricing options vary based on user requirements and access needs. Individual users may opt for single-user licenses, while businesses requiring broader access may choose multi-user or enterprise licenses for cost-effective access to the report.
13. Are there any additional resources or data provided in the Molten Salt Thermal Energy Storage Industry report?
While the report offers comprehensive insights, it's advisable to review the specific contents or supplementary materials provided to ascertain if additional resources or data are available.
14. How can I stay updated on further developments or reports in the Molten Salt Thermal Energy Storage Industry?
To stay informed about further developments, trends, and reports in the Molten Salt Thermal Energy Storage Industry, consider subscribing to industry newsletters, following relevant companies and organizations, or regularly checking reputable industry news sources and publications.
Methodology
Step 1 - Identification of Relevant Samples Size from Population Database


Step 2 - Approaches for Defining Global Market Size (Value, Volume* & Price*)

Note*: In applicable scenarios
Step 3 - Data Sources
Primary Research
- Web Analytics
- Survey Reports
- Research Institute
- Latest Research Reports
- Opinion Leaders
Secondary Research
- Annual Reports
- White Paper
- Latest Press Release
- Industry Association
- Paid Database
- Investor Presentations

Step 4 - Data Triangulation
Involves using different sources of information in order to increase the validity of a study
These sources are likely to be stakeholders in a program - participants, other researchers, program staff, other community members, and so on.
Then we put all data in single framework & apply various statistical tools to find out the dynamic on the market.
During the analysis stage, feedback from the stakeholder groups would be compared to determine areas of agreement as well as areas of divergence