

Key Insights
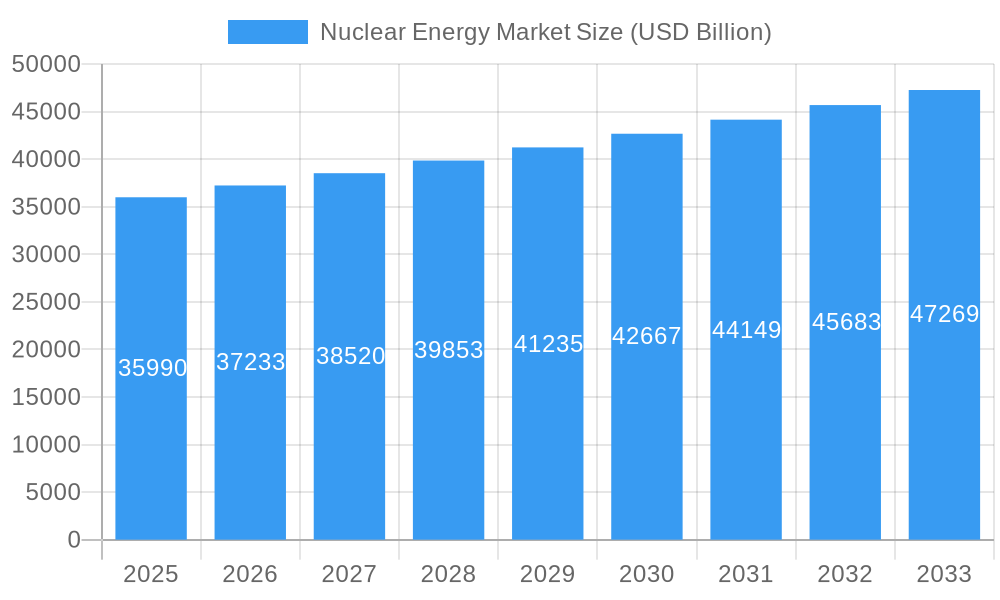
The global nuclear energy market, valued at $35.99 billion in 2025, is projected to experience steady growth, with a compound annual growth rate (CAGR) of 3.4% from 2025 to 2033. This growth is driven by several factors. Firstly, increasing concerns about climate change and the need for reliable, low-carbon energy sources are fueling demand for nuclear power. Secondly, advancements in reactor technology, particularly in the development of safer and more efficient designs like Small Modular Reactors (SMRs), are contributing to the sector's expansion. Furthermore, government policies promoting nuclear energy, particularly in countries aiming for energy independence, are creating a favorable investment environment. However, the market also faces challenges, including high upfront capital costs associated with nuclear power plant construction, strict regulatory hurdles, and public perception issues related to nuclear safety and waste disposal. These factors can potentially restrain growth, necessitating strategic investments in safety improvements and public awareness campaigns. The market is segmented by reactor type (Pressurized Water Reactor, Pressurized Heavy Water Reactor, Boiling Water Reactor, High-temperature Gas-cooled Reactor, Liquid-metal Fast-breeder Reactor, and Others) and application (energy, defense, and others), providing opportunities for specialized players. Key market players include BWX Technologies, Westinghouse Electric Company, and Rosatom, among others, strategically competing through technological innovation and geographical expansion. The Asia-Pacific region, driven by strong growth in countries like China and India, is expected to dominate the market, while North America and Europe will maintain substantial shares.
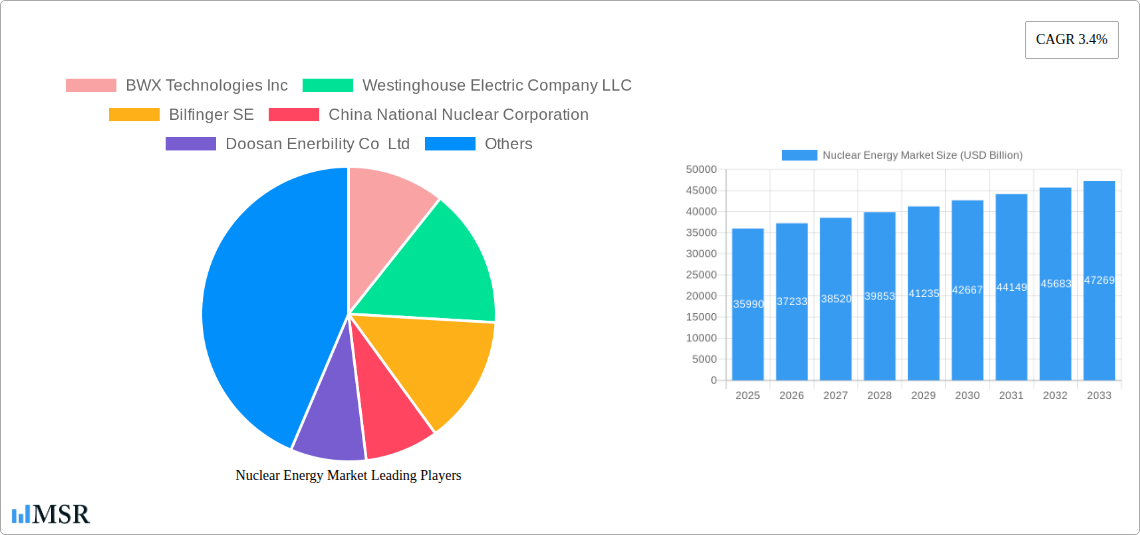
Nuclear Energy Market Market Size (In Billion)
The competitive landscape is characterized by both established players and emerging companies. Established players are focusing on enhancing existing technologies and expanding their global footprint, while newer entrants are challenging the market with innovative reactor designs and cost-effective solutions. Geographic expansion remains a key strategy, with companies focusing on developing projects in regions with supportive regulatory frameworks and growing energy demands. The forecast period (2025-2033) will likely see a shift towards more sustainable nuclear power practices, including enhanced safety measures and improved waste management solutions, shaping the future trajectory of the market. This evolution will be driven by a combination of technological advancements, stricter environmental regulations, and increasing public awareness regarding environmental protection.
Nuclear Energy Market Company Market Share
Nuclear Energy Market Report: 2019-2033 Forecast
This comprehensive report provides an in-depth analysis of the global nuclear energy market, offering invaluable insights for industry stakeholders, investors, and policymakers. With a detailed study period spanning from 2019 to 2033, including a base year of 2025 and a forecast period from 2025-2033, this report offers a granular understanding of market dynamics, technological advancements, and future growth trajectories. The market is projected to reach USD xx Billion by 2033, exhibiting a compelling CAGR of xx%.
Nuclear Energy Market Market Concentration & Dynamics
The global nuclear energy market exhibits a moderately concentrated structure, with a handful of major players holding significant market share. However, the landscape is dynamic, characterized by ongoing innovation, evolving regulatory frameworks, and strategic mergers and acquisitions (M&A) activities. Key factors influencing market concentration include technological advancements in reactor designs, stringent safety regulations, and the increasing demand for low-carbon energy sources.
Market share analysis reveals that the top 6 players account for approximately 64% of the global market, underscoring the presence of dominant players. The M&A activity within the sector has witnessed xx deals over the past five years, highlighting strategic consolidation and expansion efforts by key players. This has led to the emergence of larger entities capable of undertaking large-scale projects and driving innovation.
- Market Concentration: Top 6 players hold ~64% market share.
- Innovation: Focus on advanced reactor designs (e.g., SMRs) and fuel technologies.
- Regulatory Frameworks: Stringent safety and security regulations vary across regions.
- Substitute Products: Competition from renewable energy sources, particularly solar and wind.
- End-User Trends: Growing demand for reliable and clean baseload power.
- M&A Activity: xx deals in the last five years, indicative of industry consolidation.
Nuclear Energy Market Industry Insights & Trends
The nuclear energy market is experiencing a period of significant transformation, driven by several key factors. The global market size reached USD xx Billion in 2024, and is projected to reach USD xx Billion by 2033, reflecting a CAGR of xx%. Several key factors are driving this growth. The increasing urgency to reduce greenhouse gas emissions is leading to renewed interest in nuclear power as a reliable, low-carbon energy source. Technological advancements, such as the development of Small Modular Reactors (SMRs) and advanced fuel cycles, are improving the efficiency, safety, and cost-effectiveness of nuclear power plants. Further, government policies and incentives aimed at promoting clean energy are creating favorable conditions for nuclear power development. However, the industry still faces challenges, such as public perception, regulatory hurdles, and the high capital cost of new plants. Despite these challenges, the long-term outlook for the nuclear energy market remains positive, fueled by the rising global demand for energy and the growing need for clean energy solutions. The market is also subject to significant geopolitical influence and international collaboration plays a crucial role.
Key Markets & Segments Leading Nuclear Energy Market
While the market is global, certain regions and reactor types hold a dominant position. Asia, particularly China, is a key driver of market growth, fueled by rapid economic growth and expanding energy demand. The Pressurized Water Reactor (PWR) segment constitutes the largest share of the reactor market, owing to its established technology and widespread adoption.
- Dominant Region: Asia (China, India, Japan)
- Dominant Reactor Type: Pressurized Water Reactor (PWR)
- Drivers:
- Economic Growth: Rapid economic expansion in several regions is increasing energy demand.
- Energy Security: Nuclear power offers a stable and reliable energy supply.
- Climate Change Mitigation: Growing emphasis on reducing carbon emissions.
- Infrastructure Development: Investments in new nuclear power plants.
The Energy application segment dominates the nuclear energy market, followed by the Defense sector. The other applications segment is still relatively small but holds potential for future growth.
Nuclear Energy Market Product Developments
Recent years have witnessed significant advancements in nuclear reactor technology, particularly with the development of Small Modular Reactors (SMRs). SMRs offer advantages in terms of safety, cost-effectiveness, and deployment flexibility. These advancements, along with improvements in fuel efficiency and waste management, are enhancing the competitiveness of nuclear power. Additionally, innovations in digital technologies and artificial intelligence are improving the operation and maintenance of nuclear power plants. These product developments are reshaping the nuclear energy landscape and creating new market opportunities.
Challenges in the Nuclear Energy Market Market
The nuclear energy market faces several challenges. Stringent safety and security regulations, along with high capital costs, pose significant barriers to entry and market expansion. Supply chain issues relating to specialized materials and components can also impact project timelines and costs. Public perception and concerns surrounding nuclear waste disposal remain a significant challenge to wider acceptance of the technology. Furthermore, intense competition from renewable energy sources and fluctuating energy prices affect market dynamics.
Forces Driving Nuclear Energy Market Growth
Several factors are driving the growth of the nuclear energy market. The increasing demand for reliable and clean baseload power, coupled with the urgency to decarbonize the energy sector, is boosting investment in nuclear energy infrastructure. Government incentives and policies aimed at promoting nuclear power development are further creating favorable market conditions. Technological advancements, such as the development of SMRs and advanced fuel cycles, are enhancing the efficiency, safety, and economic viability of nuclear power plants, driving further market expansion. The global effort to minimize carbon emissions also significantly influences this market.
Long-Term Growth Catalysts in Nuclear Energy Market
Long-term growth in the nuclear energy market will be fueled by continued technological innovation, particularly in areas such as SMR development and advanced reactor designs. Strategic partnerships between governments, utilities, and technology providers will play a vital role in accelerating the deployment of new nuclear power plants. Expansion into new markets, especially in developing economies with rapidly growing energy demands, will further contribute to market growth. Overall, the commitment to reducing carbon emissions and ensuring energy security provides a robust foundation for long-term expansion.
Emerging Opportunities in Nuclear Energy Market
Emerging opportunities in the nuclear energy market include the increasing demand for SMRs for distributed generation, the potential for nuclear hydrogen production, and the growing interest in advanced nuclear fuel cycles. Expansion into new geographic markets, particularly those experiencing rapid economic growth and a shortage of energy, is presenting significant growth avenues. Furthermore, the development of innovative financing models is addressing the high capital costs associated with nuclear power plants.
Leading Players in the Nuclear Energy Market Sector
- BWX Technologies Inc
- Westinghouse Electric Company LLC
- Bilfinger SE
- China National Nuclear Corporation
- Doosan Enerbility Co Ltd
- SKODA JS AS
- Electricite de France SA (EDF)
- Rosatom State Atomic Energy Corporation
- Bechtel Group Inc
- KEPCO Engineering & Construction
- Japan Atomic Power Company
- Duke Energy Corporation
- Mitsubishi Heavy Industries Ltd
- GE-Hitachi Nuclear Energy Inc
Key Milestones in Nuclear Energy Market Industry
- January 2024: The UK government announced plans for a significant expansion of nuclear power, investing approximately USD 382 million in advanced uranium fuel production. This demonstrates a commitment to energy independence and carbon emission reduction targets.
- February 2024: India announced plans to add 18 new nuclear reactors, increasing its nuclear power capacity significantly by 2031-2032. This reflects India's ambition to enhance its energy security and reduce its reliance on fossil fuels.
- February 2024: Iran commenced construction of four new nuclear power plants (5,000 MW total capacity), signifying significant investment in nuclear power despite international concerns. This highlights the geopolitical importance of nuclear energy.
Strategic Outlook for Nuclear Energy Market Market
The future of the nuclear energy market is bright, driven by the growing global demand for reliable and clean energy, coupled with advancements in reactor technology and cost reductions. Strategic opportunities lie in developing innovative financing models, fostering international collaboration, and addressing public perception challenges. The focus on SMRs, advanced fuel cycles, and next-generation reactor designs will shape the industry's growth trajectory in the coming years. The market's future is intertwined with global climate change mitigation efforts and the continuous search for sustainable energy solutions.
Nuclear Energy Market Segmentation
-
1. Application (Qualitative Analysis)
- 1.1. Energy
- 1.2. Defense
- 1.3. Other Applications
-
2. Reactor Type
- 2.1. Pressuri
- 2.2. Boiling Water Reactor
- 2.3. High-temperature Gas-cooled Reactor
- 2.4. Liquid-metal Fast-breeder Reactor
- 2.5. Other Reactor Types
Nuclear Energy Market Segmentation By Geography
-
1. North America
- 1.1. United States
- 1.2. Canada
- 1.3. Rest of North America
-
2. Europe
- 2.1. Germany
- 2.2. United Kingdom
- 2.3. Russia
- 2.4. France
- 2.5. Rest of Europe
-
3. Asia Pacific
- 3.1. China
- 3.2. India
- 3.3. Japan
- 3.4. South Korea
- 3.5. Rest of Asia Pacific
-
4. South America
- 4.1. Brazil
- 4.2. Argentina
- 4.3. Rest of South America
-
5. Middle East and Africa
- 5.1. United Arab Emirates
- 5.2. Saudi Arabia
- 5.3. South Africa
- 5.4. Iran
- 5.5. Rest of Middle East and Africa
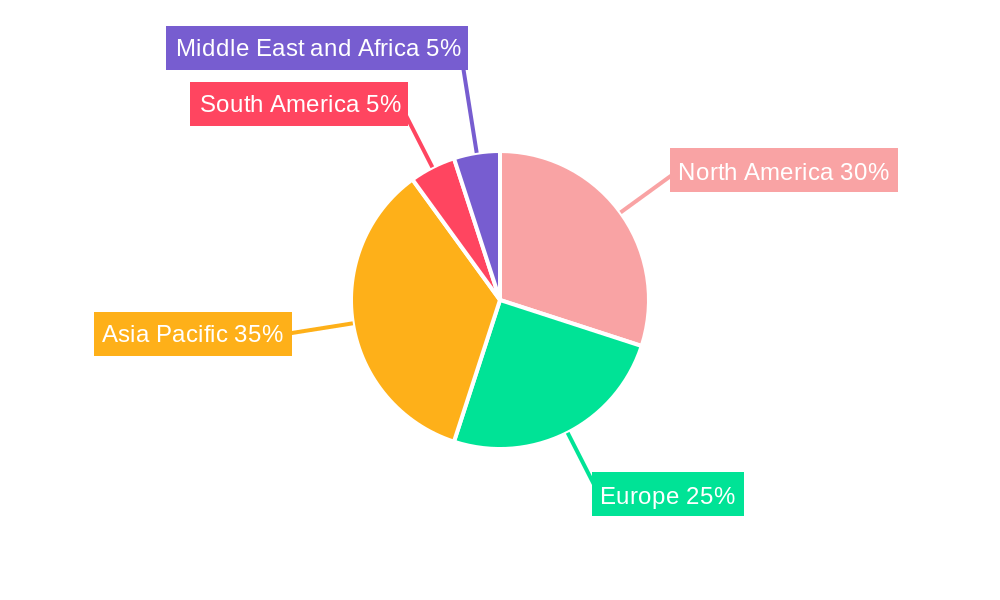
Nuclear Energy Market Regional Market Share
Geographic Coverage of Nuclear Energy Market
Nuclear Energy Market REPORT HIGHLIGHTS
| Aspects | Details |
|---|---|
| Study Period | 2020-2034 |
| Base Year | 2025 |
| Estimated Year | 2026 |
| Forecast Period | 2026-2034 |
| Historical Period | 2020-2025 |
| Growth Rate | CAGR of 3.4% from 2020-2034 |
| Segmentation |
|
Table of Contents
- 1. Introduction
- 1.1. Research Scope
- 1.2. Market Segmentation
- 1.3. Research Methodology
- 1.4. Definitions and Assumptions
- 2. Executive Summary
- 2.1. Introduction
- 3. Market Dynamics
- 3.1. Introduction
- 3.2. Market Drivers
- 3.2.1. 4.; Increase in Demand for Clean Energy4.; Plant Lifetime Extensions With Favorable Policies
- 3.3. Market Restrains
- 3.3.1. 4.; Intense Competition From Renewable Energy Sources4.; Accidents and Uncertainty over the Cost Effectiveness
- 3.4. Market Trends
- 3.4.1. Energy Segment Expected to Dominate the Market
- 4. Market Factor Analysis
- 4.1. Porters Five Forces
- 4.2. Supply/Value Chain
- 4.3. PESTEL analysis
- 4.4. Market Entropy
- 4.5. Patent/Trademark Analysis
- 5. Global Nuclear Energy Market Analysis, Insights and Forecast, 2020-2032
- 5.1. Market Analysis, Insights and Forecast - by Application (Qualitative Analysis)
- 5.1.1. Energy
- 5.1.2. Defense
- 5.1.3. Other Applications
- 5.2. Market Analysis, Insights and Forecast - by Reactor Type
- 5.2.1. Pressuri
- 5.2.2. Boiling Water Reactor
- 5.2.3. High-temperature Gas-cooled Reactor
- 5.2.4. Liquid-metal Fast-breeder Reactor
- 5.2.5. Other Reactor Types
- 5.3. Market Analysis, Insights and Forecast - by Region
- 5.3.1. North America
- 5.3.2. Europe
- 5.3.3. Asia Pacific
- 5.3.4. South America
- 5.3.5. Middle East and Africa
- 5.1. Market Analysis, Insights and Forecast - by Application (Qualitative Analysis)
- 6. North America Nuclear Energy Market Analysis, Insights and Forecast, 2020-2032
- 6.1. Market Analysis, Insights and Forecast - by Application (Qualitative Analysis)
- 6.1.1. Energy
- 6.1.2. Defense
- 6.1.3. Other Applications
- 6.2. Market Analysis, Insights and Forecast - by Reactor Type
- 6.2.1. Pressuri
- 6.2.2. Boiling Water Reactor
- 6.2.3. High-temperature Gas-cooled Reactor
- 6.2.4. Liquid-metal Fast-breeder Reactor
- 6.2.5. Other Reactor Types
- 6.1. Market Analysis, Insights and Forecast - by Application (Qualitative Analysis)
- 7. Europe Nuclear Energy Market Analysis, Insights and Forecast, 2020-2032
- 7.1. Market Analysis, Insights and Forecast - by Application (Qualitative Analysis)
- 7.1.1. Energy
- 7.1.2. Defense
- 7.1.3. Other Applications
- 7.2. Market Analysis, Insights and Forecast - by Reactor Type
- 7.2.1. Pressuri
- 7.2.2. Boiling Water Reactor
- 7.2.3. High-temperature Gas-cooled Reactor
- 7.2.4. Liquid-metal Fast-breeder Reactor
- 7.2.5. Other Reactor Types
- 7.1. Market Analysis, Insights and Forecast - by Application (Qualitative Analysis)
- 8. Asia Pacific Nuclear Energy Market Analysis, Insights and Forecast, 2020-2032
- 8.1. Market Analysis, Insights and Forecast - by Application (Qualitative Analysis)
- 8.1.1. Energy
- 8.1.2. Defense
- 8.1.3. Other Applications
- 8.2. Market Analysis, Insights and Forecast - by Reactor Type
- 8.2.1. Pressuri
- 8.2.2. Boiling Water Reactor
- 8.2.3. High-temperature Gas-cooled Reactor
- 8.2.4. Liquid-metal Fast-breeder Reactor
- 8.2.5. Other Reactor Types
- 8.1. Market Analysis, Insights and Forecast - by Application (Qualitative Analysis)
- 9. South America Nuclear Energy Market Analysis, Insights and Forecast, 2020-2032
- 9.1. Market Analysis, Insights and Forecast - by Application (Qualitative Analysis)
- 9.1.1. Energy
- 9.1.2. Defense
- 9.1.3. Other Applications
- 9.2. Market Analysis, Insights and Forecast - by Reactor Type
- 9.2.1. Pressuri
- 9.2.2. Boiling Water Reactor
- 9.2.3. High-temperature Gas-cooled Reactor
- 9.2.4. Liquid-metal Fast-breeder Reactor
- 9.2.5. Other Reactor Types
- 9.1. Market Analysis, Insights and Forecast - by Application (Qualitative Analysis)
- 10. Middle East and Africa Nuclear Energy Market Analysis, Insights and Forecast, 2020-2032
- 10.1. Market Analysis, Insights and Forecast - by Application (Qualitative Analysis)
- 10.1.1. Energy
- 10.1.2. Defense
- 10.1.3. Other Applications
- 10.2. Market Analysis, Insights and Forecast - by Reactor Type
- 10.2.1. Pressuri
- 10.2.2. Boiling Water Reactor
- 10.2.3. High-temperature Gas-cooled Reactor
- 10.2.4. Liquid-metal Fast-breeder Reactor
- 10.2.5. Other Reactor Types
- 10.1. Market Analysis, Insights and Forecast - by Application (Qualitative Analysis)
- 11. Competitive Analysis
- 11.1. Global Market Share Analysis 2025
- 11.2. Company Profiles
- 11.2.1 BWX Technologies Inc
- 11.2.1.1. Overview
- 11.2.1.2. Products
- 11.2.1.3. SWOT Analysis
- 11.2.1.4. Recent Developments
- 11.2.1.5. Financials (Based on Availability)
- 11.2.2 Westinghouse Electric Company LLC
- 11.2.2.1. Overview
- 11.2.2.2. Products
- 11.2.2.3. SWOT Analysis
- 11.2.2.4. Recent Developments
- 11.2.2.5. Financials (Based on Availability)
- 11.2.3 Bilfinger SE
- 11.2.3.1. Overview
- 11.2.3.2. Products
- 11.2.3.3. SWOT Analysis
- 11.2.3.4. Recent Developments
- 11.2.3.5. Financials (Based on Availability)
- 11.2.4 China National Nuclear Corporation
- 11.2.4.1. Overview
- 11.2.4.2. Products
- 11.2.4.3. SWOT Analysis
- 11.2.4.4. Recent Developments
- 11.2.4.5. Financials (Based on Availability)
- 11.2.5 Doosan Enerbility Co Ltd
- 11.2.5.1. Overview
- 11.2.5.2. Products
- 11.2.5.3. SWOT Analysis
- 11.2.5.4. Recent Developments
- 11.2.5.5. Financials (Based on Availability)
- 11.2.6 SKODA JS AS
- 11.2.6.1. Overview
- 11.2.6.2. Products
- 11.2.6.3. SWOT Analysis
- 11.2.6.4. Recent Developments
- 11.2.6.5. Financials (Based on Availability)
- 11.2.7 Electricite de France SA (EDF)
- 11.2.7.1. Overview
- 11.2.7.2. Products
- 11.2.7.3. SWOT Analysis
- 11.2.7.4. Recent Developments
- 11.2.7.5. Financials (Based on Availability)
- 11.2.8 Rosatom State Atomic Energy Corporation
- 11.2.8.1. Overview
- 11.2.8.2. Products
- 11.2.8.3. SWOT Analysis
- 11.2.8.4. Recent Developments
- 11.2.8.5. Financials (Based on Availability)
- 11.2.9 Bechtel Group Inc
- 11.2.9.1. Overview
- 11.2.9.2. Products
- 11.2.9.3. SWOT Analysis
- 11.2.9.4. Recent Developments
- 11.2.9.5. Financials (Based on Availability)
- 11.2.10 KEPCO Engineering & Construction*List Not Exhaustive 6 4 Market Ranking/Share (%) Analysi
- 11.2.10.1. Overview
- 11.2.10.2. Products
- 11.2.10.3. SWOT Analysis
- 11.2.10.4. Recent Developments
- 11.2.10.5. Financials (Based on Availability)
- 11.2.11 Japan Atomic Power Company
- 11.2.11.1. Overview
- 11.2.11.2. Products
- 11.2.11.3. SWOT Analysis
- 11.2.11.4. Recent Developments
- 11.2.11.5. Financials (Based on Availability)
- 11.2.12 Duke Energy Corporation
- 11.2.12.1. Overview
- 11.2.12.2. Products
- 11.2.12.3. SWOT Analysis
- 11.2.12.4. Recent Developments
- 11.2.12.5. Financials (Based on Availability)
- 11.2.13 Mitsubishi Heavy Industries Ltd
- 11.2.13.1. Overview
- 11.2.13.2. Products
- 11.2.13.3. SWOT Analysis
- 11.2.13.4. Recent Developments
- 11.2.13.5. Financials (Based on Availability)
- 11.2.14 GE-Hitachi Nuclear Energy Inc
- 11.2.14.1. Overview
- 11.2.14.2. Products
- 11.2.14.3. SWOT Analysis
- 11.2.14.4. Recent Developments
- 11.2.14.5. Financials (Based on Availability)
- 11.2.1 BWX Technologies Inc
List of Figures
- Figure 1: Global Nuclear Energy Market Revenue Breakdown (USD Billion, %) by Region 2025 & 2033
- Figure 2: Global Nuclear Energy Market Volume Breakdown (gigawatt, %) by Region 2025 & 2033
- Figure 3: North America Nuclear Energy Market Revenue (USD Billion), by Application (Qualitative Analysis) 2025 & 2033
- Figure 4: North America Nuclear Energy Market Volume (gigawatt), by Application (Qualitative Analysis) 2025 & 2033
- Figure 5: North America Nuclear Energy Market Revenue Share (%), by Application (Qualitative Analysis) 2025 & 2033
- Figure 6: North America Nuclear Energy Market Volume Share (%), by Application (Qualitative Analysis) 2025 & 2033
- Figure 7: North America Nuclear Energy Market Revenue (USD Billion), by Reactor Type 2025 & 2033
- Figure 8: North America Nuclear Energy Market Volume (gigawatt), by Reactor Type 2025 & 2033
- Figure 9: North America Nuclear Energy Market Revenue Share (%), by Reactor Type 2025 & 2033
- Figure 10: North America Nuclear Energy Market Volume Share (%), by Reactor Type 2025 & 2033
- Figure 11: North America Nuclear Energy Market Revenue (USD Billion), by Country 2025 & 2033
- Figure 12: North America Nuclear Energy Market Volume (gigawatt), by Country 2025 & 2033
- Figure 13: North America Nuclear Energy Market Revenue Share (%), by Country 2025 & 2033
- Figure 14: North America Nuclear Energy Market Volume Share (%), by Country 2025 & 2033
- Figure 15: Europe Nuclear Energy Market Revenue (USD Billion), by Application (Qualitative Analysis) 2025 & 2033
- Figure 16: Europe Nuclear Energy Market Volume (gigawatt), by Application (Qualitative Analysis) 2025 & 2033
- Figure 17: Europe Nuclear Energy Market Revenue Share (%), by Application (Qualitative Analysis) 2025 & 2033
- Figure 18: Europe Nuclear Energy Market Volume Share (%), by Application (Qualitative Analysis) 2025 & 2033
- Figure 19: Europe Nuclear Energy Market Revenue (USD Billion), by Reactor Type 2025 & 2033
- Figure 20: Europe Nuclear Energy Market Volume (gigawatt), by Reactor Type 2025 & 2033
- Figure 21: Europe Nuclear Energy Market Revenue Share (%), by Reactor Type 2025 & 2033
- Figure 22: Europe Nuclear Energy Market Volume Share (%), by Reactor Type 2025 & 2033
- Figure 23: Europe Nuclear Energy Market Revenue (USD Billion), by Country 2025 & 2033
- Figure 24: Europe Nuclear Energy Market Volume (gigawatt), by Country 2025 & 2033
- Figure 25: Europe Nuclear Energy Market Revenue Share (%), by Country 2025 & 2033
- Figure 26: Europe Nuclear Energy Market Volume Share (%), by Country 2025 & 2033
- Figure 27: Asia Pacific Nuclear Energy Market Revenue (USD Billion), by Application (Qualitative Analysis) 2025 & 2033
- Figure 28: Asia Pacific Nuclear Energy Market Volume (gigawatt), by Application (Qualitative Analysis) 2025 & 2033
- Figure 29: Asia Pacific Nuclear Energy Market Revenue Share (%), by Application (Qualitative Analysis) 2025 & 2033
- Figure 30: Asia Pacific Nuclear Energy Market Volume Share (%), by Application (Qualitative Analysis) 2025 & 2033
- Figure 31: Asia Pacific Nuclear Energy Market Revenue (USD Billion), by Reactor Type 2025 & 2033
- Figure 32: Asia Pacific Nuclear Energy Market Volume (gigawatt), by Reactor Type 2025 & 2033
- Figure 33: Asia Pacific Nuclear Energy Market Revenue Share (%), by Reactor Type 2025 & 2033
- Figure 34: Asia Pacific Nuclear Energy Market Volume Share (%), by Reactor Type 2025 & 2033
- Figure 35: Asia Pacific Nuclear Energy Market Revenue (USD Billion), by Country 2025 & 2033
- Figure 36: Asia Pacific Nuclear Energy Market Volume (gigawatt), by Country 2025 & 2033
- Figure 37: Asia Pacific Nuclear Energy Market Revenue Share (%), by Country 2025 & 2033
- Figure 38: Asia Pacific Nuclear Energy Market Volume Share (%), by Country 2025 & 2033
- Figure 39: South America Nuclear Energy Market Revenue (USD Billion), by Application (Qualitative Analysis) 2025 & 2033
- Figure 40: South America Nuclear Energy Market Volume (gigawatt), by Application (Qualitative Analysis) 2025 & 2033
- Figure 41: South America Nuclear Energy Market Revenue Share (%), by Application (Qualitative Analysis) 2025 & 2033
- Figure 42: South America Nuclear Energy Market Volume Share (%), by Application (Qualitative Analysis) 2025 & 2033
- Figure 43: South America Nuclear Energy Market Revenue (USD Billion), by Reactor Type 2025 & 2033
- Figure 44: South America Nuclear Energy Market Volume (gigawatt), by Reactor Type 2025 & 2033
- Figure 45: South America Nuclear Energy Market Revenue Share (%), by Reactor Type 2025 & 2033
- Figure 46: South America Nuclear Energy Market Volume Share (%), by Reactor Type 2025 & 2033
- Figure 47: South America Nuclear Energy Market Revenue (USD Billion), by Country 2025 & 2033
- Figure 48: South America Nuclear Energy Market Volume (gigawatt), by Country 2025 & 2033
- Figure 49: South America Nuclear Energy Market Revenue Share (%), by Country 2025 & 2033
- Figure 50: South America Nuclear Energy Market Volume Share (%), by Country 2025 & 2033
- Figure 51: Middle East and Africa Nuclear Energy Market Revenue (USD Billion), by Application (Qualitative Analysis) 2025 & 2033
- Figure 52: Middle East and Africa Nuclear Energy Market Volume (gigawatt), by Application (Qualitative Analysis) 2025 & 2033
- Figure 53: Middle East and Africa Nuclear Energy Market Revenue Share (%), by Application (Qualitative Analysis) 2025 & 2033
- Figure 54: Middle East and Africa Nuclear Energy Market Volume Share (%), by Application (Qualitative Analysis) 2025 & 2033
- Figure 55: Middle East and Africa Nuclear Energy Market Revenue (USD Billion), by Reactor Type 2025 & 2033
- Figure 56: Middle East and Africa Nuclear Energy Market Volume (gigawatt), by Reactor Type 2025 & 2033
- Figure 57: Middle East and Africa Nuclear Energy Market Revenue Share (%), by Reactor Type 2025 & 2033
- Figure 58: Middle East and Africa Nuclear Energy Market Volume Share (%), by Reactor Type 2025 & 2033
- Figure 59: Middle East and Africa Nuclear Energy Market Revenue (USD Billion), by Country 2025 & 2033
- Figure 60: Middle East and Africa Nuclear Energy Market Volume (gigawatt), by Country 2025 & 2033
- Figure 61: Middle East and Africa Nuclear Energy Market Revenue Share (%), by Country 2025 & 2033
- Figure 62: Middle East and Africa Nuclear Energy Market Volume Share (%), by Country 2025 & 2033
List of Tables
- Table 1: Global Nuclear Energy Market Revenue USD Billion Forecast, by Application (Qualitative Analysis) 2020 & 2033
- Table 2: Global Nuclear Energy Market Volume gigawatt Forecast, by Application (Qualitative Analysis) 2020 & 2033
- Table 3: Global Nuclear Energy Market Revenue USD Billion Forecast, by Reactor Type 2020 & 2033
- Table 4: Global Nuclear Energy Market Volume gigawatt Forecast, by Reactor Type 2020 & 2033
- Table 5: Global Nuclear Energy Market Revenue USD Billion Forecast, by Region 2020 & 2033
- Table 6: Global Nuclear Energy Market Volume gigawatt Forecast, by Region 2020 & 2033
- Table 7: Global Nuclear Energy Market Revenue USD Billion Forecast, by Application (Qualitative Analysis) 2020 & 2033
- Table 8: Global Nuclear Energy Market Volume gigawatt Forecast, by Application (Qualitative Analysis) 2020 & 2033
- Table 9: Global Nuclear Energy Market Revenue USD Billion Forecast, by Reactor Type 2020 & 2033
- Table 10: Global Nuclear Energy Market Volume gigawatt Forecast, by Reactor Type 2020 & 2033
- Table 11: Global Nuclear Energy Market Revenue USD Billion Forecast, by Country 2020 & 2033
- Table 12: Global Nuclear Energy Market Volume gigawatt Forecast, by Country 2020 & 2033
- Table 13: United States Nuclear Energy Market Revenue (USD Billion) Forecast, by Application 2020 & 2033
- Table 14: United States Nuclear Energy Market Volume (gigawatt) Forecast, by Application 2020 & 2033
- Table 15: Canada Nuclear Energy Market Revenue (USD Billion) Forecast, by Application 2020 & 2033
- Table 16: Canada Nuclear Energy Market Volume (gigawatt) Forecast, by Application 2020 & 2033
- Table 17: Rest of North America Nuclear Energy Market Revenue (USD Billion) Forecast, by Application 2020 & 2033
- Table 18: Rest of North America Nuclear Energy Market Volume (gigawatt) Forecast, by Application 2020 & 2033
- Table 19: Global Nuclear Energy Market Revenue USD Billion Forecast, by Application (Qualitative Analysis) 2020 & 2033
- Table 20: Global Nuclear Energy Market Volume gigawatt Forecast, by Application (Qualitative Analysis) 2020 & 2033
- Table 21: Global Nuclear Energy Market Revenue USD Billion Forecast, by Reactor Type 2020 & 2033
- Table 22: Global Nuclear Energy Market Volume gigawatt Forecast, by Reactor Type 2020 & 2033
- Table 23: Global Nuclear Energy Market Revenue USD Billion Forecast, by Country 2020 & 2033
- Table 24: Global Nuclear Energy Market Volume gigawatt Forecast, by Country 2020 & 2033
- Table 25: Germany Nuclear Energy Market Revenue (USD Billion) Forecast, by Application 2020 & 2033
- Table 26: Germany Nuclear Energy Market Volume (gigawatt) Forecast, by Application 2020 & 2033
- Table 27: United Kingdom Nuclear Energy Market Revenue (USD Billion) Forecast, by Application 2020 & 2033
- Table 28: United Kingdom Nuclear Energy Market Volume (gigawatt) Forecast, by Application 2020 & 2033
- Table 29: Russia Nuclear Energy Market Revenue (USD Billion) Forecast, by Application 2020 & 2033
- Table 30: Russia Nuclear Energy Market Volume (gigawatt) Forecast, by Application 2020 & 2033
- Table 31: France Nuclear Energy Market Revenue (USD Billion) Forecast, by Application 2020 & 2033
- Table 32: France Nuclear Energy Market Volume (gigawatt) Forecast, by Application 2020 & 2033
- Table 33: Rest of Europe Nuclear Energy Market Revenue (USD Billion) Forecast, by Application 2020 & 2033
- Table 34: Rest of Europe Nuclear Energy Market Volume (gigawatt) Forecast, by Application 2020 & 2033
- Table 35: Global Nuclear Energy Market Revenue USD Billion Forecast, by Application (Qualitative Analysis) 2020 & 2033
- Table 36: Global Nuclear Energy Market Volume gigawatt Forecast, by Application (Qualitative Analysis) 2020 & 2033
- Table 37: Global Nuclear Energy Market Revenue USD Billion Forecast, by Reactor Type 2020 & 2033
- Table 38: Global Nuclear Energy Market Volume gigawatt Forecast, by Reactor Type 2020 & 2033
- Table 39: Global Nuclear Energy Market Revenue USD Billion Forecast, by Country 2020 & 2033
- Table 40: Global Nuclear Energy Market Volume gigawatt Forecast, by Country 2020 & 2033
- Table 41: China Nuclear Energy Market Revenue (USD Billion) Forecast, by Application 2020 & 2033
- Table 42: China Nuclear Energy Market Volume (gigawatt) Forecast, by Application 2020 & 2033
- Table 43: India Nuclear Energy Market Revenue (USD Billion) Forecast, by Application 2020 & 2033
- Table 44: India Nuclear Energy Market Volume (gigawatt) Forecast, by Application 2020 & 2033
- Table 45: Japan Nuclear Energy Market Revenue (USD Billion) Forecast, by Application 2020 & 2033
- Table 46: Japan Nuclear Energy Market Volume (gigawatt) Forecast, by Application 2020 & 2033
- Table 47: South Korea Nuclear Energy Market Revenue (USD Billion) Forecast, by Application 2020 & 2033
- Table 48: South Korea Nuclear Energy Market Volume (gigawatt) Forecast, by Application 2020 & 2033
- Table 49: Rest of Asia Pacific Nuclear Energy Market Revenue (USD Billion) Forecast, by Application 2020 & 2033
- Table 50: Rest of Asia Pacific Nuclear Energy Market Volume (gigawatt) Forecast, by Application 2020 & 2033
- Table 51: Global Nuclear Energy Market Revenue USD Billion Forecast, by Application (Qualitative Analysis) 2020 & 2033
- Table 52: Global Nuclear Energy Market Volume gigawatt Forecast, by Application (Qualitative Analysis) 2020 & 2033
- Table 53: Global Nuclear Energy Market Revenue USD Billion Forecast, by Reactor Type 2020 & 2033
- Table 54: Global Nuclear Energy Market Volume gigawatt Forecast, by Reactor Type 2020 & 2033
- Table 55: Global Nuclear Energy Market Revenue USD Billion Forecast, by Country 2020 & 2033
- Table 56: Global Nuclear Energy Market Volume gigawatt Forecast, by Country 2020 & 2033
- Table 57: Brazil Nuclear Energy Market Revenue (USD Billion) Forecast, by Application 2020 & 2033
- Table 58: Brazil Nuclear Energy Market Volume (gigawatt) Forecast, by Application 2020 & 2033
- Table 59: Argentina Nuclear Energy Market Revenue (USD Billion) Forecast, by Application 2020 & 2033
- Table 60: Argentina Nuclear Energy Market Volume (gigawatt) Forecast, by Application 2020 & 2033
- Table 61: Rest of South America Nuclear Energy Market Revenue (USD Billion) Forecast, by Application 2020 & 2033
- Table 62: Rest of South America Nuclear Energy Market Volume (gigawatt) Forecast, by Application 2020 & 2033
- Table 63: Global Nuclear Energy Market Revenue USD Billion Forecast, by Application (Qualitative Analysis) 2020 & 2033
- Table 64: Global Nuclear Energy Market Volume gigawatt Forecast, by Application (Qualitative Analysis) 2020 & 2033
- Table 65: Global Nuclear Energy Market Revenue USD Billion Forecast, by Reactor Type 2020 & 2033
- Table 66: Global Nuclear Energy Market Volume gigawatt Forecast, by Reactor Type 2020 & 2033
- Table 67: Global Nuclear Energy Market Revenue USD Billion Forecast, by Country 2020 & 2033
- Table 68: Global Nuclear Energy Market Volume gigawatt Forecast, by Country 2020 & 2033
- Table 69: United Arab Emirates Nuclear Energy Market Revenue (USD Billion) Forecast, by Application 2020 & 2033
- Table 70: United Arab Emirates Nuclear Energy Market Volume (gigawatt) Forecast, by Application 2020 & 2033
- Table 71: Saudi Arabia Nuclear Energy Market Revenue (USD Billion) Forecast, by Application 2020 & 2033
- Table 72: Saudi Arabia Nuclear Energy Market Volume (gigawatt) Forecast, by Application 2020 & 2033
- Table 73: South Africa Nuclear Energy Market Revenue (USD Billion) Forecast, by Application 2020 & 2033
- Table 74: South Africa Nuclear Energy Market Volume (gigawatt) Forecast, by Application 2020 & 2033
- Table 75: Iran Nuclear Energy Market Revenue (USD Billion) Forecast, by Application 2020 & 2033
- Table 76: Iran Nuclear Energy Market Volume (gigawatt) Forecast, by Application 2020 & 2033
- Table 77: Rest of Middle East and Africa Nuclear Energy Market Revenue (USD Billion) Forecast, by Application 2020 & 2033
- Table 78: Rest of Middle East and Africa Nuclear Energy Market Volume (gigawatt) Forecast, by Application 2020 & 2033
Frequently Asked Questions
1. What is the projected Compound Annual Growth Rate (CAGR) of the Nuclear Energy Market?
The projected CAGR is approximately 3.4%.
2. Which companies are prominent players in the Nuclear Energy Market?
Key companies in the market include BWX Technologies Inc, Westinghouse Electric Company LLC, Bilfinger SE, China National Nuclear Corporation, Doosan Enerbility Co Ltd, SKODA JS AS, Electricite de France SA (EDF), Rosatom State Atomic Energy Corporation, Bechtel Group Inc, KEPCO Engineering & Construction*List Not Exhaustive 6 4 Market Ranking/Share (%) Analysi, Japan Atomic Power Company, Duke Energy Corporation, Mitsubishi Heavy Industries Ltd, GE-Hitachi Nuclear Energy Inc.
3. What are the main segments of the Nuclear Energy Market?
The market segments include Application (Qualitative Analysis) , Reactor Type.
4. Can you provide details about the market size?
The market size is estimated to be USD 35.99 USD Billion as of 2022.
5. What are some drivers contributing to market growth?
4.; Increase in Demand for Clean Energy4.; Plant Lifetime Extensions With Favorable Policies.
6. What are the notable trends driving market growth?
Energy Segment Expected to Dominate the Market.
7. Are there any restraints impacting market growth?
4.; Intense Competition From Renewable Energy Sources4.; Accidents and Uncertainty over the Cost Effectiveness.
8. Can you provide examples of recent developments in the market?
February 2024: Iran commenced the construction of four additional nuclear power plants in the southern part of the country. These plants will have a combined capacity of 5,000 MW. The plants will be located in the port town of Sirik on Iran's East coast, about 1,150 km South of Tehran. The project is estimated to cost more than USD 20 billion. Each plant is projected to consume 35 tonnes of nuclear fuel per annum.
9. What pricing options are available for accessing the report?
Pricing options include single-user, multi-user, and enterprise licenses priced at USD 4750, USD 5250, and USD 8750 respectively.
10. Is the market size provided in terms of value or volume?
The market size is provided in terms of value, measured in USD Billion and volume, measured in gigawatt.
11. Are there any specific market keywords associated with the report?
Yes, the market keyword associated with the report is "Nuclear Energy Market," which aids in identifying and referencing the specific market segment covered.
12. How do I determine which pricing option suits my needs best?
The pricing options vary based on user requirements and access needs. Individual users may opt for single-user licenses, while businesses requiring broader access may choose multi-user or enterprise licenses for cost-effective access to the report.
13. Are there any additional resources or data provided in the Nuclear Energy Market report?
While the report offers comprehensive insights, it's advisable to review the specific contents or supplementary materials provided to ascertain if additional resources or data are available.
14. How can I stay updated on further developments or reports in the Nuclear Energy Market?
To stay informed about further developments, trends, and reports in the Nuclear Energy Market, consider subscribing to industry newsletters, following relevant companies and organizations, or regularly checking reputable industry news sources and publications.
Methodology
Step 1 - Identification of Relevant Samples Size from Population Database


Step 2 - Approaches for Defining Global Market Size (Value, Volume* & Price*)

Note*: In applicable scenarios
Step 3 - Data Sources
Primary Research
- Web Analytics
- Survey Reports
- Research Institute
- Latest Research Reports
- Opinion Leaders
Secondary Research
- Annual Reports
- White Paper
- Latest Press Release
- Industry Association
- Paid Database
- Investor Presentations

Step 4 - Data Triangulation
Involves using different sources of information in order to increase the validity of a study
These sources are likely to be stakeholders in a program - participants, other researchers, program staff, other community members, and so on.
Then we put all data in single framework & apply various statistical tools to find out the dynamic on the market.
During the analysis stage, feedback from the stakeholder groups would be compared to determine areas of agreement as well as areas of divergence